


 |
市场调查报告书
商品编码
1522834
全球五年市场预测(2024-2028):个人电脑、伺服器、主机板、Wi-Fi 连线装置、智慧型手机Global Five-Year Market Forecast 2024-2028: PCs, Servers, Motherboards, Wi-Fi Connected Devices, and Smartphones |
||||||
该报告全面概述了全球笔记型电脑、桌上型电脑、伺服器、主机板、Wi-Fi 连接设备和智慧型手机产业,并对未来五年(2024-2028 年)的市场规模趋势进行了展望。
笔记型电脑
预计2024年全球PC出货量将达到2.461亿台,2025年将达2.655亿台,较上年成长8.3%。2024年至2028年的复合年增长率预计为2.7%。本报告重点关注传统 PC,包括笔记型电脑和桌上型电脑,不包括平板电脑。
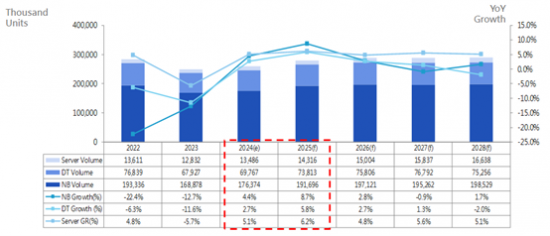
註 1:GR = 年成长率 註 2:桌上型电脑 (DT) 产品数量包含 AIO PC(一体机)数量 资料来源:MIC,2024 年 8 月
调查企业包括经营ODM、OEM、EMS、CEM、OBM和自有品牌业务的台湾笔记型电脑製造商,其生产基地和出货目的地包括台湾、中国、日本、韩国,包括东南亚、北美、拉丁美洲、西欧等欧洲国家、等地区。
随着全球经济衰退持续,2023年全球笔记型电脑市场依然低迷。不过,在经历了连续两年的需求下滑之后,笔记型电脑供应链厂商对2024年的復苏持乐观态度。
桌上型电脑
2023年全球桌上型电脑产业大幅下滑,出货量达到67,927,000台,较2022年下降11.6%。儘管桌面PC供应链消除了过剩库存,库存水准保持健康,但市场仍受到全球经济低迷和高通膨率的影响,导致消费者对PC产品的需求持续疲软。
Wi-Fi 连线装置
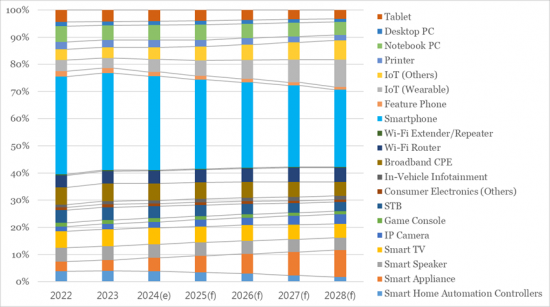
本报告研究了各种 Wi-Fi 连线设备,并将其分为三个使用领域:资讯设备、行动装置和智慧连网家庭设备。本报告包含的设备包括智慧型手机、功能手机、物联网(穿戴式装置)、物联网(其他)、印表机、笔记型电脑、桌上型电脑、平板电脑、宽频CPE、Wi-Fi 路由器、Wi-Fi 扩展器/中继器和智慧家庭自动化。其中,家电(其他)包括可携式媒体企业(PMP)、电子书阅读器、数位相机、数位相框、智慧遥控器等。IoT(穿戴式装置)还包括智慧手錶、健身手环、XR装置等,IoT(其他)包括机器人、智慧家庭週边设备等。
整体市场规模预计将持续扩大。预计2028年,全球Wi-Fi连接设备市场将超过44亿台设备,2023年至2028年的CAGR(复合年增长率)预计为5.1%。
2023年全球Wi-Fi连线设备出货量较去年同期下降3.1%至32.2亿台。随着库存清理接近完成以及市场普遍对经济復苏持乐观态度,Wi-Fi连接设备出货量预计将从低点回升,并在2024年同比增长6.5%。
根据本报告的调查结果,2023年Wi-Fi连线产品(前5名产品)的出货量占有率由上至下依序为智慧型手机(35.7%)、宽频CPE(6.5%)、智慧电视(6.3% )。
资料来源:MIC,2024 年 6 月
伺服器系统
随着生成式人工智慧的出现和企业应用程式大规模语言模型 (LLM) 的最佳化,全球伺服器市场预计将在 2024 年復苏。这种復苏主要是由于人工智慧伺服器的需求增加,预计将推动全球伺服器市场的復苏。本报告重点在于以三种 CPU 架构分类的伺服器系统:x86、RISC(精简指令集运算)等。此外,该报告还按外形规格(塔式、刀片式、机架式)和组装等级(包括完整系统等级和准系统等级)对伺服器进行了细分。
主机板
由于多项不利因素,2023年全球主机板市场约7,540万台,较前一年下降10.7%。预计2024年出货量将达7,840万台,较上年成长3.9%。这一增长是由商业和个人消费适度增长推动的,因为与 2022-2023 年相比,通膨压力有所改善。
本报告重点关注主机板,并按 CPU 连接器类型(LGA1150、LGA1151、Socket AM3+、Socket AM4、Socket TR4 等)对主机板进行分类。出货类型包括准系统、完整系统和独立主机板。有关上述产品类别的定义,请参阅以下部分。
受访企业均为业务模式为OBM (Original Brand Manufacturer)、ODM (Original Design Manufacturer)、OEM (Original Equipment Manufacturer)、EMS (Electronics Manufacturing Services)、CEM (Contract Electronics Manufacturer)及自有品牌的全球主机板製造商。生产地点和运送地区包括台湾、中国大陆、日本、韩国、其他亚洲国家、北美、拉丁美洲、西欧、其他欧洲国家和世界其他国家 (RoW)。上述地理范围定义将在以下各节中进行解释。
智慧型手机
虽然到 2023 年,智慧型手机仍将是最大的 Wi-Fi 使用类别,但自 2022 年以来的下降趋势仍在继续。尤其是中高阶车型的购买力较往年减弱。儘管如此,预计到2028年全球智慧型手机出货量将达到约13.19亿部,2024年至2028年复合年增长率为2.26%。除了智慧型手机和笔记型电脑等核心产品外,智慧电视和智慧音箱等智慧家电的成长速度也可能出现逆转。
请注意,本报告涵盖行动电话,不包括无线电话和 PHS(个人手持系统)电话等低频电话。手机依行动通讯标准及作业系统分为GSM、GPRS、EDGE、WCDMA、TD-SCDMA、cdmaOne、CDMA2000 1X、CDMA2000 1x EV-DO、iDEN。
目录
- 桌上型电脑
- 全球PC(不含平板电脑)出货量(2020-2028)
- 全球桌上型电脑出货量(2020-2028)
- 全球桌上型电脑出货量(2021年第一季至2023年第四季)
- 全球主机板/桌上型电脑出货量比例(2020-2028)
- 全球桌上型电脑出货量:依地区划分(2020-2024)
- 全球桌上型电脑出货量占有率:按地区划分(2020-2024 年)
- 依顾客类型划分的全球桌上型电脑出货量(2020-2024)
- 全球桌上型电脑出货量占有率:依顾客类型划分(2020-2024 年)
- 全球桌上型电脑出货量:依 CPU 连接器类型划分(2022 年第一季 - 2024 年第二季)
- 全球桌上型电脑出货量占有率:按 CPU 连接器类型划分(2022 年第一季 - 2024 年第二季)
- 情报洞察
- 调查范围/定义
- 笔记型电脑
- 全球PC(不含平板电脑)出货量(2020-2028)
- 全球笔记型电脑出货量(2020-2028)
- 全球笔记型电脑出货量(2022年第一季至2024年第四季)
- 全球笔记型电脑出货量:按地区划分(2020-2024年)
- 全球笔记型电脑出货量占有率:按地区划分(2020-2024年)
- 全球笔记型电脑出货量:按面板尺寸划分(2022 年第一季 - 2024 年第二季)
- 全球笔记型电脑出货量占有率:按面板尺寸划分(2022 年第一季 - 2024 年第二季)
- 按计算平台划分的全球笔记型电脑出货量(2022 年第一季 - 2024 年第二季)
- 全球笔记型电脑出货量占有率:按计算平台划分(2022 年第一季 - 2024 年第二季)
- 情报洞察
- 调查范围/定义
- 服务器
- 全球伺服器出货量(2020-2028)
- 全球伺服器出货量(2022 年第一季 - 2024 年第四季)
- 全球伺服器出货量:依地区划分(2020-2024)
- 全球伺服器出货量占有率:按地区划分(2020-2024 年)
- 全球伺服器出货量:依 CPU 架构划分(2020-2024 年)
- 全球伺服器出货量占有率:依 CPU 架构划分(2020-2024 年)
- 情报洞察
- 调查范围/定义
- 母板
- 全球主机板出货量(2020-2028)
- 全球主机板出货量(2022年第一季至2024年第四季)
- 全球主机板/桌上型电脑出货量比例(2020-2028)
- 全球主机板出货量依地区划分(2020-2024)
- 全球主机板出货量占有率:按地区划分(2020-2024 年)
- 情报洞察
- 调查范围/定义
- 手机
- 全球手机市场:依设备类型划分(2022-2028)
- 按设备类型划分的全球手机市场占有率(2022-2028)
- 全球智慧型手机市场:按地区划分(2022-2028)
- 全球智慧型手机市场占有率:依地区划分(2022-2028)
- 全球智慧型手机市场:依价格范围划分(2022-2028)
- 全球智慧型手机市场占有率:依价格范围划分(2022-2028)
- 全球智慧型手机市场:依作业系统划分(2022-2028)
- 全球智慧型手机市场占有率:依作业系统划分(2022-2028)
- 情报洞察
- 调查范围/定义
- Wi-Fi 连线装置
- 全球Wi-Fi设备市场趋势
- Wi-Fi 连线装置市场分析
- 出货量分析
- 出货量占比分析
- 预测出货量
- 资讯终端
- 移动设备
- 网络设备
- 智慧互联家居设备
- 衡量出货占有率预测
- 资讯设备
- 移动设备
- 网络设备
- 智慧互联家居设备
- Wi-Fi标准出炉状况的变化
- MIC 视角
Market Intelligence & Consulting Institute (MIC) has recently released our latest five-year forecast value pack, which delivers MIC's comprehensive research findings for the global notebook PC, desktop PC, server, motherboard, Wi-Fi connected device, and smartphone industries for the period 2024-2028.
Notebook PCs
Global PC shipments are expected to reach 246.1 million units in 2024 and 265.5 million units in 2025, up 8.3% year-on-year. The compound annual growth rate (CAGR) is estimated at 2.7% for the period 2024-2028. This research focuses on traditional PCs, comprising notebook PCs and desktop PCs but not tablets; notebook PCs surveyed include those with screen sizes of 7 inches and larger.
Note 1: GR = Year-on-Year Growth Rate
Note 2: DT product values include the number of AIO PCs
Source: MIC, August 2024
Companies surveyed include Taiwanese notebook PC makers operating ODM, OEM, EMS, CEM, OBM, and private label businesses; production sites and shipment destinations include Taiwan, China, Japan, South Korea, Southeast Asia, North America, Latin America, Western Europe and other European countries, and other regions.
Facing the ongoing global economic downturn, the global notebook PC market witnessed another subdued year in 2023. Nevertheless, following two consecutive years of declining demand, manufacturers in the notebook PC supply chain are optimistic about a rebound in 2024.
Desktop PC
The global desktop PC industry witnessed a significant downturn in 2023, with shipments totaling 67.927 million units, marking an 11.6% decrease from 2022. Despite resolving excess inventory in the desktop PC supply chain and achieving healthier inventory levels, the market remained impacted by sluggish global economic conditions and high inflation rates, leading to sustained weak consumer demand for PC products.
Wi-Fi Connected Device
The research focuses on a wide range of Wi-Fi connected devices, which are categorized into three application areas: information devices, mobile devices, and smart connected home devices. Devices included in this research are smartphones, feature phones, IoT (Wearable), IoT (Others), printers, notebook PCs, desktop PCs, tablets, broadband CPE, Wi-Fi routers, Wi-Fi extenders/repeaters, smart home automation controllers, smart appliances, smart speakers, smart TVs, IP cameras, game consoles, STBs, consumer electronics (Others), and in-vehicle infotainment (IVI). Among them, consumer electronics (Others) includes portable media players (PMPs), e-readers, digital cameras, digital photo frames, smart remote controls, etc. IoT (Wearable) includes smartwatches, fitness bands, XR devices, etc., and IoT (Others) includes robots, smart home peripherals, etc.
The overall market size is projected to continue increasing, with the global Wi-Fi connected device market estimated to exceed 4.4 billion units by 2028, representing a compound annual growth rate (CAGR) of 5.1% from 2023 to 2028, according to the Market Intelligence & Consulting Institute (MIC).
The shipment volume of global Wi-Fi connected devices in 2023 decreased to 3.22 billion units, down 3.1% year-on-year. As inventory clearance nears completion and the market generally holds a positive outlook for economic recovery, MIC estimates that Wi-Fi connected device shipments will rebound from their lows to reach 3.43 billion units in 2024, up 6.5% year-on-year.
Based on MIC's findings, the shipment shares of the top five Wi-Fi connected products in 2023, in descending order, were smartphones (35.7%), broadband CPE (6.5%), smart TVs (6.3%), notebook PCs (5.3%), and smart speakers (5.1%), totaling 58.9% of the market share.
Source: MIC, June 2024
Server Systems
The global server market is anticipated to undergo a revival in 2024, driven by the emergence of generative AI and the optimization of large language models (LLMs) for enterprise applications. This resurgence is primarily attributed to the increasing demand for AI servers, expected to propel the recovery of the global server market. This research focuses on server systems classified by three CPU architectures: x86, RISC (Reduced Instruction Set Computing), and others. Servers in this study are further segmented into tower, blade, and rack-mounted form factors, as well as by assembly level, including full system and barebones levels.
Motherboard
Due to several detrimental factors, the global motherboard market in 2023 was approximately 75.4 million units, with a year-on-year decline of 10.7%. Shipments are expected to grow by 3.9% year-on-year in 2024, reaching 78.4 million units. This growth is attributed to the increase in commercial and consumer spending, albeit modest, as inflationary pressures have improved compared to 2022 and 2023.
This research focuses on motherboards, divided by CPU connector type, including LGA1150, LGA1151, Socket AM3+, Socket AM4, and Socket TR4. The shipment types surveyed encompass barebones systems, complete systems, and standalone motherboards. For definitions of the aforementioned product classifications, please refer to the following sections.
Companies surveyed are major global motherboard manufacturers whose business models include OBM (Original Brand Manufacturer), ODM (Original Design Manufacturer), OEM (Original Equipment Manufacturer), EMS (Electronics Manufacturing Services), CEM (Contract Electronics Manufacturer), and Private Label. The production sites and shipment regions include Taiwan, China, Japan, South Korea, other Asian countries, North America, Latin America, Western Europe, other European countries, and other regions (rest of the world, RoW). Definitions of the aforementioned geographic coverage are provided in the following sections.
Smartphone
In 2023, smartphones—remaining the largest segment of Wi-Fi application categories—continued the sluggish market trend from 2022. The purchasing power for mid-to-high-end models was weaker than in previous years. Despite this, MIC estimates that global smartphone shipments will total around 1.319 billion units by 2028, with a compound annual growth rate (CAGR) of 2.26% from 2024 to 2028. Aside from major items like smartphones and notebook PCs, smart home appliances such as smart TVs and smart speakers are likely to experience growth reversals.
The research focuses on mobile phones and does not include low-frequency phones such as cordless phones and PHS (Personal Handy System) phones. Mobile phones can be divided by mobile communications standard and operating system into GSM, GPRS, EDGE, WCDMA, TD-SCDMA, cdmaOne, CDMA2000 1X, CDMA2000 1x EV-DO, and iDEN.
Table of Contents
- Desktop PC
- Worldwide PC (exclude Tablet) Shipment Volume, 2020 - 2028
- Worldwide Desktop PC Shipment Volume, 2020 - 2028
- Worldwide Desktop PC Shipment Volume, 1Q 2021 - 4Q 2023
- Worldwide Motherboard / Worldwide Desktop PC Shipment Volume Ratio, 2020 - 2028
- Worldwide Desktop PC Shipment Volume by Region, 2020 - 2024
- Worldwide Desktop PC Shipment Share by Region, 2020 - 2024
- Worldwide Desktop PC Shipment by Customer Type, 2020 - 2024
- Worldwide Desktop PC Shipment Share by Customer Type, 2020 - 2024
- Worldwide Desktop PC Shipment by CPU Connector Type, 1Q 2022 - 2Q 2024
- Worldwide Desktop PC Shipment Share by CPU Connector Type, 1Q 2022 - 2Q 2024
- Intelligence Insight
- Research Scope & Definitions
- Notebook PC
- Worldwide PC (exclude Tablet) Shipment Volume, 2020 - 2028
- Worldwide Notebook PC Shipment Volume, 2020 - 2028
- Worldwide Notebook PC Shipment Volume, 1Q 2022 - 4Q 2024
- Worldwide Notebook PC Shipment Volume by Region, 2020 - 2024
- Worldwide Notebook PC Shipment Share by Region, 2020 - 2024
- Worldwide Notebook PC Shipment Volume by by Panel Size, 1Q 2022 - 2Q 2024
- Worldwide Notebook PC Shipment Share by by Panel Size, 1Q 2022 - 2Q 2024
- Worldwide Notebook PC Shipment Volume by Computing Platform, 1Q 2022 - 2Q 2024
- Worldwide Notebook PC Shipment Share by Computing Platform, 1Q 2022 - 2Q 2024
- Intelligence Insight
- Research Scope & Definitions
- Server
- Worldwide Server Shipment Volume, 2020 - 2028
- Worldwide Server Shipment Volume, 1Q22 - 4Q24
- Worldwide Server Shipment Volume by Region, 2020 - 2024
- Worldwide Server Shipment Share by Region, 2020 - 2024
- Worldwide Server Shipment Volume by CPU Architecture, 2020 - 2024
- Worldwide Server Shipment Share by CPU Architecture, 2020 - 2024
- Intelligence Insight
- Research Scope & Definitions
- Motherboard
- Worldwide Motherboard Shipment Volume, 2020 - 2028
- Worldwide Motherboard Shipment Volume, 1Q22 - 4Q24
- Worldwide Motherboard / Worldwide Desktop PC Shipment Volume Ratio, 2020 - 2028
- Worldwide Motherboard Shipment Volume by Region, 2020 - 2024
- Worldwide Motherboard Shipment Share by Region, 2020 - 2024
- Intelligence Insight
- Research Scope & Definitions
- Smartphone
- Worldwide Mobile Phone Market by Device Type, 2022 - 2028
- Worldwide Mobile Phone Market Share by Device Type, 2022 - 2028
- Worldwide Smartphone Market by Region, 2022 - 2028
- Worldwide Smartphone Market Share by Region, 2022 - 2028
- Worldwide Smartphone Market by Price Point, 2022 - 2028
- Worldwide Smartphone Market Share by Price Point, 2022 - 2028
- Worldwide Smartphone Market by Operating System, 2022 - 2028
- Worldwide Smartphone Market Share by Operating System, 2022 - 2028
- Intelligence Insight
- Research Scope & Definitions
- Wi-Fi Connected Devices
- 1. Development of Worldwide Wi-Fi Devices
- 2. Analaysis of Wi-Fi Connected Devices
- 2.1 Shipment Volume Analysis
- 2.2 Shipment Share Analysis
- 2.3 Shipment Volume Forecast
- 2.3.1 Information Devices
- 2.3.2 Mobile Devices
- 2.3.4 Networking Devices
- 2.3.4 Smart Connected Home Devices
- 2.4 Shipment Share Forecast
- 2.4.1 Information Devices
- 2.4.2 Mobile Devices
- 2.4.3 Networking Devices
- 2.4.4 Smart Connected Home Devices
- 3. Changes in Wi-Fi Standard Adoption
- 4. MIC Perspective
 无线基础设施的全球市场(2025年第一季)
 全球WiFi模组市场:2025年
 2025年Wi-Fi模组全球市场报告2025年全球车内Wi-Fi模组市场报告
 无线基础设施市场-全球产业规模、份额、趋势、机会和预测(按连接类型、按基础设施、按平台、按地区和按竞争划分,2020-2030 年)营运商 Wi-Fi 设备市场 - 全球产业规模、份额、趋势、机会和预测(按产品类型、应用、最终用户、地区和竞争细分,2020-2030 年预测)
 全球 Wi-Fi 模组市场:市场规模、市场份额、趋势分析(按类型、应用和地区)、展望和未来预测(2024-2031 年)2025年无线基础设施全球市场报告
 汽车Wi-Fi模组市场规模、份额及成长分析(按类型、技术、销售管道、应用及地区)-2025-2032年产业预测
 营运商 Wi-Fi 设备市场机会、成长动力、产业趋势分析和 2025 - 2034 年预测