


 |
市场调查报告书
商品编码
1379766
异壬醇市场:按应用分类 - 2023-2030 年全球预测Isononyl Alcohol Market by Application (Automotive, Energy & Utilities, Personal Care & Cosmetics) - Global Forecast 2023-2030 |
||||||
※ 本网页内容可能与最新版本有所差异。详细情况请与我们联繫。
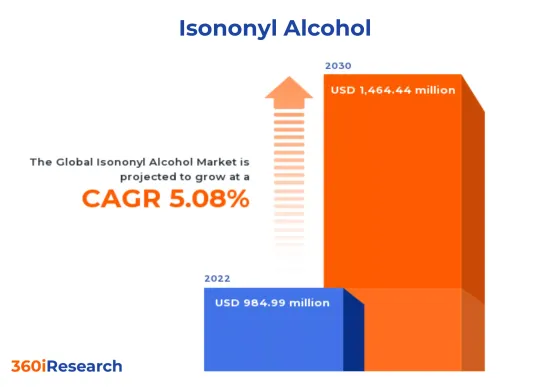
异壬醇市场预计将从2022年的9.8499亿美元增至2030年的14.6444亿美元,预测期内年复合成长率为5.08%。
异壬醇的全球市场
| 主要市场统计 | |
|---|---|
| 市场金额:基准年 [2022] | 98499万美元 |
| 预计市场金额[2023] | 1,032,470,000 美元 |
| 预计市场金额[2030] | 1,464.44 百万美元 |
| 年复合成长率(%) | 5.08% |
FPNV定位矩阵
FPNV定位矩阵是评估异壬醇市场的重要工具。透过分析与业务策略和产品满意度相关的关键指标来全面评估供应商。这使得使用者能够根据自己的具体资讯做出明智的决策。进阶分析将供应商分为四个像限,每个象限都有不同程度的成功:前沿 (F)、探路者 (P)、利基 (N) 和重要 (V)。洞察力使决策者能够充满信心地驾驭市场。
市场占有率分析
市场占有率分析为供应商的市场形势提供了宝贵的见解。评估对整体收益、客户群和其他关键指标的影响可以全面了解公司的业绩及其面临的竞争环境。该分析还揭示了研究期间的竞争水平,例如市场占有率增长、碎片化、主导地位和行业整合。
该报告对以下几个方面提供了宝贵的见解:
1.市场渗透:提供有关市场动态和主要企业产品的全面资讯。
2. 市场开拓:详细分析新兴和成熟细分市场的渗透情况,以突显利润丰厚的商机。
3. 市场多元化:有关新产品发布、开拓地区、最新发展和投资的详细资讯。
4.竞争评估与资讯:对主要企业的市场占有率、策略、产品、认证、法规状况、专利状况、製造能力等进行综合评估。
5. 产品开发与创新:对未来技术、研发活动和突破性产品开发的智慧洞察。
本报告解决了以下关键问题:
1.异壬醇市场规模及预测是多少?
2. 异壬醇市场中哪些产品、细分市场、应用和领域具有最高的投资潜力?
3.异壬醇市场的竞争策略架构是怎么样的?
4.异壬醇市场的最新技术趋势和法律规范是什么?
5.异壬醇市场主要供应商的市场占有率是多少?
6.进入异壬醇市场合适的型态和策略手段是什么?
目录
第1章前言
第2章调查方法
第3章执行摘要
第4章市场概况
第5章市场洞察
- 市场动态
- 促进因素
- 全球塑化剂产量增加
- 越来越多使用异壬醇作为肥皂和洗髮精中的香料
- 抑制因素
- 与异壬醇相关的各种健康危害
- 机会
- 提高异壬醇的永续生产
- 汽车产业的新应用
- 任务
- 关于异壬醇使用的严格政府法规
- 促进因素
- 市场区隔分析
- 市场趋势分析
- 高通膨的累积效应
- 波特五力分析
- 价值炼和关键路径分析
- 法律规范
第6章壬醇市场:依应用分类
- 介绍
- 汽车
- 能源和公共
- 个人护理和化妆品
- 塑胶
第7章美洲异壬醇市场
- 介绍
- 阿根廷
- 巴西
- 加拿大
- 墨西哥
- 美国
第8章亚太异壬醇市场
- 介绍
- 澳洲
- 中国
- 印度
- 印尼
- 日本
- 马来西亚
- 菲律宾
- 新加坡
- 韩国
- 台湾
- 泰国
- 越南
第9章欧洲、中东和非洲异壬醇市场
- 介绍
- 丹麦
- 埃及
- 芬兰
- 法国
- 德国
- 以色列
- 义大利
- 荷兰
- 奈及利亚
- 挪威
- 波兰
- 卡达
- 俄罗斯
- 沙乌地阿拉伯
- 南非
- 西班牙
- 瑞典
- 瑞士
- 土耳其
- 阿拉伯聯合大公国
- 英国
第10章竞争形势
- FPNV定位矩阵
- 市场占有率分析:主要企业
- 主要企业竞争情境分析
第11章竞争产品组合
- 主要公司简介
- BASF SE
- DuPont de Nemours, Inc.
- Evonik Industries AG
- Exxon Mobil Corporation
- Johnson Matthey
- KH Neochem Co., Ltd.
- Merck KGaA
- OQ Chemicals GmbH
- Tokyo Chemical Industry Co. Ltd
- Vizag chemical
- 主要产品系列
第12章附录
- 讨论指南
- 关于许可证和定价
The Isononyl Alcohol Market is projected to reach USD 1,464.44 million by 2030 from USD 984.99 million in 2022, at a CAGR of 5.08% during the forecast period.
Global Isononyl Alcohol Market
| KEY MARKET STATISTICS | |
|---|---|
| Base Year Value [2022] | USD 984.99 million |
| Estimated Year Value [2023] | USD 1,032.47 million |
| Forecast Year Value [2030] | USD 1,464.44 million |
| CAGR (%) | 5.08% |
Market Segmentation & Coverage:
This research report analyzes various sub-markets, forecasts revenues, and examines emerging trends in each category to provide a comprehensive outlook on the Isononyl Alcohol Market.
Based on Application, market is studied across Automotive, Energy & Utilities, Personal Care & Cosmetics, and Plastics. The Plastics is projected to witness significant market share during forecast period.
Based on Region, market is studied across Americas, Asia-Pacific, and Europe, Middle East & Africa. The Americas is further studied across Argentina, Brazil, Canada, Mexico, and United States. The United States is further studied across California, Florida, Illinois, New York, Ohio, Pennsylvania, and Texas. The Asia-Pacific is further studied across Australia, China, India, Indonesia, Japan, Malaysia, Philippines, Singapore, South Korea, Taiwan, Thailand, and Vietnam. The Europe, Middle East & Africa is further studied across Denmark, Egypt, Finland, France, Germany, Israel, Italy, Netherlands, Nigeria, Norway, Poland, Qatar, Russia, Saudi Arabia, South Africa, Spain, Sweden, Switzerland, Turkey, United Arab Emirates, and United Kingdom. The Americas is projected to witness significant market share during forecast period.
Market Statistics:
The report provides market sizing and forecasts across 7 major currencies - USD, EUR, JPY, GBP, AUD, CAD, and CHF; multiple currency support helps organization leaders to make well-informed decisions. In this report, 2018 to 2021 are considered as historical years, 2022 is base year, 2023 is estimated year, and years from 2024 to 2030 are considered as forecast period.
FPNV Positioning Matrix:
The FPNV Positioning Matrix is an indispensable tool for assessing the Isononyl Alcohol Market. It comprehensively evaluates vendors, analyzing key metrics related to Business Strategy and Product Satisfaction. This enables users to make informed decisions tailored to their specific needs. Through advanced analysis, vendors are categorized into four distinct quadrants, each representing a different level of success: Forefront (F), Pathfinder (P), Niche (N), or Vital (V). Be assured that this insightful framework empowers decision-makers to navigate the market with confidence.
Market Share Analysis:
The Market Share Analysis offers invaluable insights into the vendor landscape Isononyl Alcohol Market. By evaluating their impact on overall revenue, customer base, and other key metrics, we provide companies with a comprehensive understanding of their performance and the competitive environment they confront. This analysis also uncovers the level of competition in terms of market share acquisition, fragmentation, dominance, and industry consolidation during the study period.
Key Company Profiles:
The report delves into recent significant developments in the Isononyl Alcohol Market, highlighting leading vendors and their innovative profiles. These include BASF SE, DuPont de Nemours, Inc., Evonik Industries AG, Exxon Mobil Corporation, Johnson Matthey, KH Neochem Co., Ltd., Merck KGaA, OQ Chemicals GmbH, Tokyo Chemical Industry Co. Ltd, and Vizag chemical.
The report offers valuable insights on the following aspects:
1. Market Penetration: It provides comprehensive information about key players' market dynamics and offerings.
2. Market Development: In-depth analysis of emerging markets and penetration across mature market segments, highlighting lucrative opportunities.
3. Market Diversification: Detailed information about new product launches, untapped geographies, recent developments, and investments.
4. Competitive Assessment & Intelligence: Exhaustive assessment of market shares, strategies, products, certifications, regulatory approvals, patent landscape, and manufacturing capabilities of leading players.
5. Product Development & Innovation: Intelligent insights on future technologies, R&D activities, and breakthrough product developments.
The report addresses key questions such as:
1. What is the market size and forecast for the Isononyl Alcohol Market?
2. Which products, segments, applications, and areas hold the highest investment potential in the Isononyl Alcohol Market?
3. What is the competitive strategic window for identifying opportunities in the Isononyl Alcohol Market?
4. What are the latest technology trends and regulatory frameworks in the Isononyl Alcohol Market?
5. What is the market share of the leading vendors in the Isononyl Alcohol Market?
6. Which modes and strategic moves are suitable for entering the Isononyl Alcohol Market?
Table of Contents
1. Preface
- 1.1. Objectives of the Study
- 1.2. Market Segmentation & Coverage
- 1.3. Years Considered for the Study
- 1.4. Currency & Pricing
- 1.5. Language
- 1.6. Limitations
- 1.7. Assumptions
- 1.8. Stakeholders
2. Research Methodology
- 2.1. Define: Research Objective
- 2.2. Determine: Research Design
- 2.3. Prepare: Research Instrument
- 2.4. Collect: Data Source
- 2.5. Analyze: Data Interpretation
- 2.6. Formulate: Data Verification
- 2.7. Publish: Research Report
- 2.8. Repeat: Report Update
3. Executive Summary
4. Market Overview
- 4.1. Introduction
- 4.2. Isononyl Alcohol Market, by Region
5. Market Insights
- 5.1. Market Dynamics
- 5.1.1. Drivers
- 5.1.1.1. Rising production of plasticizers across the the globe
- 5.1.1.2. Increasing utilization of isononyl alcohol as fragrance in soaps & shampoo
- 5.1.2. Restraints
- 5.1.2.1. Various health hazards associated with isononyl alcohol
- 5.1.3. Opportunities
- 5.1.3.1. Increasing productions of sustainable isononyl alcohol
- 5.1.3.2. Emerging applications in automotive industry
- 5.1.4. Challenges
- 5.1.4.1. Stringent government regulations associated with the usage of isononyl alcohol
- 5.1.1. Drivers
- 5.2. Market Segmentation Analysis
- 5.3. Market Trend Analysis
- 5.4. Cumulative Impact of High Inflation
- 5.5. Porter's Five Forces Analysis
- 5.5.1. Threat of New Entrants
- 5.5.2. Threat of Substitutes
- 5.5.3. Bargaining Power of Customers
- 5.5.4. Bargaining Power of Suppliers
- 5.5.5. Industry Rivalry
- 5.6. Value Chain & Critical Path Analysis
- 5.7. Regulatory Framework
6. Isononyl Alcohol Market, by Application
- 6.1. Introduction
- 6.2. Automotive
- 6.3. Energy & Utilities
- 6.4. Personal Care & Cosmetics
- 6.5. Plastics
7. Americas Isononyl Alcohol Market
- 7.1. Introduction
- 7.2. Argentina
- 7.3. Brazil
- 7.4. Canada
- 7.5. Mexico
- 7.6. United States
8. Asia-Pacific Isononyl Alcohol Market
- 8.1. Introduction
- 8.2. Australia
- 8.3. China
- 8.4. India
- 8.5. Indonesia
- 8.6. Japan
- 8.7. Malaysia
- 8.8. Philippines
- 8.9. Singapore
- 8.10. South Korea
- 8.11. Taiwan
- 8.12. Thailand
- 8.13. Vietnam
9. Europe, Middle East & Africa Isononyl Alcohol Market
- 9.1. Introduction
- 9.2. Denmark
- 9.3. Egypt
- 9.4. Finland
- 9.5. France
- 9.6. Germany
- 9.7. Israel
- 9.8. Italy
- 9.9. Netherlands
- 9.10. Nigeria
- 9.11. Norway
- 9.12. Poland
- 9.13. Qatar
- 9.14. Russia
- 9.15. Saudi Arabia
- 9.16. South Africa
- 9.17. Spain
- 9.18. Sweden
- 9.19. Switzerland
- 9.20. Turkey
- 9.21. United Arab Emirates
- 9.22. United Kingdom
10. Competitive Landscape
- 10.1. FPNV Positioning Matrix
- 10.2. Market Share Analysis, By Key Player
- 10.3. Competitive Scenario Analysis, By Key Player
11. Competitive Portfolio
- 11.1. Key Company Profiles
- 11.1.1. BASF SE
- 11.1.2. DuPont de Nemours, Inc.
- 11.1.3. Evonik Industries AG
- 11.1.4. Exxon Mobil Corporation
- 11.1.5. Johnson Matthey
- 11.1.6. KH Neochem Co., Ltd.
- 11.1.7. Merck KGaA
- 11.1.8. OQ Chemicals GmbH
- 11.1.9. Tokyo Chemical Industry Co. Ltd
- 11.1.10. Vizag chemical
- 11.2. Key Product Portfolio
12. Appendix
- 12.1. Discussion Guide
- 12.2. License & Pricing
LIST OF FIGURES
- FIGURE 1. ISONONYL ALCOHOL MARKET RESEARCH PROCESS
- FIGURE 2. ISONONYL ALCOHOL MARKET SIZE, 2022 VS 2030
- FIGURE 3. ISONONYL ALCOHOL MARKET SIZE, 2018-2030 (USD MILLION)
- FIGURE 4. ISONONYL ALCOHOL MARKET SIZE, BY REGION, 2022 VS 2030 (%)
- FIGURE 5. ISONONYL ALCOHOL MARKET SIZE, BY REGION, 2022 VS 2023 VS 2030 (USD MILLION)
- FIGURE 6. ISONONYL ALCOHOL MARKET DYNAMICS
- FIGURE 7. ISONONYL ALCOHOL MARKET SIZE, BY APPLICATION, 2022 VS 2030 (%)
- FIGURE 8. ISONONYL ALCOHOL MARKET SIZE, BY APPLICATION, 2022 VS 2023 VS 2030 (USD MILLION)
- FIGURE 9. AMERICAS ISONONYL ALCOHOL MARKET SIZE, BY COUNTRY, 2022 VS 2030 (%)
- FIGURE 10. AMERICAS ISONONYL ALCOHOL MARKET SIZE, BY COUNTRY, 2022 VS 2023 VS 2030 (USD MILLION)
- FIGURE 11. UNITED STATES ISONONYL ALCOHOL MARKET SIZE, BY STATE, 2022 VS 2030 (%)
- FIGURE 12. UNITED STATES ISONONYL ALCOHOL MARKET SIZE, BY STATE, 2022 VS 2023 VS 2030 (USD MILLION)
- FIGURE 13. ASIA-PACIFIC ISONONYL ALCOHOL MARKET SIZE, BY COUNTRY, 2022 VS 2030 (%)
- FIGURE 14. ASIA-PACIFIC ISONONYL ALCOHOL MARKET SIZE, BY COUNTRY, 2022 VS 2023 VS 2030 (USD MILLION)
- FIGURE 15. EUROPE, MIDDLE EAST & AFRICA ISONONYL ALCOHOL MARKET SIZE, BY COUNTRY, 2022 VS 2030 (%)
- FIGURE 16. EUROPE, MIDDLE EAST & AFRICA ISONONYL ALCOHOL MARKET SIZE, BY COUNTRY, 2022 VS 2023 VS 2030 (USD MILLION)
- FIGURE 17. ISONONYL ALCOHOL MARKET, FPNV POSITIONING MATRIX, 2022
- FIGURE 18. ISONONYL ALCOHOL MARKET SHARE, BY KEY PLAYER, 2022
LIST OF TABLES
- TABLE 1. ISONONYL ALCOHOL MARKET SEGMENTATION & COVERAGE
- TABLE 2. UNITED STATES DOLLAR EXCHANGE RATE, 2018-2022
- TABLE 3. ISONONYL ALCOHOL MARKET SIZE, 2018-2030 (USD MILLION)
- TABLE 4. GLOBAL ISONONYL ALCOHOL MARKET SIZE, BY REGION, 2018-2030 (USD MILLION)
- TABLE 5. ISONONYL ALCOHOL MARKET SIZE, BY APPLICATION, 2018-2030 (USD MILLION)
- TABLE 6. ISONONYL ALCOHOL MARKET SIZE, BY AUTOMOTIVE, BY REGION, 2018-2030 (USD MILLION)
- TABLE 7. ISONONYL ALCOHOL MARKET SIZE, BY ENERGY & UTILITIES, BY REGION, 2018-2030 (USD MILLION)
- TABLE 8. ISONONYL ALCOHOL MARKET SIZE, BY PERSONAL CARE & COSMETICS, BY REGION, 2018-2030 (USD MILLION)
- TABLE 9. ISONONYL ALCOHOL MARKET SIZE, BY PLASTICS, BY REGION, 2018-2030 (USD MILLION)
- TABLE 10. AMERICAS ISONONYL ALCOHOL MARKET SIZE, BY APPLICATION, 2018-2030 (USD MILLION)
- TABLE 11. AMERICAS ISONONYL ALCOHOL MARKET SIZE, BY COUNTRY, 2018-2030 (USD MILLION)
- TABLE 12. ARGENTINA ISONONYL ALCOHOL MARKET SIZE, BY APPLICATION, 2018-2030 (USD MILLION)
- TABLE 13. BRAZIL ISONONYL ALCOHOL MARKET SIZE, BY APPLICATION, 2018-2030 (USD MILLION)
- TABLE 14. CANADA ISONONYL ALCOHOL MARKET SIZE, BY APPLICATION, 2018-2030 (USD MILLION)
- TABLE 15. MEXICO ISONONYL ALCOHOL MARKET SIZE, BY APPLICATION, 2018-2030 (USD MILLION)
- TABLE 16. UNITED STATES ISONONYL ALCOHOL MARKET SIZE, BY APPLICATION, 2018-2030 (USD MILLION)
- TABLE 17. UNITED STATES ISONONYL ALCOHOL MARKET SIZE, BY STATE, 2018-2030 (USD MILLION)
- TABLE 18. ASIA-PACIFIC ISONONYL ALCOHOL MARKET SIZE, BY APPLICATION, 2018-2030 (USD MILLION)
- TABLE 19. ASIA-PACIFIC ISONONYL ALCOHOL MARKET SIZE, BY COUNTRY, 2018-2030 (USD MILLION)
- TABLE 20. AUSTRALIA ISONONYL ALCOHOL MARKET SIZE, BY APPLICATION, 2018-2030 (USD MILLION)
- TABLE 21. CHINA ISONONYL ALCOHOL MARKET SIZE, BY APPLICATION, 2018-2030 (USD MILLION)
- TABLE 22. INDIA ISONONYL ALCOHOL MARKET SIZE, BY APPLICATION, 2018-2030 (USD MILLION)
- TABLE 23. INDONESIA ISONONYL ALCOHOL MARKET SIZE, BY APPLICATION, 2018-2030 (USD MILLION)
- TABLE 24. JAPAN ISONONYL ALCOHOL MARKET SIZE, BY APPLICATION, 2018-2030 (USD MILLION)
- TABLE 25. MALAYSIA ISONONYL ALCOHOL MARKET SIZE, BY APPLICATION, 2018-2030 (USD MILLION)
- TABLE 26. PHILIPPINES ISONONYL ALCOHOL MARKET SIZE, BY APPLICATION, 2018-2030 (USD MILLION)
- TABLE 27. SINGAPORE ISONONYL ALCOHOL MARKET SIZE, BY APPLICATION, 2018-2030 (USD MILLION)
- TABLE 28. SOUTH KOREA ISONONYL ALCOHOL MARKET SIZE, BY APPLICATION, 2018-2030 (USD MILLION)
- TABLE 29. TAIWAN ISONONYL ALCOHOL MARKET SIZE, BY APPLICATION, 2018-2030 (USD MILLION)
- TABLE 30. THAILAND ISONONYL ALCOHOL MARKET SIZE, BY APPLICATION, 2018-2030 (USD MILLION)
- TABLE 31. VIETNAM ISONONYL ALCOHOL MARKET SIZE, BY APPLICATION, 2018-2030 (USD MILLION)
- TABLE 32. EUROPE, MIDDLE EAST & AFRICA ISONONYL ALCOHOL MARKET SIZE, BY APPLICATION, 2018-2030 (USD MILLION)
- TABLE 33. EUROPE, MIDDLE EAST & AFRICA ISONONYL ALCOHOL MARKET SIZE, BY COUNTRY, 2018-2030 (USD MILLION)
- TABLE 34. DENMARK ISONONYL ALCOHOL MARKET SIZE, BY APPLICATION, 2018-2030 (USD MILLION)
- TABLE 35. EGYPT ISONONYL ALCOHOL MARKET SIZE, BY APPLICATION, 2018-2030 (USD MILLION)
- TABLE 36. FINLAND ISONONYL ALCOHOL MARKET SIZE, BY APPLICATION, 2018-2030 (USD MILLION)
- TABLE 37. FRANCE ISONONYL ALCOHOL MARKET SIZE, BY APPLICATION, 2018-2030 (USD MILLION)
- TABLE 38. GERMANY ISONONYL ALCOHOL MARKET SIZE, BY APPLICATION, 2018-2030 (USD MILLION)
- TABLE 39. ISRAEL ISONONYL ALCOHOL MARKET SIZE, BY APPLICATION, 2018-2030 (USD MILLION)
- TABLE 40. ITALY ISONONYL ALCOHOL MARKET SIZE, BY APPLICATION, 2018-2030 (USD MILLION)
- TABLE 41. NETHERLANDS ISONONYL ALCOHOL MARKET SIZE, BY APPLICATION, 2018-2030 (USD MILLION)
- TABLE 42. NIGERIA ISONONYL ALCOHOL MARKET SIZE, BY APPLICATION, 2018-2030 (USD MILLION)
- TABLE 43. NORWAY ISONONYL ALCOHOL MARKET SIZE, BY APPLICATION, 2018-2030 (USD MILLION)
- TABLE 44. POLAND ISONONYL ALCOHOL MARKET SIZE, BY APPLICATION, 2018-2030 (USD MILLION)
- TABLE 45. QATAR ISONONYL ALCOHOL MARKET SIZE, BY APPLICATION, 2018-2030 (USD MILLION)
- TABLE 46. RUSSIA ISONONYL ALCOHOL MARKET SIZE, BY APPLICATION, 2018-2030 (USD MILLION)
- TABLE 47. SAUDI ARABIA ISONONYL ALCOHOL MARKET SIZE, BY APPLICATION, 2018-2030 (USD MILLION)
- TABLE 48. SOUTH AFRICA ISONONYL ALCOHOL MARKET SIZE, BY APPLICATION, 2018-2030 (USD MILLION)
- TABLE 49. SPAIN ISONONYL ALCOHOL MARKET SIZE, BY APPLICATION, 2018-2030 (USD MILLION)
- TABLE 50. SWEDEN ISONONYL ALCOHOL MARKET SIZE, BY APPLICATION, 2018-2030 (USD MILLION)
- TABLE 51. SWITZERLAND ISONONYL ALCOHOL MARKET SIZE, BY APPLICATION, 2018-2030 (USD MILLION)
- TABLE 52. TURKEY ISONONYL ALCOHOL MARKET SIZE, BY APPLICATION, 2018-2030 (USD MILLION)
- TABLE 53. UNITED ARAB EMIRATES ISONONYL ALCOHOL MARKET SIZE, BY APPLICATION, 2018-2030 (USD MILLION)
- TABLE 54. UNITED KINGDOM ISONONYL ALCOHOL MARKET SIZE, BY APPLICATION, 2018-2030 (USD MILLION)
- TABLE 55. ISONONYL ALCOHOL MARKET, FPNV POSITIONING MATRIX, 2022
- TABLE 56. ISONONYL ALCOHOL MARKET SHARE, BY KEY PLAYER, 2022
- TABLE 57. ISONONYL ALCOHOL MARKET LICENSE & PRICING
 癸醇 (CAS 112-30-1) 市场 - 2018-2028 年全球产业规模、份额、趋势、机会与预测,依原料(天然、合成)、按应用(界面活性剂、增塑剂、清洁剂等)细分,按地区和比赛
 硬脂醇市场 - 按等级(常规等级、高纯度等级)、按形式(液体、蜡状固体)、按应用(乳液稳定剂、香料成分、泡沫促进剂、粘度调节剂、润肤剂)、按最终用户产业与预测, 2023 - 2032
 异壬醇的全球市场
 异硬脂醇市场:各用途,各最终用途产业,各地区 - 规模,占有率,展望,机会分析,2023年~2030年
 2022-2030 年山嵛醇市场:按应用、最终用户、地区规模、份额、前景、机会分析
 鲸蜡醇全球市场规模:按形式(液体鲸蜡醇,蜡状固体鲸蜡醇),用户(食品和饮料,化妆品和个人护理,药品,其他),地区预测2022-2028
 鲸蜡硬脂醇的全球市场规模:测试类型、用途、区域预测(2022-2028 年)