


 |
市场调查报告书
商品编码
1413088
奈米生物技术市场:按产品、按应用分类 - 2024-2030 年全球预测Nanobiotechnology Market by Product (Nano-Enabled Drugs, Nanodevices, Nanoparticles), Application (Agriculture, Cancer Treatment, Diagnostics) - Global Forecast 2024-2030 |
||||||
※ 本网页内容可能与最新版本有所差异。详细情况请与我们联繫。
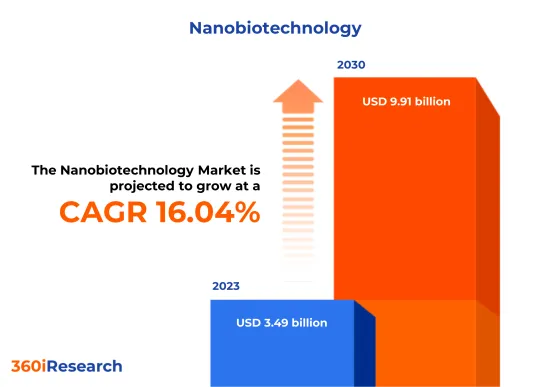
预计2023年奈米生物技术市场规模为34.9亿美元,预计2024年将达41.1亿美元,2030年将达到99.1亿美元,复合年增长率为16.04%。
奈米生物技术的全球市场
| 主要市场统计 | |
|---|---|
| 基准年[2023] | 34.9亿美元 |
| 预测年份 [2024] | 41.1亿美元 |
| 预测年份 [2030] | 99.1亿美元 |
| 复合年增长率(%) | 16.04% |
FPNV定位矩阵
FPNV定位矩阵对于评估奈米生物技术市场至关重要。我们检视与业务策略和产品满意度相关的关键指标,以对供应商进行全面评估。这种深入的分析使用户能够根据自己的要求做出资讯的决策。根据评估,供应商被分为四个成功程度不同的像限:前沿(F)、探路者(P)、利基(N)和重要(V)。
市场占有率分析
市场占有率分析是一种综合工具,可以对奈米生物技术市场供应商的现状进行深入而详细的研究。全面比较和分析供应商在整体收益、基本客群和其他关键指标方面的贡献,以便更好地了解公司的绩效及其在争夺市场占有率时面临的挑战。此外,该分析还提供了对该行业竞争特征的宝贵考察,包括在研究基准年观察到的累积、分散主导地位和合併特征等因素。这种详细程度的提高使供应商能够做出更资讯的决策并制定有效的策略,从而在市场上获得竞争优势。
该报告对以下几个方面提供了宝贵的见解:
1-市场渗透率:提供有关主要企业所服务的市场的全面资讯。
2-市场开拓:我们深入研究利润丰厚的新兴市场,并分析它们在成熟细分市场中的渗透率。
3- 市场多元化:提供有关新产品发布、开拓地区、最新发展和投资的详细资讯。
4-竞争力评估与资讯:对主要企业的市场占有率、策略、产品、认证、监管状况、专利状况、製造能力等进行全面评估。
5- 产品开发与创新:提供对未来技术、研发活动和突破性产品开发的见解。
本报告解决了以下关键问题:
1-奈米生物技术市场的市场规模与预测是多少?
2-奈米生物技术市场预测期内需要考虑投资的产品、细分市场、应用和领域有哪些?
3-奈米生物技术市场的技术趋势和法律规范是什么?
4-奈米生物技术市场主要供应商的市场占有率是多少?
5-进入奈米生物技术市场的合适型态和策略手段是什么?
目录
第一章 前言
第二章调查方法
第三章执行摘要
第四章市场概况
第五章市场洞察
- 市场动态
- 促进因素
- 增加奈米生物技术的使用以改善医疗保健实践
- 改善药物研发与开发流程
- 利用奈米技术开发永续生物材料
- 抑制因素
- 与奈米生物技术相关的伦理和环境问题
- 机会
- 基因组学和蛋白质组学研究的增加
- 奈米生物技术在农业中的新用途
- 任务
- 奈米科技产品管理法规
- 促进因素
- 市场区隔分析
- 市场趋势分析
- 高通膨的累积效应
- 波特五力分析
- 价值炼和关键路径分析
- 法律规范
第六章奈米生物技术市场:副产品
- 可奈米化的药物
- 奈米装置
- 奈米粒子
- 奈米科技工具
第七章奈米生物技术市场:依应用分类
- 农业
- 癌症治疗
- 诊断
- 药物输送
- 环境监测
- 再生医学
- 疗法
第八章美洲奈米生物技术市场
- 阿根廷
- 巴西
- 加拿大
- 墨西哥
- 美国
第九章亚太地区奈米生物技术市场
- 澳洲
- 中国
- 印度
- 印尼
- 日本
- 马来西亚
- 菲律宾
- 新加坡
- 韩国
- 台湾
- 泰国
- 越南
第十章欧洲、中东和非洲奈米生物技术市场
- 丹麦
- 埃及
- 芬兰
- 法国
- 德国
- 以色列
- 义大利
- 荷兰
- 奈及利亚
- 挪威
- 波兰
- 卡达
- 俄罗斯
- 沙乌地阿拉伯
- 南非
- 西班牙
- 瑞典
- 瑞士
- 土耳其
- 阿拉伯聯合大公国
- 英国
第十一章竞争形势
- FPNV定位矩阵
- 市场占有率分析:按主要企业划分
- 主要企业竞争情境分析
第12章竞争产品组合
- 主要公司简介
- 3M Company
- Agilent Technologies, Inc.
- Analog Devices, Inc.
- ANSELL LTD.
- Arkema SA
- Bruker Corporation
- DuPont de Nemours, Inc.
- Eurofins Scientific SE
- Evonik Industries AG
- Honeywell International Inc.
- Merck KGaA
- Nanoscience Instruments, Inc.
- Nanospan Inc.
- Sioen Industries NV
- Texas Instruments Incorporated
- Thermo Fisher Scientific Inc.
- 主要产品系列
第十三章附录
- 讨论指南
- 关于许可证和定价
[183 Pages Report] The Nanobiotechnology Market size was estimated at USD 3.49 billion in 2023 and expected to reach USD 4.11 billion in 2024, at a CAGR 16.04% to reach USD 9.91 billion by 2030.
Global Nanobiotechnology Market
| KEY MARKET STATISTICS | |
|---|---|
| Base Year [2023] | USD 3.49 billion |
| Estimated Year [2024] | USD 4.11 billion |
| Forecast Year [2030] | USD 9.91 billion |
| CAGR (%) | 16.04% |
FPNV Positioning Matrix
The FPNV Positioning Matrix is pivotal in evaluating the Nanobiotechnology Market. It offers a comprehensive assessment of vendors, examining key metrics related to Business Strategy and Product Satisfaction. This in-depth analysis empowers users to make well-informed decisions aligned with their requirements. Based on the evaluation, the vendors are then categorized into four distinct quadrants representing varying levels of success: Forefront (F), Pathfinder (P), Niche (N), or Vital (V).
Market Share Analysis
The Market Share Analysis is a comprehensive tool that provides an insightful and in-depth examination of the current state of vendors in the Nanobiotechnology Market. By meticulously comparing and analyzing vendor contributions in terms of overall revenue, customer base, and other key metrics, we can offer companies a greater understanding of their performance and the challenges they face when competing for market share. Additionally, this analysis provides valuable insights into the competitive nature of the sector, including factors such as accumulation, fragmentation dominance, and amalgamation traits observed over the base year period studied. With this expanded level of detail, vendors can make more informed decisions and devise effective strategies to gain a competitive edge in the market.
Key Company Profiles
The report delves into recent significant developments in the Nanobiotechnology Market, highlighting leading vendors and their innovative profiles. These include 3M Company, Agilent Technologies, Inc., Analog Devices, Inc., ANSELL LTD., Arkema S.A., Bruker Corporation, DuPont de Nemours, Inc., Eurofins Scientific SE, Evonik Industries AG, Honeywell International Inc., Merck KGaA, Nanoscience Instruments, Inc., Nanospan Inc., Sioen Industries NV, Texas Instruments Incorporated, and Thermo Fisher Scientific Inc..
Market Segmentation & Coverage
This research report categorizes the Nanobiotechnology Market to forecast the revenues and analyze trends in each of the following sub-markets:
- Product
- Nano-Enabled Drugs
- Nanodevices
- Nanoparticles
- Nanotechnology Tools
- Application
- Agriculture
- Cancer Treatment
- Diagnostics
- Drug Delivery
- Environmental Monitoring
- Regenerative Medicines
- Therapeutics
- Region
- Americas
- Argentina
- Brazil
- Canada
- Mexico
- United States
- California
- Florida
- Illinois
- New York
- Ohio
- Pennsylvania
- Texas
- Asia-Pacific
- Australia
- China
- India
- Indonesia
- Japan
- Malaysia
- Philippines
- Singapore
- South Korea
- Taiwan
- Thailand
- Vietnam
- Europe, Middle East & Africa
- Denmark
- Egypt
- Finland
- France
- Germany
- Israel
- Italy
- Netherlands
- Nigeria
- Norway
- Poland
- Qatar
- Russia
- Saudi Arabia
- South Africa
- Spain
- Sweden
- Switzerland
- Turkey
- United Arab Emirates
- United Kingdom
- Americas
The report offers valuable insights on the following aspects:
1. Market Penetration: It presents comprehensive information on the market provided by key players.
2. Market Development: It delves deep into lucrative emerging markets and analyzes the penetration across mature market segments.
3. Market Diversification: It provides detailed information on new product launches, untapped geographic regions, recent developments, and investments.
4. Competitive Assessment & Intelligence: It conducts an exhaustive assessment of market shares, strategies, products, certifications, regulatory approvals, patent landscape, and manufacturing capabilities of the leading players.
5. Product Development & Innovation: It offers intelligent insights on future technologies, R&D activities, and breakthrough product developments.
The report addresses key questions such as:
1. What is the market size and forecast of the Nanobiotechnology Market?
2. Which products, segments, applications, and areas should one consider investing in over the forecast period in the Nanobiotechnology Market?
3. What are the technology trends and regulatory frameworks in the Nanobiotechnology Market?
4. What is the market share of the leading vendors in the Nanobiotechnology Market?
5. Which modes and strategic moves are suitable for entering the Nanobiotechnology Market?
Table of Contents
1. Preface
- 1.1. Objectives of the Study
- 1.2. Market Segmentation & Coverage
- 1.3. Years Considered for the Study
- 1.4. Currency & Pricing
- 1.5. Language
- 1.6. Limitations
- 1.7. Assumptions
- 1.8. Stakeholders
2. Research Methodology
- 2.1. Define: Research Objective
- 2.2. Determine: Research Design
- 2.3. Prepare: Research Instrument
- 2.4. Collect: Data Source
- 2.5. Analyze: Data Interpretation
- 2.6. Formulate: Data Verification
- 2.7. Publish: Research Report
- 2.8. Repeat: Report Update
3. Executive Summary
4. Market Overview
- 4.1. Introduction
- 4.2. Nanobiotechnology Market, by Region
5. Market Insights
- 5.1. Market Dynamics
- 5.1.1. Drivers
- 5.1.1.1. Increasing the use of nanobiotechnology for improving healthcare practices
- 5.1.1.2. Rising drug discovery and development processes
- 5.1.1.3. Utilization of nanotechnology for development of sustainable biomaterials
- 5.1.2. Restraints
- 5.1.2.1. Ethical and environmental issues associated with nanobiotechnology
- 5.1.3. Opportunities
- 5.1.3.1. Increasing research in genomics and proteomics
- 5.1.3.2. Emerging use of nanobiotechnology in agriculture
- 5.1.4. Challenges
- 5.1.4.1. Regulations governing nanotechnology products
- 5.1.1. Drivers
- 5.2. Market Segmentation Analysis
- 5.3. Market Trend Analysis
- 5.4. Cumulative Impact of High Inflation
- 5.5. Porter's Five Forces Analysis
- 5.5.1. Threat of New Entrants
- 5.5.2. Threat of Substitutes
- 5.5.3. Bargaining Power of Customers
- 5.5.4. Bargaining Power of Suppliers
- 5.5.5. Industry Rivalry
- 5.6. Value Chain & Critical Path Analysis
- 5.7. Regulatory Framework
6. Nanobiotechnology Market, by Product
- 6.1. Introduction
- 6.2. Nano-Enabled Drugs
- 6.3. Nanodevices
- 6.4. Nanoparticles
- 6.5. Nanotechnology Tools
7. Nanobiotechnology Market, by Application
- 7.1. Introduction
- 7.2. Agriculture
- 7.3. Cancer Treatment
- 7.4. Diagnostics
- 7.5. Drug Delivery
- 7.6. Environmental Monitoring
- 7.7. Regenerative Medicines
- 7.8. Therapeutics
8. Americas Nanobiotechnology Market
- 8.1. Introduction
- 8.2. Argentina
- 8.3. Brazil
- 8.4. Canada
- 8.5. Mexico
- 8.6. United States
9. Asia-Pacific Nanobiotechnology Market
- 9.1. Introduction
- 9.2. Australia
- 9.3. China
- 9.4. India
- 9.5. Indonesia
- 9.6. Japan
- 9.7. Malaysia
- 9.8. Philippines
- 9.9. Singapore
- 9.10. South Korea
- 9.11. Taiwan
- 9.12. Thailand
- 9.13. Vietnam
10. Europe, Middle East & Africa Nanobiotechnology Market
- 10.1. Introduction
- 10.2. Denmark
- 10.3. Egypt
- 10.4. Finland
- 10.5. France
- 10.6. Germany
- 10.7. Israel
- 10.8. Italy
- 10.9. Netherlands
- 10.10. Nigeria
- 10.11. Norway
- 10.12. Poland
- 10.13. Qatar
- 10.14. Russia
- 10.15. Saudi Arabia
- 10.16. South Africa
- 10.17. Spain
- 10.18. Sweden
- 10.19. Switzerland
- 10.20. Turkey
- 10.21. United Arab Emirates
- 10.22. United Kingdom
11. Competitive Landscape
- 11.1. FPNV Positioning Matrix
- 11.2. Market Share Analysis, By Key Player
- 11.3. Competitive Scenario Analysis, By Key Player
12. Competitive Portfolio
- 12.1. Key Company Profiles
- 12.1.1. 3M Company
- 12.1.2. Agilent Technologies, Inc.
- 12.1.3. Analog Devices, Inc.
- 12.1.4. ANSELL LTD.
- 12.1.5. Arkema S.A.
- 12.1.6. Bruker Corporation
- 12.1.7. DuPont de Nemours, Inc.
- 12.1.8. Eurofins Scientific SE
- 12.1.9. Evonik Industries AG
- 12.1.10. Honeywell International Inc.
- 12.1.11. Merck KGaA
- 12.1.12. Nanoscience Instruments, Inc.
- 12.1.13. Nanospan Inc.
- 12.1.14. Sioen Industries NV
- 12.1.15. Texas Instruments Incorporated
- 12.1.16. Thermo Fisher Scientific Inc.
- 12.2. Key Product Portfolio
13. Appendix
- 13.1. Discussion Guide
- 13.2. License & Pricing
LIST OF FIGURES
- FIGURE 1. NANOBIOTECHNOLOGY MARKET RESEARCH PROCESS
- FIGURE 2. NANOBIOTECHNOLOGY MARKET SIZE, 2023 VS 2030
- FIGURE 3. NANOBIOTECHNOLOGY MARKET SIZE, 2018-2030 (USD MILLION)
- FIGURE 4. NANOBIOTECHNOLOGY MARKET SIZE, BY REGION, 2023 VS 2030 (%)
- FIGURE 5. NANOBIOTECHNOLOGY MARKET SIZE, BY REGION, 2023 VS 2024 VS 2030 (USD MILLION)
- FIGURE 6. NANOBIOTECHNOLOGY MARKET DYNAMICS
- FIGURE 7. NANOBIOTECHNOLOGY MARKET SIZE, BY PRODUCT, 2023 VS 2030 (%)
- FIGURE 8. NANOBIOTECHNOLOGY MARKET SIZE, BY PRODUCT, 2023 VS 2024 VS 2030 (USD MILLION)
- FIGURE 9. NANOBIOTECHNOLOGY MARKET SIZE, BY APPLICATION, 2023 VS 2030 (%)
- FIGURE 10. NANOBIOTECHNOLOGY MARKET SIZE, BY APPLICATION, 2023 VS 2024 VS 2030 (USD MILLION)
- FIGURE 11. AMERICAS NANOBIOTECHNOLOGY MARKET SIZE, BY COUNTRY, 2023 VS 2030 (%)
- FIGURE 12. AMERICAS NANOBIOTECHNOLOGY MARKET SIZE, BY COUNTRY, 2023 VS 2024 VS 2030 (USD MILLION)
- FIGURE 13. UNITED STATES NANOBIOTECHNOLOGY MARKET SIZE, BY STATE, 2023 VS 2030 (%)
- FIGURE 14. UNITED STATES NANOBIOTECHNOLOGY MARKET SIZE, BY STATE, 2023 VS 2024 VS 2030 (USD MILLION)
- FIGURE 15. ASIA-PACIFIC NANOBIOTECHNOLOGY MARKET SIZE, BY COUNTRY, 2023 VS 2030 (%)
- FIGURE 16. ASIA-PACIFIC NANOBIOTECHNOLOGY MARKET SIZE, BY COUNTRY, 2023 VS 2024 VS 2030 (USD MILLION)
- FIGURE 17. EUROPE, MIDDLE EAST & AFRICA NANOBIOTECHNOLOGY MARKET SIZE, BY COUNTRY, 2023 VS 2030 (%)
- FIGURE 18. EUROPE, MIDDLE EAST & AFRICA NANOBIOTECHNOLOGY MARKET SIZE, BY COUNTRY, 2023 VS 2024 VS 2030 (USD MILLION)
- FIGURE 19. NANOBIOTECHNOLOGY MARKET, FPNV POSITIONING MATRIX, 2023
- FIGURE 20. NANOBIOTECHNOLOGY MARKET SHARE, BY KEY PLAYER, 2023
LIST OF TABLES
- TABLE 1. NANOBIOTECHNOLOGY MARKET SEGMENTATION & COVERAGE
- TABLE 2. UNITED STATES DOLLAR EXCHANGE RATE, 2018-2023
- TABLE 3. NANOBIOTECHNOLOGY MARKET SIZE, 2018-2030 (USD MILLION)
- TABLE 4. GLOBAL NANOBIOTECHNOLOGY MARKET SIZE, BY REGION, 2018-2030 (USD MILLION)
- TABLE 5. NANOBIOTECHNOLOGY MARKET SIZE, BY PRODUCT, 2018-2030 (USD MILLION)
- TABLE 6. NANOBIOTECHNOLOGY MARKET SIZE, BY NANO-ENABLED DRUGS, BY REGION, 2018-2030 (USD MILLION)
- TABLE 7. NANOBIOTECHNOLOGY MARKET SIZE, BY NANODEVICES, BY REGION, 2018-2030 (USD MILLION)
- TABLE 8. NANOBIOTECHNOLOGY MARKET SIZE, BY NANOPARTICLES, BY REGION, 2018-2030 (USD MILLION)
- TABLE 9. NANOBIOTECHNOLOGY MARKET SIZE, BY NANOTECHNOLOGY TOOLS, BY REGION, 2018-2030 (USD MILLION)
- TABLE 10. NANOBIOTECHNOLOGY MARKET SIZE, BY APPLICATION, 2018-2030 (USD MILLION)
- TABLE 11. NANOBIOTECHNOLOGY MARKET SIZE, BY AGRICULTURE, BY REGION, 2018-2030 (USD MILLION)
- TABLE 12. NANOBIOTECHNOLOGY MARKET SIZE, BY CANCER TREATMENT, BY REGION, 2018-2030 (USD MILLION)
- TABLE 13. NANOBIOTECHNOLOGY MARKET SIZE, BY DIAGNOSTICS, BY REGION, 2018-2030 (USD MILLION)
- TABLE 14. NANOBIOTECHNOLOGY MARKET SIZE, BY DRUG DELIVERY, BY REGION, 2018-2030 (USD MILLION)
- TABLE 15. NANOBIOTECHNOLOGY MARKET SIZE, BY ENVIRONMENTAL MONITORING, BY REGION, 2018-2030 (USD MILLION)
- TABLE 16. NANOBIOTECHNOLOGY MARKET SIZE, BY REGENERATIVE MEDICINES, BY REGION, 2018-2030 (USD MILLION)
- TABLE 17. NANOBIOTECHNOLOGY MARKET SIZE, BY THERAPEUTICS, BY REGION, 2018-2030 (USD MILLION)
- TABLE 18. AMERICAS NANOBIOTECHNOLOGY MARKET SIZE, BY PRODUCT, 2018-2030 (USD MILLION)
- TABLE 19. AMERICAS NANOBIOTECHNOLOGY MARKET SIZE, BY APPLICATION, 2018-2030 (USD MILLION)
- TABLE 20. AMERICAS NANOBIOTECHNOLOGY MARKET SIZE, BY COUNTRY, 2018-2030 (USD MILLION)
- TABLE 21. ARGENTINA NANOBIOTECHNOLOGY MARKET SIZE, BY PRODUCT, 2018-2030 (USD MILLION)
- TABLE 22. ARGENTINA NANOBIOTECHNOLOGY MARKET SIZE, BY APPLICATION, 2018-2030 (USD MILLION)
- TABLE 23. BRAZIL NANOBIOTECHNOLOGY MARKET SIZE, BY PRODUCT, 2018-2030 (USD MILLION)
- TABLE 24. BRAZIL NANOBIOTECHNOLOGY MARKET SIZE, BY APPLICATION, 2018-2030 (USD MILLION)
- TABLE 25. CANADA NANOBIOTECHNOLOGY MARKET SIZE, BY PRODUCT, 2018-2030 (USD MILLION)
- TABLE 26. CANADA NANOBIOTECHNOLOGY MARKET SIZE, BY APPLICATION, 2018-2030 (USD MILLION)
- TABLE 27. MEXICO NANOBIOTECHNOLOGY MARKET SIZE, BY PRODUCT, 2018-2030 (USD MILLION)
- TABLE 28. MEXICO NANOBIOTECHNOLOGY MARKET SIZE, BY APPLICATION, 2018-2030 (USD MILLION)
- TABLE 29. UNITED STATES NANOBIOTECHNOLOGY MARKET SIZE, BY PRODUCT, 2018-2030 (USD MILLION)
- TABLE 30. UNITED STATES NANOBIOTECHNOLOGY MARKET SIZE, BY APPLICATION, 2018-2030 (USD MILLION)
- TABLE 31. UNITED STATES NANOBIOTECHNOLOGY MARKET SIZE, BY STATE, 2018-2030 (USD MILLION)
- TABLE 32. ASIA-PACIFIC NANOBIOTECHNOLOGY MARKET SIZE, BY PRODUCT, 2018-2030 (USD MILLION)
- TABLE 33. ASIA-PACIFIC NANOBIOTECHNOLOGY MARKET SIZE, BY APPLICATION, 2018-2030 (USD MILLION)
- TABLE 34. ASIA-PACIFIC NANOBIOTECHNOLOGY MARKET SIZE, BY COUNTRY, 2018-2030 (USD MILLION)
- TABLE 35. AUSTRALIA NANOBIOTECHNOLOGY MARKET SIZE, BY PRODUCT, 2018-2030 (USD MILLION)
- TABLE 36. AUSTRALIA NANOBIOTECHNOLOGY MARKET SIZE, BY APPLICATION, 2018-2030 (USD MILLION)
- TABLE 37. CHINA NANOBIOTECHNOLOGY MARKET SIZE, BY PRODUCT, 2018-2030 (USD MILLION)
- TABLE 38. CHINA NANOBIOTECHNOLOGY MARKET SIZE, BY APPLICATION, 2018-2030 (USD MILLION)
- TABLE 39. INDIA NANOBIOTECHNOLOGY MARKET SIZE, BY PRODUCT, 2018-2030 (USD MILLION)
- TABLE 40. INDIA NANOBIOTECHNOLOGY MARKET SIZE, BY APPLICATION, 2018-2030 (USD MILLION)
- TABLE 41. INDONESIA NANOBIOTECHNOLOGY MARKET SIZE, BY PRODUCT, 2018-2030 (USD MILLION)
- TABLE 42. INDONESIA NANOBIOTECHNOLOGY MARKET SIZE, BY APPLICATION, 2018-2030 (USD MILLION)
- TABLE 43. JAPAN NANOBIOTECHNOLOGY MARKET SIZE, BY PRODUCT, 2018-2030 (USD MILLION)
- TABLE 44. JAPAN NANOBIOTECHNOLOGY MARKET SIZE, BY APPLICATION, 2018-2030 (USD MILLION)
- TABLE 45. MALAYSIA NANOBIOTECHNOLOGY MARKET SIZE, BY PRODUCT, 2018-2030 (USD MILLION)
- TABLE 46. MALAYSIA NANOBIOTECHNOLOGY MARKET SIZE, BY APPLICATION, 2018-2030 (USD MILLION)
- TABLE 47. PHILIPPINES NANOBIOTECHNOLOGY MARKET SIZE, BY PRODUCT, 2018-2030 (USD MILLION)
- TABLE 48. PHILIPPINES NANOBIOTECHNOLOGY MARKET SIZE, BY APPLICATION, 2018-2030 (USD MILLION)
- TABLE 49. SINGAPORE NANOBIOTECHNOLOGY MARKET SIZE, BY PRODUCT, 2018-2030 (USD MILLION)
- TABLE 50. SINGAPORE NANOBIOTECHNOLOGY MARKET SIZE, BY APPLICATION, 2018-2030 (USD MILLION)
- TABLE 51. SOUTH KOREA NANOBIOTECHNOLOGY MARKET SIZE, BY PRODUCT, 2018-2030 (USD MILLION)
- TABLE 52. SOUTH KOREA NANOBIOTECHNOLOGY MARKET SIZE, BY APPLICATION, 2018-2030 (USD MILLION)
- TABLE 53. TAIWAN NANOBIOTECHNOLOGY MARKET SIZE, BY PRODUCT, 2018-2030 (USD MILLION)
- TABLE 54. TAIWAN NANOBIOTECHNOLOGY MARKET SIZE, BY APPLICATION, 2018-2030 (USD MILLION)
- TABLE 55. THAILAND NANOBIOTECHNOLOGY MARKET SIZE, BY PRODUCT, 2018-2030 (USD MILLION)
- TABLE 56. THAILAND NANOBIOTECHNOLOGY MARKET SIZE, BY APPLICATION, 2018-2030 (USD MILLION)
- TABLE 57. VIETNAM NANOBIOTECHNOLOGY MARKET SIZE, BY PRODUCT, 2018-2030 (USD MILLION)
- TABLE 58. VIETNAM NANOBIOTECHNOLOGY MARKET SIZE, BY APPLICATION, 2018-2030 (USD MILLION)
- TABLE 59. EUROPE, MIDDLE EAST & AFRICA NANOBIOTECHNOLOGY MARKET SIZE, BY PRODUCT, 2018-2030 (USD MILLION)
- TABLE 60. EUROPE, MIDDLE EAST & AFRICA NANOBIOTECHNOLOGY MARKET SIZE, BY APPLICATION, 2018-2030 (USD MILLION)
- TABLE 61. EUROPE, MIDDLE EAST & AFRICA NANOBIOTECHNOLOGY MARKET SIZE, BY COUNTRY, 2018-2030 (USD MILLION)
- TABLE 62. DENMARK NANOBIOTECHNOLOGY MARKET SIZE, BY PRODUCT, 2018-2030 (USD MILLION)
- TABLE 63. DENMARK NANOBIOTECHNOLOGY MARKET SIZE, BY APPLICATION, 2018-2030 (USD MILLION)
- TABLE 64. EGYPT NANOBIOTECHNOLOGY MARKET SIZE, BY PRODUCT, 2018-2030 (USD MILLION)
- TABLE 65. EGYPT NANOBIOTECHNOLOGY MARKET SIZE, BY APPLICATION, 2018-2030 (USD MILLION)
- TABLE 66. FINLAND NANOBIOTECHNOLOGY MARKET SIZE, BY PRODUCT, 2018-2030 (USD MILLION)
- TABLE 67. FINLAND NANOBIOTECHNOLOGY MARKET SIZE, BY APPLICATION, 2018-2030 (USD MILLION)
- TABLE 68. FRANCE NANOBIOTECHNOLOGY MARKET SIZE, BY PRODUCT, 2018-2030 (USD MILLION)
- TABLE 69. FRANCE NANOBIOTECHNOLOGY MARKET SIZE, BY APPLICATION, 2018-2030 (USD MILLION)
- TABLE 70. GERMANY NANOBIOTECHNOLOGY MARKET SIZE, BY PRODUCT, 2018-2030 (USD MILLION)
- TABLE 71. GERMANY NANOBIOTECHNOLOGY MARKET SIZE, BY APPLICATION, 2018-2030 (USD MILLION)
- TABLE 72. ISRAEL NANOBIOTECHNOLOGY MARKET SIZE, BY PRODUCT, 2018-2030 (USD MILLION)
- TABLE 73. ISRAEL NANOBIOTECHNOLOGY MARKET SIZE, BY APPLICATION, 2018-2030 (USD MILLION)
- TABLE 74. ITALY NANOBIOTECHNOLOGY MARKET SIZE, BY PRODUCT, 2018-2030 (USD MILLION)
- TABLE 75. ITALY NANOBIOTECHNOLOGY MARKET SIZE, BY APPLICATION, 2018-2030 (USD MILLION)
- TABLE 76. NETHERLANDS NANOBIOTECHNOLOGY MARKET SIZE, BY PRODUCT, 2018-2030 (USD MILLION)
- TABLE 77. NETHERLANDS NANOBIOTECHNOLOGY MARKET SIZE, BY APPLICATION, 2018-2030 (USD MILLION)
- TABLE 78. NIGERIA NANOBIOTECHNOLOGY MARKET SIZE, BY PRODUCT, 2018-2030 (USD MILLION)
- TABLE 79. NIGERIA NANOBIOTECHNOLOGY MARKET SIZE, BY APPLICATION, 2018-2030 (USD MILLION)
- TABLE 80. NORWAY NANOBIOTECHNOLOGY MARKET SIZE, BY PRODUCT, 2018-2030 (USD MILLION)
- TABLE 81. NORWAY NANOBIOTECHNOLOGY MARKET SIZE, BY APPLICATION, 2018-2030 (USD MILLION)
- TABLE 82. POLAND NANOBIOTECHNOLOGY MARKET SIZE, BY PRODUCT, 2018-2030 (USD MILLION)
- TABLE 83. POLAND NANOBIOTECHNOLOGY MARKET SIZE, BY APPLICATION, 2018-2030 (USD MILLION)
- TABLE 84. QATAR NANOBIOTECHNOLOGY MARKET SIZE, BY PRODUCT, 2018-2030 (USD MILLION)
- TABLE 85. QATAR NANOBIOTECHNOLOGY MARKET SIZE, BY APPLICATION, 2018-2030 (USD MILLION)
- TABLE 86. RUSSIA NANOBIOTECHNOLOGY MARKET SIZE, BY PRODUCT, 2018-2030 (USD MILLION)
- TABLE 87. RUSSIA NANOBIOTECHNOLOGY MARKET SIZE, BY APPLICATION, 2018-2030 (USD MILLION)
- TABLE 88. SAUDI ARABIA NANOBIOTECHNOLOGY MARKET SIZE, BY PRODUCT, 2018-2030 (USD MILLION)
- TABLE 89. SAUDI ARABIA NANOBIOTECHNOLOGY MARKET SIZE, BY APPLICATION, 2018-2030 (USD MILLION)
- TABLE 90. SOUTH AFRICA NANOBIOTECHNOLOGY MARKET SIZE, BY PRODUCT, 2018-2030 (USD MILLION)
- TABLE 91. SOUTH AFRICA NANOBIOTECHNOLOGY MARKET SIZE, BY APPLICATION, 2018-2030 (USD MILLION)
- TABLE 92. SPAIN NANOBIOTECHNOLOGY MARKET SIZE, BY PRODUCT, 2018-2030 (USD MILLION)
- TABLE 93. SPAIN NANOBIOTECHNOLOGY MARKET SIZE, BY APPLICATION, 2018-2030 (USD MILLION)
- TABLE 94. SWEDEN NANOBIOTECHNOLOGY MARKET SIZE, BY PRODUCT, 2018-2030 (USD MILLION)
- TABLE 95. SWEDEN NANOBIOTECHNOLOGY MARKET SIZE, BY APPLICATION, 2018-2030 (USD MILLION)
- TABLE 96. SWITZERLAND NANOBIOTECHNOLOGY MARKET SIZE, BY PRODUCT, 2018-2030 (USD MILLION)
- TABLE 97. SWITZERLAND NANOBIOTECHNOLOGY MARKET SIZE, BY APPLICATION, 2018-2030 (USD MILLION)
- TABLE 98. TURKEY NANOBIOTECHNOLOGY MARKET SIZE, BY PRODUCT, 2018-2030 (USD MILLION)
- TABLE 99. TURKEY NANOBIOTECHNOLOGY MARKET SIZE, BY APPLICATION, 2018-2030 (USD MILLION)
- TABLE 100. UNITED ARAB EMIRATES NANOBIOTECHNOLOGY MARKET SIZE, BY PRODUCT, 2018-2030 (USD MILLION)
- TABLE 101. UNITED ARAB EMIRATES NANOBIOTECHNOLOGY MARKET SIZE, BY APPLICATION, 2018-2030 (USD MILLION)
- TABLE 102. UNITED KINGDOM NANOBIOTECHNOLOGY MARKET SIZE, BY PRODUCT, 2018-2030 (USD MILLION)
- TABLE 103. UNITED KINGDOM NANOBIOTECHNOLOGY MARKET SIZE, BY APPLICATION, 2018-2030 (USD MILLION)
- TABLE 104. NANOBIOTECHNOLOGY MARKET, FPNV POSITIONING MATRIX, 2023
- TABLE 105. NANOBIOTECHNOLOGY MARKET SHARE, BY KEY PLAYER, 2023
- TABLE 106. NANOBIOTECHNOLOGY MARKET LICENSE & PRICING
 2024 年能源应用奈米技术全球市场报告
 图形化市场:按类型、技术、应用和最终用途划分 - 2024-2030 年全球预测
 奈米技术市场:按类型、最终用户划分 - 2024-2030 年全球预测
 全球奈米技术市场规模研究与预测,按类型(奈米设备、奈米感测器)、产业(电子、医疗保健、製造、能源与电力、汽车、航太与国防、食品与饮料、其他)和区域分析,2023 -2030 年
 DNA 奈米技术市场,按产品类型、应用、最终用户、国家和地区 - 2024-2032 年行业分析、市场规模、市场份额和预测
 全球奈米技术市场规模、份额、成长分析,按类型、产业、地区划分 - 产业预测,2024-2031 年
 2030 年奈米技术包装市场预测:按技术、应用、最终用户和地区进行的全球分析
 2024 年卫星奈米技术应用全球市场报告
 2024 年奈米技术医疗设备全球市场报告
 全球奈米生物技术市场:按类型、疗法、技术、应用、最终用户、地区、机会、预测,2017-2031