


 |
市场调查报告书
商品编码
1413816
3D 蛋白质结构分析市场:按成分、方法和最终用户划分 - 2024-2030 年全球预测3D Protein Structure Analysis Market by Component (Consumable, Instrument, Software), Technique (Cryo Electron Microscopy, NMR spectroscopy, X-ray Crystallography), End-User - Global Forecast 2024-2030 |
||||||
※ 本网页内容可能与最新版本有所差异。详细情况请与我们联繫。
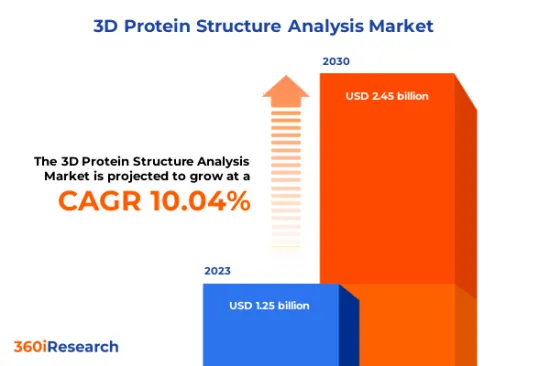
3D蛋白质结构分析市场规模预计2023年为12.5亿美元,2024年达到13.8亿美元,预计2030年将达到24.5亿美元,复合年增长率为10.04%。
3D 蛋白质结构分析的全球市场
| 主要市场统计 | |
|---|---|
| 基准年[2023] | 12.5亿美元 |
| 预测年份 [2024] | 13.8亿美元 |
| 预测年份 [2030] | 24.5亿美元 |
| 复合年增长率(%) | 10.04% |
3D 蛋白质结构分析市场由一系列用于确定蛋白质分子内原子的3D的产品、服务和解决方案组成。这些解决方案帮助生物化学、分子生物学、药理学和生物技术领域的研究人员和专家了解生物过程中的蛋白质功能、相互作用和整体机制。 3D蛋白质结构分析的主要应用包括药物研发、药物设计、蛋白质功能分析和疾病机制阐明。彻底改变这一领域的主要最终用户包括学术研究机构、製药公司、生技公司和 CRO(委外研发机构)。由于研发投入增加以及慢性病蔓延对开发新药的快速需求,市场规模不断扩大。运算能力和生物资讯学工具的进步进一步扩大了市场基础。成长动力包括蛋白质结构分析方法的技术进步、生物製药公司研发投资的增加以及学术机构和私人公司之间跨学科研究合作的增加。此外,对个人化医疗和结构生物学的日益关注在推动市场向前发展方面发挥关键作用。人工智慧和机器学习在蛋白质结构预测和分析中的采用带来了 3D 蛋白质结构分析的新商机。此外,扩展到新兴国家开拓的市场以及 3D 蛋白质模型在 COVID-19 等新兴疾病研究中的应用提供了潜在的成长途径。
区域洞察
美国处于 3D 蛋白质结构分析市场的前沿,受益于强大的生物技术研究基础设施、公共和私营部门的大量投资,以及充满活力的新兴企业和老牌公司生态系统。着名製药公司和着名学术研究机构的存在促进了创新和客户购买。这体现在我们获得的专利数量上,该专利数量位居世界前列。欧盟国家拥有完善的製药工业和先进的研究机构,这正在推动3D蛋白质结构分析的需求。 Horizon Europe 等欧盟法律规范和资助机制鼓励蛋白质分析领域的合作和创新。创新药物计划 (IMI) 等倡议促进了主要行业相关人员之间的合作伙伴关係,并推动全部区域的投资和新技术的采用。在中东和非洲地区,市场形势多元。儘管中东一些国家拥有先进的医疗保健系统,并且正在增加研究投资,但许多非洲国家仍然是快速成长的市场,潜力开拓。国际组织增加的资金以及与已开发国家在技术转移方面的合作可以促进这些地区的成长。亚太地区是全球蛋白质结构分析市场成长最快的地区。中国蓬勃发展的生物技术产业和政府对基础研究的投资使其成为重要参与者。日本仍然是一个技术密集型市场,拥有领先的蛋白质研究和高科技仪器技术,而印度则凭藉其不断扩大的生物製药行业和改善的研究基础设施,正在成为一个有吸引力的市场。儘管经济背景各异,但这些国家通用医疗保健和药物开发创新,从而导致对 3D 蛋白质分析解决方案的需求不断增长。
FPNV定位矩阵
FPNV定位矩阵对于评估3D蛋白质结构分析市场至关重要。我们检视与业务策略和产品满意度相关的关键指标,以对供应商进行全面评估。这种深入的分析使用户能够根据自己的要求做出资讯的决策。根据评估,供应商被分为四个成功程度不同的像限:前沿(F)、探路者(P)、利基(N)和重要(V)。
市场占有率分析
市场占有率分析是一种综合工具,可对 3D 蛋白质结构分析市场中供应商的现状进行深入而详细的研究。全面比较和分析供应商在整体收益、基本客群和其他关键指标方面的贡献,以便更好地了解公司的绩效及其在争夺市场占有率时面临的挑战。此外,该分析还提供了对该行业竞争特征的宝贵考察,包括在研究基准年观察到的累积、分散主导地位和合併特征等因素。这种详细程度的提高使供应商能够做出更资讯的决策并制定有效的策略,从而在市场上获得竞争优势。
该报告对以下几个方面提供了宝贵的见解:
1-市场渗透率:提供有关主要企业所服务的市场的全面资讯。
2-市场开拓:我们深入研究利润丰厚的新兴市场,并分析它们在成熟细分市场中的渗透率。
3- 市场多元化:提供有关新产品发布、开拓地区、最新发展和投资的详细资讯。
4-竞争力评估与资讯:对主要企业的市场占有率、策略、产品、认证、监管状况、专利状况、製造能力等进行全面评估。
5- 产品开发与创新:提供对未来技术、研发活动和突破性产品开发的见解。
本报告解决了以下关键问题:
1-3D蛋白质结构分析市场的市场规模与预测是多少?
2-3D 蛋白质结构分析市场预测期间需要考虑投资的产品、细分市场、应用和领域有哪些?
3-3D蛋白质结构分析市场的技术趋势和法律规范是什么?
4-3D蛋白质结构分析市场主要厂商的市场占有率是多少?
5-进入3D蛋白质结构分析市场的合适型态和策略手段是什么?
目录
第一章 前言
第二章调查方法
第三章执行摘要
第四章市场概况
第五章市场洞察
- 市场动态
- 促进因素
- 人们越来越多地认识到蛋白质在疾病进展中的重要性
- 加大医药研发投入
- 抑制因素
- 缺乏熟练人员,进行 3D 蛋白质结构分析困难
- 机会
- 3D蛋白质结构分析设备的技术进步
- 专注于3D蛋白质结构分析的自动化和生物资讯学工具的使用
- 任务
- 准确预测蛋白质结构和相互作用的技术限制
- 促进因素
- 市场区隔分析
- 组件:该软体因其易用性、资料准确性、强大的可视化工具以及持续的支援和更新而受到好评。
- 技术:冷冻电子显微镜是研究动态过程和瞬时蛋白质结构的建议选择。
- 最终用户:製药和生物技术公司广泛使用 3D 蛋白质结构分析来快速将科学进步转化为适销对路的治疗方法。
- 市场趋势分析
- 高通膨的累积效应
- 波特五力分析
- 价值炼和关键路径分析
- 法律规范
第 6 章 3D 蛋白质结构分析市场:依组成部分
- 消耗品
- 装置
- 软体
第 7 章 3D 蛋白质结构分析市场:依技术分类
- 冷冻电子显微镜
- 核磁共振波谱
- X射线结晶结构分析
第 8 章 3D 蛋白质结构分析市场:依最终使用者分类
- 学术机构/政府机构
- 受託研究机构
- 製药和生物技术公司
第9章 美洲3D蛋白质结构分析市场
- 阿根廷
- 巴西
- 加拿大
- 墨西哥
- 美国
第10章亚太3D蛋白质结构分析市场
- 澳洲
- 中国
- 印度
- 印尼
- 日本
- 马来西亚
- 菲律宾
- 新加坡
- 韩国
- 台湾
- 泰国
- 越南
第11章欧洲、中东和非洲的3D蛋白质结构分析市场
- 丹麦
- 埃及
- 芬兰
- 法国
- 德国
- 以色列
- 义大利
- 荷兰
- 奈及利亚
- 挪威
- 波兰
- 卡达
- 俄罗斯
- 沙乌地阿拉伯
- 南非
- 西班牙
- 瑞典
- 瑞士
- 土耳其
- 阿拉伯聯合大公国
- 英国
第十二章竞争形势
- FPNV定位矩阵
- 市场占有率分析:主要企业
- 主要企业竞争情境分析
- 併购
- 合约、合作和伙伴关係
第13章竞争产品组合
- 主要公司简介
- Agilent Technologies, Inc.
- Anton Paar GmbH
- Arinax Scientific Instrumentation
- Bio-Prodict
- Bruker Corporation
- Cambridge Isotope Laboratories, Inc.
- CD ComputaBio
- Charles River Laboratories, Inc.
- Corning Incorporated
- Creative Proteomics
- Dassault Systemes SE
- Discngine SAS
- DNASTAR
- Fujifilm Holdings Corporation
- Greiner Bio-One International GmbH
- Hampton Research Corporation
- Jena Bioscience GmbH
- JEOL Ltd.
- Malvern Panalytical Ltd.
- Merck KGaA
- MiTeGen, LLC
- Molecular Dimensions
- NanoImaging Services
- Promega Corporation
- Rigaku Corporation
- Saromics Biostructures AB
- Schrodinger, Inc.
- Sygnature Discovery Ltd.
- Thermo Fisher Scientific Inc.
- 主要产品系列
第十四章附录
- 讨论指南
- 关于许可证和定价
[186 Pages Report] The 3D Protein Structure Analysis Market size was estimated at USD 1.25 billion in 2023 and expected to reach USD 1.38 billion in 2024, at a CAGR 10.04% to reach USD 2.45 billion by 2030.
Global 3D Protein Structure Analysis Market
| KEY MARKET STATISTICS | |
|---|---|
| Base Year [2023] | USD 1.25 billion |
| Estimated Year [2024] | USD 1.38 billion |
| Forecast Year [2030] | USD 2.45 billion |
| CAGR (%) | 10.04% |
The market for 3D protein structure analysis comprises the range of products, services, and solutions used in determining the three-dimensional arrangement of atoms within a protein molecule. These solutions aid researchers and professionals in the field of biochemistry, molecular biology, pharmacology, and biotechnology to comprehend protein function, interaction, and the overall mechanism within biological processes. The primary applications of 3D protein structure analysis include drug discovery and design, protein function analysis, and understanding disease mechanisms. Key end-users revolutionizing the field encompass academic research institutions, pharmaceutical and biotechnological companies, and contract research organizations (CROs). Market scope expands with increased investments in research and development activities and a surge in demand for new drug discovery fueled by the growing prevalence of chronic diseases. The advancement of computational power and bioinformatics tools has further broadened the scope of the market. Growth drivers include technological advancements in protein structure analysis methods, rising investment in research and development by biopharmaceutical companies, and the growing number of interdisciplinary collaborations between academic institutions and the private sector. Moreover, the increased focus on personalized medicine and structural biology plays a crucial role in propelling the market forward. New opportunities in the 3D protein structure analysis stem from the adoption of artificial intelligence and machine learning in protein structure prediction and analysis. Additionally, the expansion into untapped markets in developing countries and the application of 3D protein models in the study of emerging diseases like COVID-19 offer potential growth avenues.
Regional Insights
The United States stands at the forefront of the 3D protein structure analysis market, benefiting from a strong infrastructure for biotechnological research, substantial investment from both public and private sectors, and a vibrant ecosystem of startups and established corporations. The presence of prominent pharmaceutical companies, as well as renowned academic and research institutions, fuels innovation and customer purchasing. This is reflected in the volume of patents issued, which is among the highest globally. EU countries have well-established pharmaceutical industries and sophisticated research institutions that drive the demand for 3D protein structure analysis. The EU's regulatory framework and funding mechanisms such as Horizon Europe encourage collaborative research and innovation in protein analysis. Initiatives such as the Innovative Medicines Initiative (IMI) foster partnerships between key industry players, enhancing investment and adoption of new technologies across the region. The MEA region shows a varied landscape in the 3D protein structure analysis market. While certain countries in the Middle East have advanced healthcare systems with growing investment in research, many African nations are still burgeoning markets with untapped potential. Increased funding from international bodies and collaboration with developed nations for technology transfer can drive growth in these regions. The Asia Pacific region represents a rapidly growing section of the global protein structure analysis market. China's fast-growing biotech sector and heavy government investment in basic research have positioned it as a significant player. Japan remains a technology-intense market with pioneering protein research and high-tech instrumentation techniques, while India is emerging as an attractive market with its expanding biopharmaceutical industry and improving research infrastructure. Despite diverse economic backgrounds, these countries have a common pursuit towards innovation in healthcare and drug development, leading to increased demand for 3D protein analysis solutions.
FPNV Positioning Matrix
The FPNV Positioning Matrix is pivotal in evaluating the 3D Protein Structure Analysis Market. It offers a comprehensive assessment of vendors, examining key metrics related to Business Strategy and Product Satisfaction. This in-depth analysis empowers users to make well-informed decisions aligned with their requirements. Based on the evaluation, the vendors are then categorized into four distinct quadrants representing varying levels of success: Forefront (F), Pathfinder (P), Niche (N), or Vital (V).
Market Share Analysis
The Market Share Analysis is a comprehensive tool that provides an insightful and in-depth examination of the current state of vendors in the 3D Protein Structure Analysis Market. By meticulously comparing and analyzing vendor contributions in terms of overall revenue, customer base, and other key metrics, we can offer companies a greater understanding of their performance and the challenges they face when competing for market share. Additionally, this analysis provides valuable insights into the competitive nature of the sector, including factors such as accumulation, fragmentation dominance, and amalgamation traits observed over the base year period studied. With this expanded level of detail, vendors can make more informed decisions and devise effective strategies to gain a competitive edge in the market.
Key Company Profiles
The report delves into recent significant developments in the 3D Protein Structure Analysis Market, highlighting leading vendors and their innovative profiles. These include Agilent Technologies, Inc., Anton Paar GmbH, Arinax Scientific Instrumentation, Bio-Prodict, Bruker Corporation, Cambridge Isotope Laboratories, Inc., CD ComputaBio, Charles River Laboratories, Inc., Corning Incorporated, Creative Proteomics, Dassault Systemes SE, Discngine SAS, DNASTAR, Fujifilm Holdings Corporation, Greiner Bio-One International GmbH, Hampton Research Corporation, Jena Bioscience GmbH, JEOL Ltd., Malvern Panalytical Ltd., Merck KGaA, MiTeGen, LLC, Molecular Dimensions, NanoImaging Services, Promega Corporation, Rigaku Corporation, Saromics Biostructures AB, Schrodinger, Inc., Sygnature Discovery Ltd., and Thermo Fisher Scientific Inc..
Market Segmentation & Coverage
This research report categorizes the 3D Protein Structure Analysis Market to forecast the revenues and analyze trends in each of the following sub-markets:
- Component
- Consumable
- Instrument
- Software
- Technique
- Cryo Electron Microscopy
- NMR spectroscopy
- X-ray Crystallography
- End-User
- Academic & Government Institutes
- Contract Research Organizations
- Pharmaceutical & Biotechnology Companies
- Region
- Americas
- Argentina
- Brazil
- Canada
- Mexico
- United States
- California
- Florida
- Illinois
- New York
- Ohio
- Pennsylvania
- Texas
- Asia-Pacific
- Australia
- China
- India
- Indonesia
- Japan
- Malaysia
- Philippines
- Singapore
- South Korea
- Taiwan
- Thailand
- Vietnam
- Europe, Middle East & Africa
- Denmark
- Egypt
- Finland
- France
- Germany
- Israel
- Italy
- Netherlands
- Nigeria
- Norway
- Poland
- Qatar
- Russia
- Saudi Arabia
- South Africa
- Spain
- Sweden
- Switzerland
- Turkey
- United Arab Emirates
- United Kingdom
- Americas
The report offers valuable insights on the following aspects:
1. Market Penetration: It presents comprehensive information on the market provided by key players.
2. Market Development: It delves deep into lucrative emerging markets and analyzes the penetration across mature market segments.
3. Market Diversification: It provides detailed information on new product launches, untapped geographic regions, recent developments, and investments.
4. Competitive Assessment & Intelligence: It conducts an exhaustive assessment of market shares, strategies, products, certifications, regulatory approvals, patent landscape, and manufacturing capabilities of the leading players.
5. Product Development & Innovation: It offers intelligent insights on future technologies, R&D activities, and breakthrough product developments.
The report addresses key questions such as:
1. What is the market size and forecast of the 3D Protein Structure Analysis Market?
2. Which products, segments, applications, and areas should one consider investing in over the forecast period in the 3D Protein Structure Analysis Market?
3. What are the technology trends and regulatory frameworks in the 3D Protein Structure Analysis Market?
4. What is the market share of the leading vendors in the 3D Protein Structure Analysis Market?
5. Which modes and strategic moves are suitable for entering the 3D Protein Structure Analysis Market?
Table of Contents
1. Preface
- 1.1. Objectives of the Study
- 1.2. Market Segmentation & Coverage
- 1.3. Years Considered for the Study
- 1.4. Currency & Pricing
- 1.5. Language
- 1.6. Limitations
- 1.7. Assumptions
- 1.8. Stakeholders
2. Research Methodology
- 2.1. Define: Research Objective
- 2.2. Determine: Research Design
- 2.3. Prepare: Research Instrument
- 2.4. Collect: Data Source
- 2.5. Analyze: Data Interpretation
- 2.6. Formulate: Data Verification
- 2.7. Publish: Research Report
- 2.8. Repeat: Report Update
3. Executive Summary
4. Market Overview
- 4.1. Introduction
- 4.2. 3D Protein Structure Analysis Market, by Region
5. Market Insights
- 5.1. Market Dynamics
- 5.1.1. Drivers
- 5.1.1.1. Growing scientific awareness about the importance of proteins in disease progression
- 5.1.1.2. Rise in investment for research and development of drugs
- 5.1.2. Restraints
- 5.1.2.1. Lack of skilled personnel and difficulty in performing 3d protein structure analysis
- 5.1.3. Opportunities
- 5.1.3.1. Technological advancements in equipment for 3D protein structure analysis
- 5.1.3.2. Focus on automation and use of bioinformatics tools in 3D protein structure analysis
- 5.1.4. Challenges
- 5.1.4.1. Technical limitations in accurately predicting protein structure and interactions
- 5.1.1. Drivers
- 5.2. Market Segmentation Analysis
- 5.2.1. Components: Softwares are highly valued for its user-friendliness, data accuracy, powerful visualization tools, and ongoing support and updates
- 5.2.2. Technology: Cryo-Electron Microscopy is a preferred choice for studying dynamic processes and transient protein structures
- 5.2.3. End-User: 3D protein structure analysis used crucially in pharmaceutical and biotechnology companies for a swift translation of scientific breakthroughs into marketable therapies
- 5.3. Market Trend Analysis
- 5.4. Cumulative Impact of High Inflation
- 5.5. Porter's Five Forces Analysis
- 5.5.1. Threat of New Entrants
- 5.5.2. Threat of Substitutes
- 5.5.3. Bargaining Power of Customers
- 5.5.4. Bargaining Power of Suppliers
- 5.5.5. Industry Rivalry
- 5.6. Value Chain & Critical Path Analysis
- 5.7. Regulatory Framework
6. 3D Protein Structure Analysis Market, by Component
- 6.1. Introduction
- 6.2. Consumable
- 6.3. Instrument
- 6.4. Software
7. 3D Protein Structure Analysis Market, by Technique
- 7.1. Introduction
- 7.2. Cryo Electron Microscopy
- 7.3. NMR spectroscopy
- 7.4. X-ray Crystallography
8. 3D Protein Structure Analysis Market, by End-User
- 8.1. Introduction
- 8.2. Academic & Government Institutes
- 8.3. Contract Research Organizations
- 8.4. Pharmaceutical & Biotechnology Companies
9. Americas 3D Protein Structure Analysis Market
- 9.1. Introduction
- 9.2. Argentina
- 9.3. Brazil
- 9.4. Canada
- 9.5. Mexico
- 9.6. United States
10. Asia-Pacific 3D Protein Structure Analysis Market
- 10.1. Introduction
- 10.2. Australia
- 10.3. China
- 10.4. India
- 10.5. Indonesia
- 10.6. Japan
- 10.7. Malaysia
- 10.8. Philippines
- 10.9. Singapore
- 10.10. South Korea
- 10.11. Taiwan
- 10.12. Thailand
- 10.13. Vietnam
11. Europe, Middle East & Africa 3D Protein Structure Analysis Market
- 11.1. Introduction
- 11.2. Denmark
- 11.3. Egypt
- 11.4. Finland
- 11.5. France
- 11.6. Germany
- 11.7. Israel
- 11.8. Italy
- 11.9. Netherlands
- 11.10. Nigeria
- 11.11. Norway
- 11.12. Poland
- 11.13. Qatar
- 11.14. Russia
- 11.15. Saudi Arabia
- 11.16. South Africa
- 11.17. Spain
- 11.18. Sweden
- 11.19. Switzerland
- 11.20. Turkey
- 11.21. United Arab Emirates
- 11.22. United Kingdom
12. Competitive Landscape
- 12.1. FPNV Positioning Matrix
- 12.2. Market Share Analysis, By Key Player
- 12.3. Competitive Scenario Analysis, By Key Player
- 12.3.1. Merger & Acquisition
- 12.3.1.1. Thermo Fisher to Acquire Olink for USD 3.1 Billion, Expanding Proteomics Presence
- 12.3.1.2. Agilent Announces Acquisition of e-MSion, Early-Stage Company Behind ECD Technology that Helps Accelerate Drug Development
- 12.3.2. Agreement, Collaboration, & Partnership
- 12.3.2.1. GenNext Technologies Announces Partnership with Emery Pharma on Full-Solution Biopharmaceutical Protein Footprinting Services
- 12.3.1. Merger & Acquisition
13. Competitive Portfolio
- 13.1. Key Company Profiles
- 13.1.1. Agilent Technologies, Inc.
- 13.1.2. Anton Paar GmbH
- 13.1.3. Arinax Scientific Instrumentation
- 13.1.4. Bio-Prodict
- 13.1.5. Bruker Corporation
- 13.1.6. Cambridge Isotope Laboratories, Inc.
- 13.1.7. CD ComputaBio
- 13.1.8. Charles River Laboratories, Inc.
- 13.1.9. Corning Incorporated
- 13.1.10. Creative Proteomics
- 13.1.11. Dassault Systemes SE
- 13.1.12. Discngine SAS
- 13.1.13. DNASTAR
- 13.1.14. Fujifilm Holdings Corporation
- 13.1.15. Greiner Bio-One International GmbH
- 13.1.16. Hampton Research Corporation
- 13.1.17. Jena Bioscience GmbH
- 13.1.18. JEOL Ltd.
- 13.1.19. Malvern Panalytical Ltd.
- 13.1.20. Merck KGaA
- 13.1.21. MiTeGen, LLC
- 13.1.22. Molecular Dimensions
- 13.1.23. NanoImaging Services
- 13.1.24. Promega Corporation
- 13.1.25. Rigaku Corporation
- 13.1.26. Saromics Biostructures AB
- 13.1.27. Schrodinger, Inc.
- 13.1.28. Sygnature Discovery Ltd.
- 13.1.29. Thermo Fisher Scientific Inc.
- 13.2. Key Product Portfolio
14. Appendix
- 14.1. Discussion Guide
- 14.2. License & Pricing
LIST OF FIGURES
- FIGURE 1. 3D PROTEIN STRUCTURE ANALYSIS MARKET RESEARCH PROCESS
- FIGURE 2. 3D PROTEIN STRUCTURE ANALYSIS MARKET SIZE, 2023 VS 2030
- FIGURE 3. 3D PROTEIN STRUCTURE ANALYSIS MARKET SIZE, 2018-2030 (USD MILLION)
- FIGURE 4. 3D PROTEIN STRUCTURE ANALYSIS MARKET SIZE, BY REGION, 2023 VS 2030 (%)
- FIGURE 5. 3D PROTEIN STRUCTURE ANALYSIS MARKET SIZE, BY REGION, 2023 VS 2024 VS 2030 (USD MILLION)
- FIGURE 6. 3D PROTEIN STRUCTURE ANALYSIS MARKET DYNAMICS
- FIGURE 7. 3D PROTEIN STRUCTURE ANALYSIS MARKET SIZE, BY COMPONENT, 2023 VS 2030 (%)
- FIGURE 8. 3D PROTEIN STRUCTURE ANALYSIS MARKET SIZE, BY COMPONENT, 2023 VS 2024 VS 2030 (USD MILLION)
- FIGURE 9. 3D PROTEIN STRUCTURE ANALYSIS MARKET SIZE, BY TECHNIQUE, 2023 VS 2030 (%)
- FIGURE 10. 3D PROTEIN STRUCTURE ANALYSIS MARKET SIZE, BY TECHNIQUE, 2023 VS 2024 VS 2030 (USD MILLION)
- FIGURE 11. 3D PROTEIN STRUCTURE ANALYSIS MARKET SIZE, BY END-USER, 2023 VS 2030 (%)
- FIGURE 12. 3D PROTEIN STRUCTURE ANALYSIS MARKET SIZE, BY END-USER, 2023 VS 2024 VS 2030 (USD MILLION)
- FIGURE 13. AMERICAS 3D PROTEIN STRUCTURE ANALYSIS MARKET SIZE, BY COUNTRY, 2023 VS 2030 (%)
- FIGURE 14. AMERICAS 3D PROTEIN STRUCTURE ANALYSIS MARKET SIZE, BY COUNTRY, 2023 VS 2024 VS 2030 (USD MILLION)
- FIGURE 15. UNITED STATES 3D PROTEIN STRUCTURE ANALYSIS MARKET SIZE, BY STATE, 2023 VS 2030 (%)
- FIGURE 16. UNITED STATES 3D PROTEIN STRUCTURE ANALYSIS MARKET SIZE, BY STATE, 2023 VS 2024 VS 2030 (USD MILLION)
- FIGURE 17. ASIA-PACIFIC 3D PROTEIN STRUCTURE ANALYSIS MARKET SIZE, BY COUNTRY, 2023 VS 2030 (%)
- FIGURE 18. ASIA-PACIFIC 3D PROTEIN STRUCTURE ANALYSIS MARKET SIZE, BY COUNTRY, 2023 VS 2024 VS 2030 (USD MILLION)
- FIGURE 19. EUROPE, MIDDLE EAST & AFRICA 3D PROTEIN STRUCTURE ANALYSIS MARKET SIZE, BY COUNTRY, 2023 VS 2030 (%)
- FIGURE 20. EUROPE, MIDDLE EAST & AFRICA 3D PROTEIN STRUCTURE ANALYSIS MARKET SIZE, BY COUNTRY, 2023 VS 2024 VS 2030 (USD MILLION)
- FIGURE 21. 3D PROTEIN STRUCTURE ANALYSIS MARKET, FPNV POSITIONING MATRIX, 2023
- FIGURE 22. 3D PROTEIN STRUCTURE ANALYSIS MARKET SHARE, BY KEY PLAYER, 2023
LIST OF TABLES
- TABLE 1. 3D PROTEIN STRUCTURE ANALYSIS MARKET SEGMENTATION & COVERAGE
- TABLE 2. UNITED STATES DOLLAR EXCHANGE RATE, 2018-2023
- TABLE 3. 3D PROTEIN STRUCTURE ANALYSIS MARKET SIZE, 2018-2030 (USD MILLION)
- TABLE 4. GLOBAL 3D PROTEIN STRUCTURE ANALYSIS MARKET SIZE, BY REGION, 2018-2030 (USD MILLION)
- TABLE 5. 3D PROTEIN STRUCTURE ANALYSIS MARKET SIZE, BY COMPONENT, 2018-2030 (USD MILLION)
- TABLE 6. 3D PROTEIN STRUCTURE ANALYSIS MARKET SIZE, BY CONSUMABLE, BY REGION, 2018-2030 (USD MILLION)
- TABLE 7. 3D PROTEIN STRUCTURE ANALYSIS MARKET SIZE, BY INSTRUMENT, BY REGION, 2018-2030 (USD MILLION)
- TABLE 8. 3D PROTEIN STRUCTURE ANALYSIS MARKET SIZE, BY SOFTWARE, BY REGION, 2018-2030 (USD MILLION)
- TABLE 9. 3D PROTEIN STRUCTURE ANALYSIS MARKET SIZE, BY TECHNIQUE, 2018-2030 (USD MILLION)
- TABLE 10. 3D PROTEIN STRUCTURE ANALYSIS MARKET SIZE, BY CRYO ELECTRON MICROSCOPY, BY REGION, 2018-2030 (USD MILLION)
- TABLE 11. 3D PROTEIN STRUCTURE ANALYSIS MARKET SIZE, BY NMR SPECTROSCOPY, BY REGION, 2018-2030 (USD MILLION)
- TABLE 12. 3D PROTEIN STRUCTURE ANALYSIS MARKET SIZE, BY X-RAY CRYSTALLOGRAPHY, BY REGION, 2018-2030 (USD MILLION)
- TABLE 13. 3D PROTEIN STRUCTURE ANALYSIS MARKET SIZE, BY END-USER, 2018-2030 (USD MILLION)
- TABLE 14. 3D PROTEIN STRUCTURE ANALYSIS MARKET SIZE, BY ACADEMIC & GOVERNMENT INSTITUTES, BY REGION, 2018-2030 (USD MILLION)
- TABLE 15. 3D PROTEIN STRUCTURE ANALYSIS MARKET SIZE, BY CONTRACT RESEARCH ORGANIZATIONS, BY REGION, 2018-2030 (USD MILLION)
- TABLE 16. 3D PROTEIN STRUCTURE ANALYSIS MARKET SIZE, BY PHARMACEUTICAL & BIOTECHNOLOGY COMPANIES, BY REGION, 2018-2030 (USD MILLION)
- TABLE 17. AMERICAS 3D PROTEIN STRUCTURE ANALYSIS MARKET SIZE, BY COMPONENT, 2018-2030 (USD MILLION)
- TABLE 18. AMERICAS 3D PROTEIN STRUCTURE ANALYSIS MARKET SIZE, BY TECHNIQUE, 2018-2030 (USD MILLION)
- TABLE 19. AMERICAS 3D PROTEIN STRUCTURE ANALYSIS MARKET SIZE, BY END-USER, 2018-2030 (USD MILLION)
- TABLE 20. AMERICAS 3D PROTEIN STRUCTURE ANALYSIS MARKET SIZE, BY COUNTRY, 2018-2030 (USD MILLION)
- TABLE 21. ARGENTINA 3D PROTEIN STRUCTURE ANALYSIS MARKET SIZE, BY COMPONENT, 2018-2030 (USD MILLION)
- TABLE 22. ARGENTINA 3D PROTEIN STRUCTURE ANALYSIS MARKET SIZE, BY TECHNIQUE, 2018-2030 (USD MILLION)
- TABLE 23. ARGENTINA 3D PROTEIN STRUCTURE ANALYSIS MARKET SIZE, BY END-USER, 2018-2030 (USD MILLION)
- TABLE 24. BRAZIL 3D PROTEIN STRUCTURE ANALYSIS MARKET SIZE, BY COMPONENT, 2018-2030 (USD MILLION)
- TABLE 25. BRAZIL 3D PROTEIN STRUCTURE ANALYSIS MARKET SIZE, BY TECHNIQUE, 2018-2030 (USD MILLION)
- TABLE 26. BRAZIL 3D PROTEIN STRUCTURE ANALYSIS MARKET SIZE, BY END-USER, 2018-2030 (USD MILLION)
- TABLE 27. CANADA 3D PROTEIN STRUCTURE ANALYSIS MARKET SIZE, BY COMPONENT, 2018-2030 (USD MILLION)
- TABLE 28. CANADA 3D PROTEIN STRUCTURE ANALYSIS MARKET SIZE, BY TECHNIQUE, 2018-2030 (USD MILLION)
- TABLE 29. CANADA 3D PROTEIN STRUCTURE ANALYSIS MARKET SIZE, BY END-USER, 2018-2030 (USD MILLION)
- TABLE 30. MEXICO 3D PROTEIN STRUCTURE ANALYSIS MARKET SIZE, BY COMPONENT, 2018-2030 (USD MILLION)
- TABLE 31. MEXICO 3D PROTEIN STRUCTURE ANALYSIS MARKET SIZE, BY TECHNIQUE, 2018-2030 (USD MILLION)
- TABLE 32. MEXICO 3D PROTEIN STRUCTURE ANALYSIS MARKET SIZE, BY END-USER, 2018-2030 (USD MILLION)
- TABLE 33. UNITED STATES 3D PROTEIN STRUCTURE ANALYSIS MARKET SIZE, BY COMPONENT, 2018-2030 (USD MILLION)
- TABLE 34. UNITED STATES 3D PROTEIN STRUCTURE ANALYSIS MARKET SIZE, BY TECHNIQUE, 2018-2030 (USD MILLION)
- TABLE 35. UNITED STATES 3D PROTEIN STRUCTURE ANALYSIS MARKET SIZE, BY END-USER, 2018-2030 (USD MILLION)
- TABLE 36. UNITED STATES 3D PROTEIN STRUCTURE ANALYSIS MARKET SIZE, BY STATE, 2018-2030 (USD MILLION)
- TABLE 37. ASIA-PACIFIC 3D PROTEIN STRUCTURE ANALYSIS MARKET SIZE, BY COMPONENT, 2018-2030 (USD MILLION)
- TABLE 38. ASIA-PACIFIC 3D PROTEIN STRUCTURE ANALYSIS MARKET SIZE, BY TECHNIQUE, 2018-2030 (USD MILLION)
- TABLE 39. ASIA-PACIFIC 3D PROTEIN STRUCTURE ANALYSIS MARKET SIZE, BY END-USER, 2018-2030 (USD MILLION)
- TABLE 40. ASIA-PACIFIC 3D PROTEIN STRUCTURE ANALYSIS MARKET SIZE, BY COUNTRY, 2018-2030 (USD MILLION)
- TABLE 41. AUSTRALIA 3D PROTEIN STRUCTURE ANALYSIS MARKET SIZE, BY COMPONENT, 2018-2030 (USD MILLION)
- TABLE 42. AUSTRALIA 3D PROTEIN STRUCTURE ANALYSIS MARKET SIZE, BY TECHNIQUE, 2018-2030 (USD MILLION)
- TABLE 43. AUSTRALIA 3D PROTEIN STRUCTURE ANALYSIS MARKET SIZE, BY END-USER, 2018-2030 (USD MILLION)
- TABLE 44. CHINA 3D PROTEIN STRUCTURE ANALYSIS MARKET SIZE, BY COMPONENT, 2018-2030 (USD MILLION)
- TABLE 45. CHINA 3D PROTEIN STRUCTURE ANALYSIS MARKET SIZE, BY TECHNIQUE, 2018-2030 (USD MILLION)
- TABLE 46. CHINA 3D PROTEIN STRUCTURE ANALYSIS MARKET SIZE, BY END-USER, 2018-2030 (USD MILLION)
- TABLE 47. INDIA 3D PROTEIN STRUCTURE ANALYSIS MARKET SIZE, BY COMPONENT, 2018-2030 (USD MILLION)
- TABLE 48. INDIA 3D PROTEIN STRUCTURE ANALYSIS MARKET SIZE, BY TECHNIQUE, 2018-2030 (USD MILLION)
- TABLE 49. INDIA 3D PROTEIN STRUCTURE ANALYSIS MARKET SIZE, BY END-USER, 2018-2030 (USD MILLION)
- TABLE 50. INDONESIA 3D PROTEIN STRUCTURE ANALYSIS MARKET SIZE, BY COMPONENT, 2018-2030 (USD MILLION)
- TABLE 51. INDONESIA 3D PROTEIN STRUCTURE ANALYSIS MARKET SIZE, BY TECHNIQUE, 2018-2030 (USD MILLION)
- TABLE 52. INDONESIA 3D PROTEIN STRUCTURE ANALYSIS MARKET SIZE, BY END-USER, 2018-2030 (USD MILLION)
- TABLE 53. JAPAN 3D PROTEIN STRUCTURE ANALYSIS MARKET SIZE, BY COMPONENT, 2018-2030 (USD MILLION)
- TABLE 54. JAPAN 3D PROTEIN STRUCTURE ANALYSIS MARKET SIZE, BY TECHNIQUE, 2018-2030 (USD MILLION)
- TABLE 55. JAPAN 3D PROTEIN STRUCTURE ANALYSIS MARKET SIZE, BY END-USER, 2018-2030 (USD MILLION)
- TABLE 56. MALAYSIA 3D PROTEIN STRUCTURE ANALYSIS MARKET SIZE, BY COMPONENT, 2018-2030 (USD MILLION)
- TABLE 57. MALAYSIA 3D PROTEIN STRUCTURE ANALYSIS MARKET SIZE, BY TECHNIQUE, 2018-2030 (USD MILLION)
- TABLE 58. MALAYSIA 3D PROTEIN STRUCTURE ANALYSIS MARKET SIZE, BY END-USER, 2018-2030 (USD MILLION)
- TABLE 59. PHILIPPINES 3D PROTEIN STRUCTURE ANALYSIS MARKET SIZE, BY COMPONENT, 2018-2030 (USD MILLION)
- TABLE 60. PHILIPPINES 3D PROTEIN STRUCTURE ANALYSIS MARKET SIZE, BY TECHNIQUE, 2018-2030 (USD MILLION)
- TABLE 61. PHILIPPINES 3D PROTEIN STRUCTURE ANALYSIS MARKET SIZE, BY END-USER, 2018-2030 (USD MILLION)
- TABLE 62. SINGAPORE 3D PROTEIN STRUCTURE ANALYSIS MARKET SIZE, BY COMPONENT, 2018-2030 (USD MILLION)
- TABLE 63. SINGAPORE 3D PROTEIN STRUCTURE ANALYSIS MARKET SIZE, BY TECHNIQUE, 2018-2030 (USD MILLION)
- TABLE 64. SINGAPORE 3D PROTEIN STRUCTURE ANALYSIS MARKET SIZE, BY END-USER, 2018-2030 (USD MILLION)
- TABLE 65. SOUTH KOREA 3D PROTEIN STRUCTURE ANALYSIS MARKET SIZE, BY COMPONENT, 2018-2030 (USD MILLION)
- TABLE 66. SOUTH KOREA 3D PROTEIN STRUCTURE ANALYSIS MARKET SIZE, BY TECHNIQUE, 2018-2030 (USD MILLION)
- TABLE 67. SOUTH KOREA 3D PROTEIN STRUCTURE ANALYSIS MARKET SIZE, BY END-USER, 2018-2030 (USD MILLION)
- TABLE 68. TAIWAN 3D PROTEIN STRUCTURE ANALYSIS MARKET SIZE, BY COMPONENT, 2018-2030 (USD MILLION)
- TABLE 69. TAIWAN 3D PROTEIN STRUCTURE ANALYSIS MARKET SIZE, BY TECHNIQUE, 2018-2030 (USD MILLION)
- TABLE 70. TAIWAN 3D PROTEIN STRUCTURE ANALYSIS MARKET SIZE, BY END-USER, 2018-2030 (USD MILLION)
- TABLE 71. THAILAND 3D PROTEIN STRUCTURE ANALYSIS MARKET SIZE, BY COMPONENT, 2018-2030 (USD MILLION)
- TABLE 72. THAILAND 3D PROTEIN STRUCTURE ANALYSIS MARKET SIZE, BY TECHNIQUE, 2018-2030 (USD MILLION)
- TABLE 73. THAILAND 3D PROTEIN STRUCTURE ANALYSIS MARKET SIZE, BY END-USER, 2018-2030 (USD MILLION)
- TABLE 74. VIETNAM 3D PROTEIN STRUCTURE ANALYSIS MARKET SIZE, BY COMPONENT, 2018-2030 (USD MILLION)
- TABLE 75. VIETNAM 3D PROTEIN STRUCTURE ANALYSIS MARKET SIZE, BY TECHNIQUE, 2018-2030 (USD MILLION)
- TABLE 76. VIETNAM 3D PROTEIN STRUCTURE ANALYSIS MARKET SIZE, BY END-USER, 2018-2030 (USD MILLION)
- TABLE 77. EUROPE, MIDDLE EAST & AFRICA 3D PROTEIN STRUCTURE ANALYSIS MARKET SIZE, BY COMPONENT, 2018-2030 (USD MILLION)
- TABLE 78. EUROPE, MIDDLE EAST & AFRICA 3D PROTEIN STRUCTURE ANALYSIS MARKET SIZE, BY TECHNIQUE, 2018-2030 (USD MILLION)
- TABLE 79. EUROPE, MIDDLE EAST & AFRICA 3D PROTEIN STRUCTURE ANALYSIS MARKET SIZE, BY END-USER, 2018-2030 (USD MILLION)
- TABLE 80. EUROPE, MIDDLE EAST & AFRICA 3D PROTEIN STRUCTURE ANALYSIS MARKET SIZE, BY COUNTRY, 2018-2030 (USD MILLION)
- TABLE 81. DENMARK 3D PROTEIN STRUCTURE ANALYSIS MARKET SIZE, BY COMPONENT, 2018-2030 (USD MILLION)
- TABLE 82. DENMARK 3D PROTEIN STRUCTURE ANALYSIS MARKET SIZE, BY TECHNIQUE, 2018-2030 (USD MILLION)
- TABLE 83. DENMARK 3D PROTEIN STRUCTURE ANALYSIS MARKET SIZE, BY END-USER, 2018-2030 (USD MILLION)
- TABLE 84. EGYPT 3D PROTEIN STRUCTURE ANALYSIS MARKET SIZE, BY COMPONENT, 2018-2030 (USD MILLION)
- TABLE 85. EGYPT 3D PROTEIN STRUCTURE ANALYSIS MARKET SIZE, BY TECHNIQUE, 2018-2030 (USD MILLION)
- TABLE 86. EGYPT 3D PROTEIN STRUCTURE ANALYSIS MARKET SIZE, BY END-USER, 2018-2030 (USD MILLION)
- TABLE 87. FINLAND 3D PROTEIN STRUCTURE ANALYSIS MARKET SIZE, BY COMPONENT, 2018-2030 (USD MILLION)
- TABLE 88. FINLAND 3D PROTEIN STRUCTURE ANALYSIS MARKET SIZE, BY TECHNIQUE, 2018-2030 (USD MILLION)
- TABLE 89. FINLAND 3D PROTEIN STRUCTURE ANALYSIS MARKET SIZE, BY END-USER, 2018-2030 (USD MILLION)
- TABLE 90. FRANCE 3D PROTEIN STRUCTURE ANALYSIS MARKET SIZE, BY COMPONENT, 2018-2030 (USD MILLION)
- TABLE 91. FRANCE 3D PROTEIN STRUCTURE ANALYSIS MARKET SIZE, BY TECHNIQUE, 2018-2030 (USD MILLION)
- TABLE 92. FRANCE 3D PROTEIN STRUCTURE ANALYSIS MARKET SIZE, BY END-USER, 2018-2030 (USD MILLION)
- TABLE 93. GERMANY 3D PROTEIN STRUCTURE ANALYSIS MARKET SIZE, BY COMPONENT, 2018-2030 (USD MILLION)
- TABLE 94. GERMANY 3D PROTEIN STRUCTURE ANALYSIS MARKET SIZE, BY TECHNIQUE, 2018-2030 (USD MILLION)
- TABLE 95. GERMANY 3D PROTEIN STRUCTURE ANALYSIS MARKET SIZE, BY END-USER, 2018-2030 (USD MILLION)
- TABLE 96. ISRAEL 3D PROTEIN STRUCTURE ANALYSIS MARKET SIZE, BY COMPONENT, 2018-2030 (USD MILLION)
- TABLE 97. ISRAEL 3D PROTEIN STRUCTURE ANALYSIS MARKET SIZE, BY TECHNIQUE, 2018-2030 (USD MILLION)
- TABLE 98. ISRAEL 3D PROTEIN STRUCTURE ANALYSIS MARKET SIZE, BY END-USER, 2018-2030 (USD MILLION)
- TABLE 99. ITALY 3D PROTEIN STRUCTURE ANALYSIS MARKET SIZE, BY COMPONENT, 2018-2030 (USD MILLION)
- TABLE 100. ITALY 3D PROTEIN STRUCTURE ANALYSIS MARKET SIZE, BY TECHNIQUE, 2018-2030 (USD MILLION)
- TABLE 101. ITALY 3D PROTEIN STRUCTURE ANALYSIS MARKET SIZE, BY END-USER, 2018-2030 (USD MILLION)
- TABLE 102. NETHERLANDS 3D PROTEIN STRUCTURE ANALYSIS MARKET SIZE, BY COMPONENT, 2018-2030 (USD MILLION)
- TABLE 103. NETHERLANDS 3D PROTEIN STRUCTURE ANALYSIS MARKET SIZE, BY TECHNIQUE, 2018-2030 (USD MILLION)
- TABLE 104. NETHERLANDS 3D PROTEIN STRUCTURE ANALYSIS MARKET SIZE, BY END-USER, 2018-2030 (USD MILLION)
- TABLE 105. NIGERIA 3D PROTEIN STRUCTURE ANALYSIS MARKET SIZE, BY COMPONENT, 2018-2030 (USD MILLION)
- TABLE 106. NIGERIA 3D PROTEIN STRUCTURE ANALYSIS MARKET SIZE, BY TECHNIQUE, 2018-2030 (USD MILLION)
- TABLE 107. NIGERIA 3D PROTEIN STRUCTURE ANALYSIS MARKET SIZE, BY END-USER, 2018-2030 (USD MILLION)
- TABLE 108. NORWAY 3D PROTEIN STRUCTURE ANALYSIS MARKET SIZE, BY COMPONENT, 2018-2030 (USD MILLION)
- TABLE 109. NORWAY 3D PROTEIN STRUCTURE ANALYSIS MARKET SIZE, BY TECHNIQUE, 2018-2030 (USD MILLION)
- TABLE 110. NORWAY 3D PROTEIN STRUCTURE ANALYSIS MARKET SIZE, BY END-USER, 2018-2030 (USD MILLION)
- TABLE 111. POLAND 3D PROTEIN STRUCTURE ANALYSIS MARKET SIZE, BY COMPONENT, 2018-2030 (USD MILLION)
- TABLE 112. POLAND 3D PROTEIN STRUCTURE ANALYSIS MARKET SIZE, BY TECHNIQUE, 2018-2030 (USD MILLION)
- TABLE 113. POLAND 3D PROTEIN STRUCTURE ANALYSIS MARKET SIZE, BY END-USER, 2018-2030 (USD MILLION)
- TABLE 114. QATAR 3D PROTEIN STRUCTURE ANALYSIS MARKET SIZE, BY COMPONENT, 2018-2030 (USD MILLION)
- TABLE 115. QATAR 3D PROTEIN STRUCTURE ANALYSIS MARKET SIZE, BY TECHNIQUE, 2018-2030 (USD MILLION)
- TABLE 116. QATAR 3D PROTEIN STRUCTURE ANALYSIS MARKET SIZE, BY END-USER, 2018-2030 (USD MILLION)
- TABLE 117. RUSSIA 3D PROTEIN STRUCTURE ANALYSIS MARKET SIZE, BY COMPONENT, 2018-2030 (USD MILLION)
- TABLE 118. RUSSIA 3D PROTEIN STRUCTURE ANALYSIS MARKET SIZE, BY TECHNIQUE, 2018-2030 (USD MILLION)
- TABLE 119. RUSSIA 3D PROTEIN STRUCTURE ANALYSIS MARKET SIZE, BY END-USER, 2018-2030 (USD MILLION)
- TABLE 120. SAUDI ARABIA 3D PROTEIN STRUCTURE ANALYSIS MARKET SIZE, BY COMPONENT, 2018-2030 (USD MILLION)
- TABLE 121. SAUDI ARABIA 3D PROTEIN STRUCTURE ANALYSIS MARKET SIZE, BY TECHNIQUE, 2018-2030 (USD MILLION)
- TABLE 122. SAUDI ARABIA 3D PROTEIN STRUCTURE ANALYSIS MARKET SIZE, BY END-USER, 2018-2030 (USD MILLION)
- TABLE 123. SOUTH AFRICA 3D PROTEIN STRUCTURE ANALYSIS MARKET SIZE, BY COMPONENT, 2018-2030 (USD MILLION)
- TABLE 124. SOUTH AFRICA 3D PROTEIN STRUCTURE ANALYSIS MARKET SIZE, BY TECHNIQUE, 2018-2030 (USD MILLION)
- TABLE 125. SOUTH AFRICA 3D PROTEIN STRUCTURE ANALYSIS MARKET SIZE, BY END-USER, 2018-2030 (USD MILLION)
- TABLE 126. SPAIN 3D PROTEIN STRUCTURE ANALYSIS MARKET SIZE, BY COMPONENT, 2018-2030 (USD MILLION)
- TABLE 127. SPAIN 3D PROTEIN STRUCTURE ANALYSIS MARKET SIZE, BY TECHNIQUE, 2018-2030 (USD MILLION)
- TABLE 128. SPAIN 3D PROTEIN STRUCTURE ANALYSIS MARKET SIZE, BY END-USER, 2018-2030 (USD MILLION)
- TABLE 129. SWEDEN 3D PROTEIN STRUCTURE ANALYSIS MARKET SIZE, BY COMPONENT, 2018-2030 (USD MILLION)
- TABLE 130. SWEDEN 3D PROTEIN STRUCTURE ANALYSIS MARKET SIZE, BY TECHNIQUE, 2018-2030 (USD MILLION)
- TABLE 131. SWEDEN 3D PROTEIN STRUCTURE ANALYSIS MARKET SIZE, BY END-USER, 2018-2030 (USD MILLION)
- TABLE 132. SWITZERLAND 3D PROTEIN STRUCTURE ANALYSIS MARKET SIZE, BY COMPONENT, 2018-2030 (USD MILLION)
- TABLE 133. SWITZERLAND 3D PROTEIN STRUCTURE ANALYSIS MARKET SIZE, BY TECHNIQUE, 2018-2030 (USD MILLION)
- TABLE 134. SWITZERLAND 3D PROTEIN STRUCTURE ANALYSIS MARKET SIZE, BY END-USER, 2018-2030 (USD MILLION)
- TABLE 135. TURKEY 3D PROTEIN STRUCTURE ANALYSIS MARKET SIZE, BY COMPONENT, 2018-2030 (USD MILLION)
- TABLE 136. TURKEY 3D PROTEIN STRUCTURE ANALYSIS MARKET SIZE, BY TECHNIQUE, 2018-2030 (USD MILLION)
- TABLE 137. TURKEY 3D PROTEIN STRUCTURE ANALYSIS MARKET SIZE, BY END-USER, 2018-2030 (USD MILLION)
- TABLE 138. UNITED ARAB EMIRATES 3D PROTEIN STRUCTURE ANALYSIS MARKET SIZE, BY COMPONENT, 2018-2030 (USD MILLION)
- TABLE 139. UNITED ARAB EMIRATES 3D PROTEIN STRUCTURE ANALYSIS MARKET SIZE, BY TECHNIQUE, 2018-2030 (USD MILLION)
- TABLE 140. UNITED ARAB EMIRATES 3D PROTEIN STRUCTURE ANALYSIS MARKET SIZE, BY END-USER, 2018-2030 (USD MILLION)
- TABLE 141. UNITED KINGDOM 3D PROTEIN STRUCTURE ANALYSIS MARKET SIZE, BY COMPONENT, 2018-2030 (USD MILLION)
- TABLE 142. UNITED KINGDOM 3D PROTEIN STRUCTURE ANALYSIS MARKET SIZE, BY TECHNIQUE, 2018-2030 (USD MILLION)
- TABLE 143. UNITED KINGDOM 3D PROTEIN STRUCTURE ANALYSIS MARKET SIZE, BY END-USER, 2018-2030 (USD MILLION)
- TABLE 144. 3D PROTEIN STRUCTURE ANALYSIS MARKET, FPNV POSITIONING MATRIX, 2023
- TABLE 145. 3D PROTEIN STRUCTURE ANALYSIS MARKET SHARE, BY KEY PLAYER, 2023
- TABLE 146. 3D PROTEIN STRUCTURE ANALYSIS MARKET LICENSE & PRICING
 X 射线结晶市场:按类型、按 X 射线源、按应用、按最终用户 - 2024-2030 年全球预测
 X 射线结晶的全球市场
 蛋白质结晶和结晶市场:按技术、产品和服务、最终用户划分 - 全球预测 2023-2030 年
 三维蛋白质结构分析市场 - 2017-2027年全球行业规模、份额、趋势、机会和预测,按组件、技术、终端用户、公司和地区划分
 2022-2028 年全球蛋白质结晶市场规模、份额、行业趋势分析报告(按最终用户(製药/生物製品公司、学术/研究机构)、技术、产品、地区展望和预测)
 2023 ~ 2030 年各产品、技术、最终用途、地区、细分市场预测的蛋白质结晶市场规模、份额和趋势分析报告
 蛋白质结晶化的全球市场:现状分析、预测(2022年~2028年)
 3D蛋白质结构分析市场 - 全球及各地区分析:各产品,各终端用户,各地区 - 分析与预测(2022年~2032年)
 全球蛋白质结晶市场:预测(2022-2028)
 X光结晶结构分析的全球市场:2022年~2026年