


 |
市场调查报告书
商品编码
1413836
农业土壤采样和测试市场:按产品、应用和最终用户分類的全球预测 - 2024-2030Agriculture Soil Sampling & Testing Market by Product (Sampling, Soil Testing), Application (Nutrient Management, pH Adjustment, Soil Health Assessment), End-Users - Global Forecast 2024-2030 |
||||||
※ 本网页内容可能与最新版本有所差异。详细情况请与我们联繫。
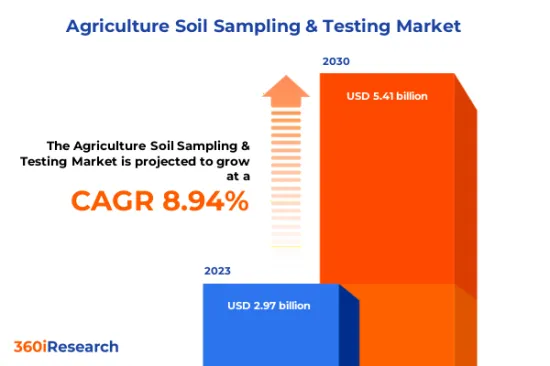
农业土壤采样和测试市场规模预计到2023年为29.7亿美元,2024年达到32.3亿美元,预计到2030年将达到54.1亿美元,复合年增长率为8.94%。
全球农业土壤采样和测试市场
| 主要市场统计 | |
|---|---|
| 基准年[2023] | 29.7亿美元 |
| 预测年份 [2024] | 32.3亿美元 |
| 预测年份 [2030] | 54.1亿美元 |
| 复合年增长率(%) | 8.94% |
农业土壤采样和测试是指从指定农田区域采集土壤样本并分析这些样本以测量各种土壤特性和养分水平的系统过程。此过程可帮助农民、农学家和土地管理者评估土壤肥力,识别潜在的养分缺乏和毒性,并确定要施用的肥料、石灰和其他土壤改良剂的适当类型和数量。它是确定土壤改良剂的重要工具。人们对永续农业实践的认识不断提高,对优质农产品的需求不断增加,正在推动市场的成长。此外,政府促进土壤测试和永续农业的努力也有助于土壤采样和测试解决方案的部署。然而,先进土壤测试方法的高成本限制了土壤采样和测试解决方案的采用。农民缺乏对土壤健康重要性的认知和教育,阻碍了市场的成长。此外,物联网和人工智慧的整合用于即时土壤监测和资料分析以及精密农业技术的进步正在为市场成长创造潜在机会。
区域洞察
美洲地区对永续农业实践的重视正在推动对土壤采样和测试服务的需求。美国农业部 (USDA) 和其他政府机构推出了各种倡议和指南来优化土壤健康和农业生产,这正在影响消费者对先进检测服务的需求。我是。该地区也对新技术的研发进行了投资,推动了土壤分析的创新。精密农业趋势和农业技术新兴企业的成长是促进土壤采样和测试市场成长的其他因素。欧盟国家对土壤管理和保护有严格的规定,需要进行广泛的土壤测试。该地区对有机农业的承诺和防止土地劣化的需求支持了消费者对土壤评估服务的强劲需求。此外,欧盟研究机构积极进行土壤相关研究,并定期向市场推出创新的土壤测试方法。非洲的农业多种多样,从自给农业到商业性农业。随着大片开拓的耕地和现代农业技术意识的不断增强,土壤测试正在成为提高生产力的重要工具。最近的投资和倡议旨在为农民提供更好地管理土壤的知识。亚太地区的特点是农业实践多样化和新技术的快速采用。随着人口的成长,提高作物产量和维持土壤健康的需求驱动了消费者的需求。印度和中国等新兴经济体正在大力投资土壤采样和测试的研究和高科技解决方案,将客户的购买行为转变为创新和综合服务。
FPNV定位矩阵
FPNV定位矩阵对于评估农业土壤采样和测试市场至关重要。我们检视与业务策略和产品满意度相关的关键指标,以对供应商进行全面评估。这种深入的分析使用户能够根据自己的要求做出明智的决策。根据评估,供应商被分为四个成功程度不同的像限:前沿(F)、探路者(P)、利基(N)和重要(V)。
市场占有率分析
市场占有率分析是一种综合工具,可以对农业土壤采样和测试市场中供应商的现状进行深入而深入的研究。全面比较和分析供应商在整体收益、基本客群和其他关键指标方面的贡献,以便更好地了解公司的绩效及其在争夺市场占有率时面临的挑战。此外,该分析还提供了对该行业竞争特征的宝贵考察,包括在研究基准年观察到的累积、分散主导地位和合併特征等因素。这种详细程度的提高使供应商能够做出更明智的决策并制定有效的策略,从而在市场上获得竞争优势。
本报告在以下方面提供了宝贵的见解:
1-市场渗透率:提供有关主要企业所服务的市场的全面资讯。
2-市场开拓:我们深入研究利润丰厚的新兴市场,并分析它们在成熟细分市场中的渗透率。
3- 市场多元化:提供有关新产品发布、开拓地区、最新发展和投资的详细资讯。
4-竞争力评估与资讯:对主要企业的市场占有率、策略、产品、认证、监管状况、专利状况、製造能力等进行全面评估。
5- 产品开发与创新:提供对未来技术、研发活动和突破性产品开发的见解。
本报告解决了以下关键问题:
1-农业土壤采样检测市场的市场规模与预测为何?
2-在农业土壤采样和测试市场的预测期内,有哪些产品、细分市场、应用和领域需要考虑投资?
3-农业土壤采样和检测市场的技术趋势和法律规范是什么?
4-农业土壤采样和测试市场主要供应商的市场占有率是多少?
5-进入农业土壤采样检测市场适当的型态与策略手段有哪些?
目录
第一章 前言
第二章调查方法
第三章执行摘要
第四章市场概况
第五章市场洞察
- 市场动态
- 促进因素
- 提高对永续农业实践的认识
- 环境问题日益严重导致土壤品质恶化
- 政府促进土壤测试和永续农业的倡议
- 抑制因素
- 与土壤采样和测试技术相关的高成本
- 机会
- 整合物联网和人工智慧进行即时土壤监测和资料分析
- 精密农业方法的重要引入
- 任务
- 缺乏标准化、缺乏熟练的专业人员
- 促进因素
- 市场区隔分析
- 产品:土壤测试的持续进步对于理解和纠正微量营养素缺乏至关重要
- 应用:扩大土壤采样和养分管理测试的使用,直接影响作物产量和投入成本效率
- 最终用户:农业实验室越来越多地使用土壤采样和检测套组来执行养分含量和土壤肥力测试。
- 市场趋势分析
- 高通膨的累积效应
- 波特五力分析
- 价值炼和关键路径分析
- 法律规范
第六章 农业土壤采样检测市场:副产品
- 取样
- 网格采样
- 区域抽样
- 土壤测试
第七章 农业土壤采样检测市场:依应用分类
- 营养管理
- pH值调节
- 土壤健康评估
第八章农业土壤采样和测试市场:依最终用户分类
- 农业研究所
- 农民
- 政府
第九章美洲农业土壤采样检测市场
- 阿根廷
- 巴西
- 加拿大
- 墨西哥
- 美国
第十章亚太地区农业土壤采样检测市场
- 澳洲
- 中国
- 印度
- 印尼
- 日本
- 马来西亚
- 菲律宾
- 新加坡
- 韩国
- 台湾
- 泰国
- 越南
第十一章 欧洲、中东和非洲农业土壤采样检测市场
- 丹麦
- 埃及
- 芬兰
- 法国
- 德国
- 以色列
- 义大利
- 荷兰
- 奈及利亚
- 挪威
- 波兰
- 卡达
- 俄罗斯
- 沙乌地阿拉伯
- 南非
- 西班牙
- 瑞典
- 瑞士
- 土耳其
- 阿拉伯聯合大公国
- 英国
第十二章竞争形势
- FPNV定位矩阵
- 市场占有率分析:主要企业
- 主要企业竞争情境分析
- 合约、合作和伙伴关係
- 新产品发布和功能增强
第13章竞争产品组合
- 主要公司简介
- A&L Canada Laboratories Inc.
- Advantech Manufacturing, Inc. by WS Tyler
- Agilent Technologies, Inc.
- AgroCares BV
- Agvise Laboratories
- EIE Instruments Pvt. Ltd.
- Eurofins Scientific SE
- Geotechnical Testing Equipment UK Ltd.
- Gilson Company Inc.
- Humboldt Mfg. Co.
- LaMotte Company
- LogiAg
- Martin Lishman Ltd.
- Matest SpA
- Merck KGaA
- Nanbei Instrument Limited
- PerkinElmer Inc.
- Perry Agricultural Laboratory Inc.
- Precision Laboratories LLC
- Premier Tech Chronos
- Rock River Laboratory Inc.
- Soiltech(PTY)Ltd.
- Symbio Laboratories
- Thermo Fisher Scientific Inc.
- Ward Laboratories Inc.
- 主要产品系列
第十四章附录
- 讨论指南
- 关于许可证和定价
[194 Pages Report] The Agriculture Soil Sampling & Testing Market size was estimated at USD 2.97 billion in 2023 and expected to reach USD 3.23 billion in 2024, at a CAGR 8.94% to reach USD 5.41 billion by 2030.
Global Agriculture Soil Sampling & Testing Market
| KEY MARKET STATISTICS | |
|---|---|
| Base Year [2023] | USD 2.97 billion |
| Estimated Year [2024] | USD 3.23 billion |
| Forecast Year [2030] | USD 5.41 billion |
| CAGR (%) | 8.94% |
Agriculture soil sampling and testing refers to the systematic process of collecting soil samples from a given area of farmland and then analyzing these samples to determine various soil properties and nutrient levels. This process serves as an essential tool for farmers, agronomists, and land managers to assess soil fertility, identify potential deficiencies and toxicities of nutrients, and inform decisions regarding the appropriate type and amount of fertilizers, lime, and other soil amendments to be applied. Increasing awareness of sustainable farming practices and rising demand for high-quality agricultural produce driving the growth of the market. In addition, government initiatives promoting soil testing and sustainable farming contribute to the deployment of soil sampling and testing solutions. However, the high costs associated with advanced soil testing methods limit the adoption of soil sampling and testing solutions. Lack of awareness and education among farmers regarding the importance of soil health creates hindrances to market growth. Furthermore, the integration of IoT and AI for real-time soil monitoring and data analysis and advancements in precision agriculture technologies create potential opportunities for market growth.
Regional Insights
In the American region, there is a significant emphasis on sustainable agricultural practices, which has fueled the demand for soil sampling and testing services. The United States Department of Agriculture (USDA) and other governmental bodies have introduced various initiatives and guidelines to optimize soil health and agricultural output, influencing consumer need for sophisticated testing services. The region has also seen investment in research and development of new technologies, driving innovation in soil analytics. Precision agriculture trends and the growth of ag-tech startups are additional factors contributing to the growth of the soil sampling and testing market. EU countries have stringent regulations for soil management and conservation, which necessitates extensive soil testing. The region's commitment to organic farming and the need to prevent land degradation underpin strong consumer demand for soil assessment services. Furthermore, research institutions in the EU are active in soil-related research, which regularly introduces innovative soil testing methods in the market. Africa's diverse agriculture ranges from subsistence farming to commercial farming. With vast areas of untapped arable land and increasing awareness of modern farming techniques, soil testing is emerging as a key tool for boosting productivity. Recent investments and initiatives are aimed at equipping farmers with the knowledge for better soil management. The Asia Pacific region is characterized by a diverse range of agricultural practices and rapidly adopting new technologies. Consumer needs are driven by the necessity of enhancing crop yield and maintaining soil health in the face of increasing population demands. Emerging economies such as India and China are investing significantly in research and high-tech solutions for soil sampling and testing, shaping customer purchasing behavior towards innovative and integrated services.
FPNV Positioning Matrix
The FPNV Positioning Matrix is pivotal in evaluating the Agriculture Soil Sampling & Testing Market. It offers a comprehensive assessment of vendors, examining key metrics related to Business Strategy and Product Satisfaction. This in-depth analysis empowers users to make well-informed decisions aligned with their requirements. Based on the evaluation, the vendors are then categorized into four distinct quadrants representing varying levels of success: Forefront (F), Pathfinder (P), Niche (N), or Vital (V).
Market Share Analysis
The Market Share Analysis is a comprehensive tool that provides an insightful and in-depth examination of the current state of vendors in the Agriculture Soil Sampling & Testing Market. By meticulously comparing and analyzing vendor contributions in terms of overall revenue, customer base, and other key metrics, we can offer companies a greater understanding of their performance and the challenges they face when competing for market share. Additionally, this analysis provides valuable insights into the competitive nature of the sector, including factors such as accumulation, fragmentation dominance, and amalgamation traits observed over the base year period studied. With this expanded level of detail, vendors can make more informed decisions and devise effective strategies to gain a competitive edge in the market.
Key Company Profiles
The report delves into recent significant developments in the Agriculture Soil Sampling & Testing Market, highlighting leading vendors and their innovative profiles. These include A&L Canada Laboratories Inc., Advantech Manufacturing, Inc. by W.S. Tyler, Agilent Technologies, Inc., AgroCares B.V., Agvise Laboratories, EIE Instruments Pvt. Ltd., Eurofins Scientific SE, Geotechnical Testing Equipment UK Ltd., Gilson Company Inc., Humboldt Mfg. Co., LaMotte Company, LogiAg, Martin Lishman Ltd., Matest S.p.A., Merck KGaA, Nanbei Instrument Limited, PerkinElmer Inc., Perry Agricultural Laboratory Inc., Precision Laboratories LLC, Premier Tech Chronos, Rock River Laboratory Inc., Soiltech (PTY) Ltd., Symbio Laboratories, Thermo Fisher Scientific Inc., and Ward Laboratories Inc..
Market Segmentation & Coverage
This research report categorizes the Agriculture Soil Sampling & Testing Market to forecast the revenues and analyze trends in each of the following sub-markets:
- Product
- Sampling
- Grid Sampling
- Zone Sampling
- Soil Testing
- Sampling
- Application
- Nutrient Management
- pH Adjustment
- Soil Health Assessment
- End-Users
- Agricultural Laboratories
- Farmers
- Government
- Region
- Americas
- Argentina
- Brazil
- Canada
- Mexico
- United States
- California
- Florida
- Illinois
- New York
- Ohio
- Pennsylvania
- Texas
- Asia-Pacific
- Australia
- China
- India
- Indonesia
- Japan
- Malaysia
- Philippines
- Singapore
- South Korea
- Taiwan
- Thailand
- Vietnam
- Europe, Middle East & Africa
- Denmark
- Egypt
- Finland
- France
- Germany
- Israel
- Italy
- Netherlands
- Nigeria
- Norway
- Poland
- Qatar
- Russia
- Saudi Arabia
- South Africa
- Spain
- Sweden
- Switzerland
- Turkey
- United Arab Emirates
- United Kingdom
- Americas
The report offers valuable insights on the following aspects:
1. Market Penetration: It presents comprehensive information on the market provided by key players.
2. Market Development: It delves deep into lucrative emerging markets and analyzes the penetration across mature market segments.
3. Market Diversification: It provides detailed information on new product launches, untapped geographic regions, recent developments, and investments.
4. Competitive Assessment & Intelligence: It conducts an exhaustive assessment of market shares, strategies, products, certifications, regulatory approvals, patent landscape, and manufacturing capabilities of the leading players.
5. Product Development & Innovation: It offers intelligent insights on future technologies, R&D activities, and breakthrough product developments.
The report addresses key questions such as:
1. What is the market size and forecast of the Agriculture Soil Sampling & Testing Market?
2. Which products, segments, applications, and areas should one consider investing in over the forecast period in the Agriculture Soil Sampling & Testing Market?
3. What are the technology trends and regulatory frameworks in the Agriculture Soil Sampling & Testing Market?
4. What is the market share of the leading vendors in the Agriculture Soil Sampling & Testing Market?
5. Which modes and strategic moves are suitable for entering the Agriculture Soil Sampling & Testing Market?
Table of Contents
1. Preface
- 1.1. Objectives of the Study
- 1.2. Market Segmentation & Coverage
- 1.3. Years Considered for the Study
- 1.4. Currency & Pricing
- 1.5. Language
- 1.6. Limitations
- 1.7. Assumptions
- 1.8. Stakeholders
2. Research Methodology
- 2.1. Define: Research Objective
- 2.2. Determine: Research Design
- 2.3. Prepare: Research Instrument
- 2.4. Collect: Data Source
- 2.5. Analyze: Data Interpretation
- 2.6. Formulate: Data Verification
- 2.7. Publish: Research Report
- 2.8. Repeat: Report Update
3. Executive Summary
4. Market Overview
- 4.1. Introduction
- 4.2. Agriculture Soil Sampling & Testing Market, by Region
5. Market Insights
- 5.1. Market Dynamics
- 5.1.1. Drivers
- 5.1.1.1. Increasing awareness of sustainable farming practices
- 5.1.1.2. Rising environmental concerns leading to poor soil quality
- 5.1.1.3. Government initiatives promoting soil testing and sustainable farming
- 5.1.2. Restraints
- 5.1.2.1. High cost associated with soil sampling & testing technologies
- 5.1.3. Opportunities
- 5.1.3.1. Integration of IoT and AI for real-time soil monitoring and data analysis
- 5.1.3.2. Significant adoption of precision agricultural practices
- 5.1.4. Challenges
- 5.1.4.1. Lack of standardization and dearth of skilled professionals
- 5.1.1. Drivers
- 5.2. Market Segmentation Analysis
- 5.2.1. Product: Ongoing advancements in soil testing significant for understanding and correcting micronutrient deficiencies
- 5.2.2. Application: Expanding applications of soil sampling & testing for nutrient management for its direct impact on crop yield and input cost efficiency
- 5.2.3. End-Users: Increasing utilization of soil sampling & testing kits by agricultural laboratories to carry out testing for nutrient content and soil fertility
- 5.3. Market Trend Analysis
- 5.4. Cumulative Impact of High Inflation
- 5.5. Porter's Five Forces Analysis
- 5.5.1. Threat of New Entrants
- 5.5.2. Threat of Substitutes
- 5.5.3. Bargaining Power of Customers
- 5.5.4. Bargaining Power of Suppliers
- 5.5.5. Industry Rivalry
- 5.6. Value Chain & Critical Path Analysis
- 5.7. Regulatory Framework
6. Agriculture Soil Sampling & Testing Market, by Product
- 6.1. Introduction
- 6.2. Sampling
- 6.3.1. Grid Sampling
- 6.3.2. Zone Sampling
- 6.3. Soil Testing
7. Agriculture Soil Sampling & Testing Market, by Application
- 7.1. Introduction
- 7.2. Nutrient Management
- 7.3. pH Adjustment
- 7.4. Soil Health Assessment
8. Agriculture Soil Sampling & Testing Market, by End-Users
- 8.1. Introduction
- 8.2. Agricultural Laboratories
- 8.3. Farmers
- 8.4. Government
9. Americas Agriculture Soil Sampling & Testing Market
- 9.1. Introduction
- 9.2. Argentina
- 9.3. Brazil
- 9.4. Canada
- 9.5. Mexico
- 9.6. United States
10. Asia-Pacific Agriculture Soil Sampling & Testing Market
- 10.1. Introduction
- 10.2. Australia
- 10.3. China
- 10.4. India
- 10.5. Indonesia
- 10.6. Japan
- 10.7. Malaysia
- 10.8. Philippines
- 10.9. Singapore
- 10.10. South Korea
- 10.11. Taiwan
- 10.12. Thailand
- 10.13. Vietnam
11. Europe, Middle East & Africa Agriculture Soil Sampling & Testing Market
- 11.1. Introduction
- 11.2. Denmark
- 11.3. Egypt
- 11.4. Finland
- 11.5. France
- 11.6. Germany
- 11.7. Israel
- 11.8. Italy
- 11.9. Netherlands
- 11.10. Nigeria
- 11.11. Norway
- 11.12. Poland
- 11.13. Qatar
- 11.14. Russia
- 11.15. Saudi Arabia
- 11.16. South Africa
- 11.17. Spain
- 11.18. Sweden
- 11.19. Switzerland
- 11.20. Turkey
- 11.21. United Arab Emirates
- 11.22. United Kingdom
12. Competitive Landscape
- 12.1. FPNV Positioning Matrix
- 12.2. Market Share Analysis, By Key Player
- 12.3. Competitive Scenario Analysis, By Key Player
- 12.3.1. Agreement, Collaboration, & Partnership
- 12.3.1.1. Regrow Ag Announces Partnership with FarmLab to Streamline Soil Sampling for Carbon Projects
- 12.3.1.2. SGS and AgriCircle Collaborate to Provide Joint Soil Health and Regenerative Agriculture Offering
- 12.3.2. New Product Launch & Enhancement
- 12.3.2.1. Martin Lishman Launches New Range of Soil Testing Kits
- 12.3.1. Agreement, Collaboration, & Partnership
13. Competitive Portfolio
- 13.1. Key Company Profiles
- 13.1.1. A&L Canada Laboratories Inc.
- 13.1.2. Advantech Manufacturing, Inc. by W.S. Tyler
- 13.1.3. Agilent Technologies, Inc.
- 13.1.4. AgroCares B.V.
- 13.1.5. Agvise Laboratories
- 13.1.6. EIE Instruments Pvt. Ltd.
- 13.1.7. Eurofins Scientific SE
- 13.1.8. Geotechnical Testing Equipment UK Ltd.
- 13.1.9. Gilson Company Inc.
- 13.1.10. Humboldt Mfg. Co.
- 13.1.11. LaMotte Company
- 13.1.12. LogiAg
- 13.1.13. Martin Lishman Ltd.
- 13.1.14. Matest S.p.A.
- 13.1.15. Merck KGaA
- 13.1.16. Nanbei Instrument Limited
- 13.1.17. PerkinElmer Inc.
- 13.1.18. Perry Agricultural Laboratory Inc.
- 13.1.19. Precision Laboratories LLC
- 13.1.20. Premier Tech Chronos
- 13.1.21. Rock River Laboratory Inc.
- 13.1.22. Soiltech (PTY) Ltd.
- 13.1.23. Symbio Laboratories
- 13.1.24. Thermo Fisher Scientific Inc.
- 13.1.25. Ward Laboratories Inc.
- 13.2. Key Product Portfolio
14. Appendix
- 14.1. Discussion Guide
- 14.2. License & Pricing
LIST OF FIGURES
- FIGURE 1. AGRICULTURE SOIL SAMPLING & TESTING MARKET RESEARCH PROCESS
- FIGURE 2. AGRICULTURE SOIL SAMPLING & TESTING MARKET SIZE, 2023 VS 2030
- FIGURE 3. AGRICULTURE SOIL SAMPLING & TESTING MARKET SIZE, 2018-2030 (USD MILLION)
- FIGURE 4. AGRICULTURE SOIL SAMPLING & TESTING MARKET SIZE, BY REGION, 2023 VS 2030 (%)
- FIGURE 5. AGRICULTURE SOIL SAMPLING & TESTING MARKET SIZE, BY REGION, 2023 VS 2024 VS 2030 (USD MILLION)
- FIGURE 6. AGRICULTURE SOIL SAMPLING & TESTING MARKET DYNAMICS
- FIGURE 7. AGRICULTURE SOIL SAMPLING & TESTING MARKET SIZE, BY PRODUCT, 2023 VS 2030 (%)
- FIGURE 8. AGRICULTURE SOIL SAMPLING & TESTING MARKET SIZE, BY PRODUCT, 2023 VS 2024 VS 2030 (USD MILLION)
- FIGURE 9. AGRICULTURE SOIL SAMPLING & TESTING MARKET SIZE, BY APPLICATION, 2023 VS 2030 (%)
- FIGURE 10. AGRICULTURE SOIL SAMPLING & TESTING MARKET SIZE, BY APPLICATION, 2023 VS 2024 VS 2030 (USD MILLION)
- FIGURE 11. AGRICULTURE SOIL SAMPLING & TESTING MARKET SIZE, BY END-USERS, 2023 VS 2030 (%)
- FIGURE 12. AGRICULTURE SOIL SAMPLING & TESTING MARKET SIZE, BY END-USERS, 2023 VS 2024 VS 2030 (USD MILLION)
- FIGURE 13. AMERICAS AGRICULTURE SOIL SAMPLING & TESTING MARKET SIZE, BY COUNTRY, 2023 VS 2030 (%)
- FIGURE 14. AMERICAS AGRICULTURE SOIL SAMPLING & TESTING MARKET SIZE, BY COUNTRY, 2023 VS 2024 VS 2030 (USD MILLION)
- FIGURE 15. UNITED STATES AGRICULTURE SOIL SAMPLING & TESTING MARKET SIZE, BY STATE, 2023 VS 2030 (%)
- FIGURE 16. UNITED STATES AGRICULTURE SOIL SAMPLING & TESTING MARKET SIZE, BY STATE, 2023 VS 2024 VS 2030 (USD MILLION)
- FIGURE 17. ASIA-PACIFIC AGRICULTURE SOIL SAMPLING & TESTING MARKET SIZE, BY COUNTRY, 2023 VS 2030 (%)
- FIGURE 18. ASIA-PACIFIC AGRICULTURE SOIL SAMPLING & TESTING MARKET SIZE, BY COUNTRY, 2023 VS 2024 VS 2030 (USD MILLION)
- FIGURE 19. EUROPE, MIDDLE EAST & AFRICA AGRICULTURE SOIL SAMPLING & TESTING MARKET SIZE, BY COUNTRY, 2023 VS 2030 (%)
- FIGURE 20. EUROPE, MIDDLE EAST & AFRICA AGRICULTURE SOIL SAMPLING & TESTING MARKET SIZE, BY COUNTRY, 2023 VS 2024 VS 2030 (USD MILLION)
- FIGURE 21. AGRICULTURE SOIL SAMPLING & TESTING MARKET, FPNV POSITIONING MATRIX, 2023
- FIGURE 22. AGRICULTURE SOIL SAMPLING & TESTING MARKET SHARE, BY KEY PLAYER, 2023
LIST OF TABLES
- TABLE 1. AGRICULTURE SOIL SAMPLING & TESTING MARKET SEGMENTATION & COVERAGE
- TABLE 2. UNITED STATES DOLLAR EXCHANGE RATE, 2018-2023
- TABLE 3. AGRICULTURE SOIL SAMPLING & TESTING MARKET SIZE, 2018-2030 (USD MILLION)
- TABLE 4. GLOBAL AGRICULTURE SOIL SAMPLING & TESTING MARKET SIZE, BY REGION, 2018-2030 (USD MILLION)
- TABLE 5. AGRICULTURE SOIL SAMPLING & TESTING MARKET SIZE, BY PRODUCT, 2018-2030 (USD MILLION)
- TABLE 6. AGRICULTURE SOIL SAMPLING & TESTING MARKET SIZE, BY SAMPLING, BY REGION, 2018-2030 (USD MILLION)
- TABLE 7. AGRICULTURE SOIL SAMPLING & TESTING MARKET SIZE, BY SAMPLING, 2018-2030 (USD MILLION)
- TABLE 8. AGRICULTURE SOIL SAMPLING & TESTING MARKET SIZE, BY GRID SAMPLING, BY REGION, 2018-2030 (USD MILLION)
- TABLE 9. AGRICULTURE SOIL SAMPLING & TESTING MARKET SIZE, BY ZONE SAMPLING, BY REGION, 2018-2030 (USD MILLION)
- TABLE 10. AGRICULTURE SOIL SAMPLING & TESTING MARKET SIZE, BY SOIL TESTING, BY REGION, 2018-2030 (USD MILLION)
- TABLE 11. AGRICULTURE SOIL SAMPLING & TESTING MARKET SIZE, BY APPLICATION, 2018-2030 (USD MILLION)
- TABLE 12. AGRICULTURE SOIL SAMPLING & TESTING MARKET SIZE, BY NUTRIENT MANAGEMENT, BY REGION, 2018-2030 (USD MILLION)
- TABLE 13. AGRICULTURE SOIL SAMPLING & TESTING MARKET SIZE, BY PH ADJUSTMENT, BY REGION, 2018-2030 (USD MILLION)
- TABLE 14. AGRICULTURE SOIL SAMPLING & TESTING MARKET SIZE, BY SOIL HEALTH ASSESSMENT, BY REGION, 2018-2030 (USD MILLION)
- TABLE 15. AGRICULTURE SOIL SAMPLING & TESTING MARKET SIZE, BY END-USERS, 2018-2030 (USD MILLION)
- TABLE 16. AGRICULTURE SOIL SAMPLING & TESTING MARKET SIZE, BY AGRICULTURAL LABORATORIES, BY REGION, 2018-2030 (USD MILLION)
- TABLE 17. AGRICULTURE SOIL SAMPLING & TESTING MARKET SIZE, BY FARMERS, BY REGION, 2018-2030 (USD MILLION)
- TABLE 18. AGRICULTURE SOIL SAMPLING & TESTING MARKET SIZE, BY GOVERNMENT, BY REGION, 2018-2030 (USD MILLION)
- TABLE 19. AMERICAS AGRICULTURE SOIL SAMPLING & TESTING MARKET SIZE, BY PRODUCT, 2018-2030 (USD MILLION)
- TABLE 20. AMERICAS AGRICULTURE SOIL SAMPLING & TESTING MARKET SIZE, BY SAMPLING, 2018-2030 (USD MILLION)
- TABLE 21. AMERICAS AGRICULTURE SOIL SAMPLING & TESTING MARKET SIZE, BY APPLICATION, 2018-2030 (USD MILLION)
- TABLE 22. AMERICAS AGRICULTURE SOIL SAMPLING & TESTING MARKET SIZE, BY END-USERS, 2018-2030 (USD MILLION)
- TABLE 23. AMERICAS AGRICULTURE SOIL SAMPLING & TESTING MARKET SIZE, BY COUNTRY, 2018-2030 (USD MILLION)
- TABLE 24. ARGENTINA AGRICULTURE SOIL SAMPLING & TESTING MARKET SIZE, BY PRODUCT, 2018-2030 (USD MILLION)
- TABLE 25. ARGENTINA AGRICULTURE SOIL SAMPLING & TESTING MARKET SIZE, BY SAMPLING, 2018-2030 (USD MILLION)
- TABLE 26. ARGENTINA AGRICULTURE SOIL SAMPLING & TESTING MARKET SIZE, BY APPLICATION, 2018-2030 (USD MILLION)
- TABLE 27. ARGENTINA AGRICULTURE SOIL SAMPLING & TESTING MARKET SIZE, BY END-USERS, 2018-2030 (USD MILLION)
- TABLE 28. BRAZIL AGRICULTURE SOIL SAMPLING & TESTING MARKET SIZE, BY PRODUCT, 2018-2030 (USD MILLION)
- TABLE 29. BRAZIL AGRICULTURE SOIL SAMPLING & TESTING MARKET SIZE, BY SAMPLING, 2018-2030 (USD MILLION)
- TABLE 30. BRAZIL AGRICULTURE SOIL SAMPLING & TESTING MARKET SIZE, BY APPLICATION, 2018-2030 (USD MILLION)
- TABLE 31. BRAZIL AGRICULTURE SOIL SAMPLING & TESTING MARKET SIZE, BY END-USERS, 2018-2030 (USD MILLION)
- TABLE 32. CANADA AGRICULTURE SOIL SAMPLING & TESTING MARKET SIZE, BY PRODUCT, 2018-2030 (USD MILLION)
- TABLE 33. CANADA AGRICULTURE SOIL SAMPLING & TESTING MARKET SIZE, BY SAMPLING, 2018-2030 (USD MILLION)
- TABLE 34. CANADA AGRICULTURE SOIL SAMPLING & TESTING MARKET SIZE, BY APPLICATION, 2018-2030 (USD MILLION)
- TABLE 35. CANADA AGRICULTURE SOIL SAMPLING & TESTING MARKET SIZE, BY END-USERS, 2018-2030 (USD MILLION)
- TABLE 36. MEXICO AGRICULTURE SOIL SAMPLING & TESTING MARKET SIZE, BY PRODUCT, 2018-2030 (USD MILLION)
- TABLE 37. MEXICO AGRICULTURE SOIL SAMPLING & TESTING MARKET SIZE, BY SAMPLING, 2018-2030 (USD MILLION)
- TABLE 38. MEXICO AGRICULTURE SOIL SAMPLING & TESTING MARKET SIZE, BY APPLICATION, 2018-2030 (USD MILLION)
- TABLE 39. MEXICO AGRICULTURE SOIL SAMPLING & TESTING MARKET SIZE, BY END-USERS, 2018-2030 (USD MILLION)
- TABLE 40. UNITED STATES AGRICULTURE SOIL SAMPLING & TESTING MARKET SIZE, BY PRODUCT, 2018-2030 (USD MILLION)
- TABLE 41. UNITED STATES AGRICULTURE SOIL SAMPLING & TESTING MARKET SIZE, BY SAMPLING, 2018-2030 (USD MILLION)
- TABLE 42. UNITED STATES AGRICULTURE SOIL SAMPLING & TESTING MARKET SIZE, BY APPLICATION, 2018-2030 (USD MILLION)
- TABLE 43. UNITED STATES AGRICULTURE SOIL SAMPLING & TESTING MARKET SIZE, BY END-USERS, 2018-2030 (USD MILLION)
- TABLE 44. UNITED STATES AGRICULTURE SOIL SAMPLING & TESTING MARKET SIZE, BY STATE, 2018-2030 (USD MILLION)
- TABLE 45. ASIA-PACIFIC AGRICULTURE SOIL SAMPLING & TESTING MARKET SIZE, BY PRODUCT, 2018-2030 (USD MILLION)
- TABLE 46. ASIA-PACIFIC AGRICULTURE SOIL SAMPLING & TESTING MARKET SIZE, BY SAMPLING, 2018-2030 (USD MILLION)
- TABLE 47. ASIA-PACIFIC AGRICULTURE SOIL SAMPLING & TESTING MARKET SIZE, BY APPLICATION, 2018-2030 (USD MILLION)
- TABLE 48. ASIA-PACIFIC AGRICULTURE SOIL SAMPLING & TESTING MARKET SIZE, BY END-USERS, 2018-2030 (USD MILLION)
- TABLE 49. ASIA-PACIFIC AGRICULTURE SOIL SAMPLING & TESTING MARKET SIZE, BY COUNTRY, 2018-2030 (USD MILLION)
- TABLE 50. AUSTRALIA AGRICULTURE SOIL SAMPLING & TESTING MARKET SIZE, BY PRODUCT, 2018-2030 (USD MILLION)
- TABLE 51. AUSTRALIA AGRICULTURE SOIL SAMPLING & TESTING MARKET SIZE, BY SAMPLING, 2018-2030 (USD MILLION)
- TABLE 52. AUSTRALIA AGRICULTURE SOIL SAMPLING & TESTING MARKET SIZE, BY APPLICATION, 2018-2030 (USD MILLION)
- TABLE 53. AUSTRALIA AGRICULTURE SOIL SAMPLING & TESTING MARKET SIZE, BY END-USERS, 2018-2030 (USD MILLION)
- TABLE 54. CHINA AGRICULTURE SOIL SAMPLING & TESTING MARKET SIZE, BY PRODUCT, 2018-2030 (USD MILLION)
- TABLE 55. CHINA AGRICULTURE SOIL SAMPLING & TESTING MARKET SIZE, BY SAMPLING, 2018-2030 (USD MILLION)
- TABLE 56. CHINA AGRICULTURE SOIL SAMPLING & TESTING MARKET SIZE, BY APPLICATION, 2018-2030 (USD MILLION)
- TABLE 57. CHINA AGRICULTURE SOIL SAMPLING & TESTING MARKET SIZE, BY END-USERS, 2018-2030 (USD MILLION)
- TABLE 58. INDIA AGRICULTURE SOIL SAMPLING & TESTING MARKET SIZE, BY PRODUCT, 2018-2030 (USD MILLION)
- TABLE 59. INDIA AGRICULTURE SOIL SAMPLING & TESTING MARKET SIZE, BY SAMPLING, 2018-2030 (USD MILLION)
- TABLE 60. INDIA AGRICULTURE SOIL SAMPLING & TESTING MARKET SIZE, BY APPLICATION, 2018-2030 (USD MILLION)
- TABLE 61. INDIA AGRICULTURE SOIL SAMPLING & TESTING MARKET SIZE, BY END-USERS, 2018-2030 (USD MILLION)
- TABLE 62. INDONESIA AGRICULTURE SOIL SAMPLING & TESTING MARKET SIZE, BY PRODUCT, 2018-2030 (USD MILLION)
- TABLE 63. INDONESIA AGRICULTURE SOIL SAMPLING & TESTING MARKET SIZE, BY SAMPLING, 2018-2030 (USD MILLION)
- TABLE 64. INDONESIA AGRICULTURE SOIL SAMPLING & TESTING MARKET SIZE, BY APPLICATION, 2018-2030 (USD MILLION)
- TABLE 65. INDONESIA AGRICULTURE SOIL SAMPLING & TESTING MARKET SIZE, BY END-USERS, 2018-2030 (USD MILLION)
- TABLE 66. JAPAN AGRICULTURE SOIL SAMPLING & TESTING MARKET SIZE, BY PRODUCT, 2018-2030 (USD MILLION)
- TABLE 67. JAPAN AGRICULTURE SOIL SAMPLING & TESTING MARKET SIZE, BY SAMPLING, 2018-2030 (USD MILLION)
- TABLE 68. JAPAN AGRICULTURE SOIL SAMPLING & TESTING MARKET SIZE, BY APPLICATION, 2018-2030 (USD MILLION)
- TABLE 69. JAPAN AGRICULTURE SOIL SAMPLING & TESTING MARKET SIZE, BY END-USERS, 2018-2030 (USD MILLION)
- TABLE 70. MALAYSIA AGRICULTURE SOIL SAMPLING & TESTING MARKET SIZE, BY PRODUCT, 2018-2030 (USD MILLION)
- TABLE 71. MALAYSIA AGRICULTURE SOIL SAMPLING & TESTING MARKET SIZE, BY SAMPLING, 2018-2030 (USD MILLION)
- TABLE 72. MALAYSIA AGRICULTURE SOIL SAMPLING & TESTING MARKET SIZE, BY APPLICATION, 2018-2030 (USD MILLION)
- TABLE 73. MALAYSIA AGRICULTURE SOIL SAMPLING & TESTING MARKET SIZE, BY END-USERS, 2018-2030 (USD MILLION)
- TABLE 74. PHILIPPINES AGRICULTURE SOIL SAMPLING & TESTING MARKET SIZE, BY PRODUCT, 2018-2030 (USD MILLION)
- TABLE 75. PHILIPPINES AGRICULTURE SOIL SAMPLING & TESTING MARKET SIZE, BY SAMPLING, 2018-2030 (USD MILLION)
- TABLE 76. PHILIPPINES AGRICULTURE SOIL SAMPLING & TESTING MARKET SIZE, BY APPLICATION, 2018-2030 (USD MILLION)
- TABLE 77. PHILIPPINES AGRICULTURE SOIL SAMPLING & TESTING MARKET SIZE, BY END-USERS, 2018-2030 (USD MILLION)
- TABLE 78. SINGAPORE AGRICULTURE SOIL SAMPLING & TESTING MARKET SIZE, BY PRODUCT, 2018-2030 (USD MILLION)
- TABLE 79. SINGAPORE AGRICULTURE SOIL SAMPLING & TESTING MARKET SIZE, BY SAMPLING, 2018-2030 (USD MILLION)
- TABLE 80. SINGAPORE AGRICULTURE SOIL SAMPLING & TESTING MARKET SIZE, BY APPLICATION, 2018-2030 (USD MILLION)
- TABLE 81. SINGAPORE AGRICULTURE SOIL SAMPLING & TESTING MARKET SIZE, BY END-USERS, 2018-2030 (USD MILLION)
- TABLE 82. SOUTH KOREA AGRICULTURE SOIL SAMPLING & TESTING MARKET SIZE, BY PRODUCT, 2018-2030 (USD MILLION)
- TABLE 83. SOUTH KOREA AGRICULTURE SOIL SAMPLING & TESTING MARKET SIZE, BY SAMPLING, 2018-2030 (USD MILLION)
- TABLE 84. SOUTH KOREA AGRICULTURE SOIL SAMPLING & TESTING MARKET SIZE, BY APPLICATION, 2018-2030 (USD MILLION)
- TABLE 85. SOUTH KOREA AGRICULTURE SOIL SAMPLING & TESTING MARKET SIZE, BY END-USERS, 2018-2030 (USD MILLION)
- TABLE 86. TAIWAN AGRICULTURE SOIL SAMPLING & TESTING MARKET SIZE, BY PRODUCT, 2018-2030 (USD MILLION)
- TABLE 87. TAIWAN AGRICULTURE SOIL SAMPLING & TESTING MARKET SIZE, BY SAMPLING, 2018-2030 (USD MILLION)
- TABLE 88. TAIWAN AGRICULTURE SOIL SAMPLING & TESTING MARKET SIZE, BY APPLICATION, 2018-2030 (USD MILLION)
- TABLE 89. TAIWAN AGRICULTURE SOIL SAMPLING & TESTING MARKET SIZE, BY END-USERS, 2018-2030 (USD MILLION)
- TABLE 90. THAILAND AGRICULTURE SOIL SAMPLING & TESTING MARKET SIZE, BY PRODUCT, 2018-2030 (USD MILLION)
- TABLE 91. THAILAND AGRICULTURE SOIL SAMPLING & TESTING MARKET SIZE, BY SAMPLING, 2018-2030 (USD MILLION)
- TABLE 92. THAILAND AGRICULTURE SOIL SAMPLING & TESTING MARKET SIZE, BY APPLICATION, 2018-2030 (USD MILLION)
- TABLE 93. THAILAND AGRICULTURE SOIL SAMPLING & TESTING MARKET SIZE, BY END-USERS, 2018-2030 (USD MILLION)
- TABLE 94. VIETNAM AGRICULTURE SOIL SAMPLING & TESTING MARKET SIZE, BY PRODUCT, 2018-2030 (USD MILLION)
- TABLE 95. VIETNAM AGRICULTURE SOIL SAMPLING & TESTING MARKET SIZE, BY SAMPLING, 2018-2030 (USD MILLION)
- TABLE 96. VIETNAM AGRICULTURE SOIL SAMPLING & TESTING MARKET SIZE, BY APPLICATION, 2018-2030 (USD MILLION)
- TABLE 97. VIETNAM AGRICULTURE SOIL SAMPLING & TESTING MARKET SIZE, BY END-USERS, 2018-2030 (USD MILLION)
- TABLE 98. EUROPE, MIDDLE EAST & AFRICA AGRICULTURE SOIL SAMPLING & TESTING MARKET SIZE, BY PRODUCT, 2018-2030 (USD MILLION)
- TABLE 99. EUROPE, MIDDLE EAST & AFRICA AGRICULTURE SOIL SAMPLING & TESTING MARKET SIZE, BY SAMPLING, 2018-2030 (USD MILLION)
- TABLE 100. EUROPE, MIDDLE EAST & AFRICA AGRICULTURE SOIL SAMPLING & TESTING MARKET SIZE, BY APPLICATION, 2018-2030 (USD MILLION)
- TABLE 101. EUROPE, MIDDLE EAST & AFRICA AGRICULTURE SOIL SAMPLING & TESTING MARKET SIZE, BY END-USERS, 2018-2030 (USD MILLION)
- TABLE 102. EUROPE, MIDDLE EAST & AFRICA AGRICULTURE SOIL SAMPLING & TESTING MARKET SIZE, BY COUNTRY, 2018-2030 (USD MILLION)
- TABLE 103. DENMARK AGRICULTURE SOIL SAMPLING & TESTING MARKET SIZE, BY PRODUCT, 2018-2030 (USD MILLION)
- TABLE 104. DENMARK AGRICULTURE SOIL SAMPLING & TESTING MARKET SIZE, BY SAMPLING, 2018-2030 (USD MILLION)
- TABLE 105. DENMARK AGRICULTURE SOIL SAMPLING & TESTING MARKET SIZE, BY APPLICATION, 2018-2030 (USD MILLION)
- TABLE 106. DENMARK AGRICULTURE SOIL SAMPLING & TESTING MARKET SIZE, BY END-USERS, 2018-2030 (USD MILLION)
- TABLE 107. EGYPT AGRICULTURE SOIL SAMPLING & TESTING MARKET SIZE, BY PRODUCT, 2018-2030 (USD MILLION)
- TABLE 108. EGYPT AGRICULTURE SOIL SAMPLING & TESTING MARKET SIZE, BY SAMPLING, 2018-2030 (USD MILLION)
- TABLE 109. EGYPT AGRICULTURE SOIL SAMPLING & TESTING MARKET SIZE, BY APPLICATION, 2018-2030 (USD MILLION)
- TABLE 110. EGYPT AGRICULTURE SOIL SAMPLING & TESTING MARKET SIZE, BY END-USERS, 2018-2030 (USD MILLION)
- TABLE 111. FINLAND AGRICULTURE SOIL SAMPLING & TESTING MARKET SIZE, BY PRODUCT, 2018-2030 (USD MILLION)
- TABLE 112. FINLAND AGRICULTURE SOIL SAMPLING & TESTING MARKET SIZE, BY SAMPLING, 2018-2030 (USD MILLION)
- TABLE 113. FINLAND AGRICULTURE SOIL SAMPLING & TESTING MARKET SIZE, BY APPLICATION, 2018-2030 (USD MILLION)
- TABLE 114. FINLAND AGRICULTURE SOIL SAMPLING & TESTING MARKET SIZE, BY END-USERS, 2018-2030 (USD MILLION)
- TABLE 115. FRANCE AGRICULTURE SOIL SAMPLING & TESTING MARKET SIZE, BY PRODUCT, 2018-2030 (USD MILLION)
- TABLE 116. FRANCE AGRICULTURE SOIL SAMPLING & TESTING MARKET SIZE, BY SAMPLING, 2018-2030 (USD MILLION)
- TABLE 117. FRANCE AGRICULTURE SOIL SAMPLING & TESTING MARKET SIZE, BY APPLICATION, 2018-2030 (USD MILLION)
- TABLE 118. FRANCE AGRICULTURE SOIL SAMPLING & TESTING MARKET SIZE, BY END-USERS, 2018-2030 (USD MILLION)
- TABLE 119. GERMANY AGRICULTURE SOIL SAMPLING & TESTING MARKET SIZE, BY PRODUCT, 2018-2030 (USD MILLION)
- TABLE 120. GERMANY AGRICULTURE SOIL SAMPLING & TESTING MARKET SIZE, BY SAMPLING, 2018-2030 (USD MILLION)
- TABLE 121. GERMANY AGRICULTURE SOIL SAMPLING & TESTING MARKET SIZE, BY APPLICATION, 2018-2030 (USD MILLION)
- TABLE 122. GERMANY AGRICULTURE SOIL SAMPLING & TESTING MARKET SIZE, BY END-USERS, 2018-2030 (USD MILLION)
- TABLE 123. ISRAEL AGRICULTURE SOIL SAMPLING & TESTING MARKET SIZE, BY PRODUCT, 2018-2030 (USD MILLION)
- TABLE 124. ISRAEL AGRICULTURE SOIL SAMPLING & TESTING MARKET SIZE, BY SAMPLING, 2018-2030 (USD MILLION)
- TABLE 125. ISRAEL AGRICULTURE SOIL SAMPLING & TESTING MARKET SIZE, BY APPLICATION, 2018-2030 (USD MILLION)
- TABLE 126. ISRAEL AGRICULTURE SOIL SAMPLING & TESTING MARKET SIZE, BY END-USERS, 2018-2030 (USD MILLION)
- TABLE 127. ITALY AGRICULTURE SOIL SAMPLING & TESTING MARKET SIZE, BY PRODUCT, 2018-2030 (USD MILLION)
- TABLE 128. ITALY AGRICULTURE SOIL SAMPLING & TESTING MARKET SIZE, BY SAMPLING, 2018-2030 (USD MILLION)
- TABLE 129. ITALY AGRICULTURE SOIL SAMPLING & TESTING MARKET SIZE, BY APPLICATION, 2018-2030 (USD MILLION)
- TABLE 130. ITALY AGRICULTURE SOIL SAMPLING & TESTING MARKET SIZE, BY END-USERS, 2018-2030 (USD MILLION)
- TABLE 131. NETHERLANDS AGRICULTURE SOIL SAMPLING & TESTING MARKET SIZE, BY PRODUCT, 2018-2030 (USD MILLION)
- TABLE 132. NETHERLANDS AGRICULTURE SOIL SAMPLING & TESTING MARKET SIZE, BY SAMPLING, 2018-2030 (USD MILLION)
- TABLE 133. NETHERLANDS AGRICULTURE SOIL SAMPLING & TESTING MARKET SIZE, BY APPLICATION, 2018-2030 (USD MILLION)
- TABLE 134. NETHERLANDS AGRICULTURE SOIL SAMPLING & TESTING MARKET SIZE, BY END-USERS, 2018-2030 (USD MILLION)
- TABLE 135. NIGERIA AGRICULTURE SOIL SAMPLING & TESTING MARKET SIZE, BY PRODUCT, 2018-2030 (USD MILLION)
- TABLE 136. NIGERIA AGRICULTURE SOIL SAMPLING & TESTING MARKET SIZE, BY SAMPLING, 2018-2030 (USD MILLION)
- TABLE 137. NIGERIA AGRICULTURE SOIL SAMPLING & TESTING MARKET SIZE, BY APPLICATION, 2018-2030 (USD MILLION)
- TABLE 138. NIGERIA AGRICULTURE SOIL SAMPLING & TESTING MARKET SIZE, BY END-USERS, 2018-2030 (USD MILLION)
- TABLE 139. NORWAY AGRICULTURE SOIL SAMPLING & TESTING MARKET SIZE, BY PRODUCT, 2018-2030 (USD MILLION)
- TABLE 140. NORWAY AGRICULTURE SOIL SAMPLING & TESTING MARKET SIZE, BY SAMPLING, 2018-2030 (USD MILLION)
- TABLE 141. NORWAY AGRICULTURE SOIL SAMPLING & TESTING MARKET SIZE, BY APPLICATION, 2018-2030 (USD MILLION)
- TABLE 142. NORWAY AGRICULTURE SOIL SAMPLING & TESTING MARKET SIZE, BY END-USERS, 2018-2030 (USD MILLION)
- TABLE 143. POLAND AGRICULTURE SOIL SAMPLING & TESTING MARKET SIZE, BY PRODUCT, 2018-2030 (USD MILLION)
- TABLE 144. POLAND AGRICULTURE SOIL SAMPLING & TESTING MARKET SIZE, BY SAMPLING, 2018-2030 (USD MILLION)
- TABLE 145. POLAND AGRICULTURE SOIL SAMPLING & TESTING MARKET SIZE, BY APPLICATION, 2018-2030 (USD MILLION)
- TABLE 146. POLAND AGRICULTURE SOIL SAMPLING & TESTING MARKET SIZE, BY END-USERS, 2018-2030 (USD MILLION)
- TABLE 147. QATAR AGRICULTURE SOIL SAMPLING & TESTING MARKET SIZE, BY PRODUCT, 2018-2030 (USD MILLION)
- TABLE 148. QATAR AGRICULTURE SOIL SAMPLING & TESTING MARKET SIZE, BY SAMPLING, 2018-2030 (USD MILLION)
- TABLE 149. QATAR AGRICULTURE SOIL SAMPLING & TESTING MARKET SIZE, BY APPLICATION, 2018-2030 (USD MILLION)
- TABLE 150. QATAR AGRICULTURE SOIL SAMPLING & TESTING MARKET SIZE, BY END-USERS, 2018-2030 (USD MILLION)
- TABLE 151. RUSSIA AGRICULTURE SOIL SAMPLING & TESTING MARKET SIZE, BY PRODUCT, 2018-2030 (USD MILLION)
- TABLE 152. RUSSIA AGRICULTURE SOIL SAMPLING & TESTING MARKET SIZE, BY SAMPLING, 2018-2030 (USD MILLION)
- TABLE 153. RUSSIA AGRICULTURE SOIL SAMPLING & TESTING MARKET SIZE, BY APPLICATION, 2018-2030 (USD MILLION)
- TABLE 154. RUSSIA AGRICULTURE SOIL SAMPLING & TESTING MARKET SIZE, BY END-USERS, 2018-2030 (USD MILLION)
- TABLE 155. SAUDI ARABIA AGRICULTURE SOIL SAMPLING & TESTING MARKET SIZE, BY PRODUCT, 2018-2030 (USD MILLION)
- TABLE 156. SAUDI ARABIA AGRICULTURE SOIL SAMPLING & TESTING MARKET SIZE, BY SAMPLING, 2018-2030 (USD MILLION)
- TABLE 157. SAUDI ARABIA AGRICULTURE SOIL SAMPLING & TESTING MARKET SIZE, BY APPLICATION, 2018-2030 (USD MILLION)
- TABLE 158. SAUDI ARABIA AGRICULTURE SOIL SAMPLING & TESTING MARKET SIZE, BY END-USERS, 2018-2030 (USD MILLION)
- TABLE 159. SOUTH AFRICA AGRICULTURE SOIL SAMPLING & TESTING MARKET SIZE, BY PRODUCT, 2018-2030 (USD MILLION)
- TABLE 160. SOUTH AFRICA AGRICULTURE SOIL SAMPLING & TESTING MARKET SIZE, BY SAMPLING, 2018-2030 (USD MILLION)
- TABLE 161. SOUTH AFRICA AGRICULTURE SOIL SAMPLING & TESTING MARKET SIZE, BY APPLICATION, 2018-2030 (USD MILLION)
- TABLE 162. SOUTH AFRICA AGRICULTURE SOIL SAMPLING & TESTING MARKET SIZE, BY END-USERS, 2018-2030 (USD MILLION)
- TABLE 163. SPAIN AGRICULTURE SOIL SAMPLING & TESTING MARKET SIZE, BY PRODUCT, 2018-2030 (USD MILLION)
- TABLE 164. SPAIN AGRICULTURE SOIL SAMPLING & TESTING MARKET SIZE, BY SAMPLING, 2018-2030 (USD MILLION)
- TABLE 165. SPAIN AGRICULTURE SOIL SAMPLING & TESTING MARKET SIZE, BY APPLICATION, 2018-2030 (USD MILLION)
- TABLE 166. SPAIN AGRICULTURE SOIL SAMPLING & TESTING MARKET SIZE, BY END-USERS, 2018-2030 (USD MILLION)
- TABLE 167. SWEDEN AGRICULTURE SOIL SAMPLING & TESTING MARKET SIZE, BY PRODUCT, 2018-2030 (USD MILLION)
- TABLE 168. SWEDEN AGRICULTURE SOIL SAMPLING & TESTING MARKET SIZE, BY SAMPLING, 2018-2030 (USD MILLION)
- TABLE 169. SWEDEN AGRICULTURE SOIL SAMPLING & TESTING MARKET SIZE, BY APPLICATION, 2018-2030 (USD MILLION)
- TABLE 170. SWEDEN AGRICULTURE SOIL SAMPLING & TESTING MARKET SIZE, BY END-USERS, 2018-2030 (USD MILLION)
- TABLE 171. SWITZERLAND AGRICULTURE SOIL SAMPLING & TESTING MARKET SIZE, BY PRODUCT, 2018-2030 (USD MILLION)
- TABLE 172. SWITZERLAND AGRICULTURE SOIL SAMPLING & TESTING MARKET SIZE, BY SAMPLING, 2018-2030 (USD MILLION)
- TABLE 173. SWITZERLAND AGRICULTURE SOIL SAMPLING & TESTING MARKET SIZE, BY APPLICATION, 2018-2030 (USD MILLION)
- TABLE 174. SWITZERLAND AGRICULTURE SOIL SAMPLING & TESTING MARKET SIZE, BY END-USERS, 2018-2030 (USD MILLION)
- TABLE 175. TURKEY AGRICULTURE SOIL SAMPLING & TESTING MARKET SIZE, BY PRODUCT, 2018-2030 (USD MILLION)
- TABLE 176. TURKEY AGRICULTURE SOIL SAMPLING & TESTING MARKET SIZE, BY SAMPLING, 2018-2030 (USD MILLION)
- TABLE 177. TURKEY AGRICULTURE SOIL SAMPLING & TESTING MARKET SIZE, BY APPLICATION, 2018-2030 (USD MILLION)
- TABLE 178. TURKEY AGRICULTURE SOIL SAMPLING & TESTING MARKET SIZE, BY END-USERS, 2018-2030 (USD MILLION)
- TABLE 179. UNITED ARAB EMIRATES AGRICULTURE SOIL SAMPLING & TESTING MARKET SIZE, BY PRODUCT, 2018-2030 (USD MILLION)
- TABLE 180. UNITED ARAB EMIRATES AGRICULTURE SOIL SAMPLING & TESTING MARKET SIZE, BY SAMPLING, 2018-2030 (USD MILLION)
- TABLE 181. UNITED ARAB EMIRATES AGRICULTURE SOIL SAMPLING & TESTING MARKET SIZE, BY APPLICATION, 2018-2030 (USD MILLION)
- TABLE 182. UNITED ARAB EMIRATES AGRICULTURE SOIL SAMPLING & TESTING MARKET SIZE, BY END-USERS, 2018-2030 (USD MILLION)
- TABLE 183. UNITED KINGDOM AGRICULTURE SOIL SAMPLING & TESTING MARKET SIZE, BY PRODUCT, 2018-2030 (USD MILLION)
- TABLE 184. UNITED KINGDOM AGRICULTURE SOIL SAMPLING & TESTING MARKET SIZE, BY SAMPLING, 2018-2030 (USD MILLION)
- TABLE 185. UNITED KINGDOM AGRICULTURE SOIL SAMPLING & TESTING MARKET SIZE, BY APPLICATION, 2018-2030 (USD MILLION)
- TABLE 186. UNITED KINGDOM AGRICULTURE SOIL SAMPLING & TESTING MARKET SIZE, BY END-USERS, 2018-2030 (USD MILLION)
- TABLE 187. AGRICULTURE SOIL SAMPLING & TESTING MARKET, FPNV POSITIONING MATRIX, 2023
- TABLE 188. AGRICULTURE SOIL SAMPLING & TESTING MARKET SHARE, BY KEY PLAYER, 2023
- TABLE 189. AGRICULTURE SOIL SAMPLING & TESTING MARKET LICENSE & PRICING
 2024年土壤测试设备全球市场报告
 土壤测试设备市场 - 按类型(化学、物理、残留)、按地点(现场、实验室)、按自动化程度(手动、半自动、自动)、按最终用户行业(农业、建筑业)、 2024 - 2032 年预测
 到 2030 年 L 形盒灯具市场预测:按类型、应用、最终用户和地区进行全球分析
 农业土壤采样和测试市场 - 全球和区域分析:按用途、按产品、按地区 - 分析和预测(2023-2028)
 2023-2027年土壤检查装置全球市场
 土壤测试设备市场:按测试类型、自动化程度、最终用户产业、地点划分 - 2023-2030 年全球预测
 土质实验机的全球市场
 土壤流出测试的全球市场-2022-2029
 土壤实验设备的全球市场:各类型,各场所,各自动化的程度,各最终用途产业,各地区,竞争预测,机会(2017年~2027年)