


 |
市场调查报告书
商品编码
1413864
汽车触控感知器市场:按车型、应用、分布划分 - 2024-2030 年全球预测Automotive Touch Sensor Market by Vehicle Type (Commercial Vehicle Touch Sensor, Passenger Vehicle Touch Sensor), Application (Climate & Control Panels, Driver-Assistance Systems, Gesture Recognition), Distribution - Global Forecast 2024-2030 |
||||||
※ 本网页内容可能与最新版本有所差异。详细情况请与我们联繫。
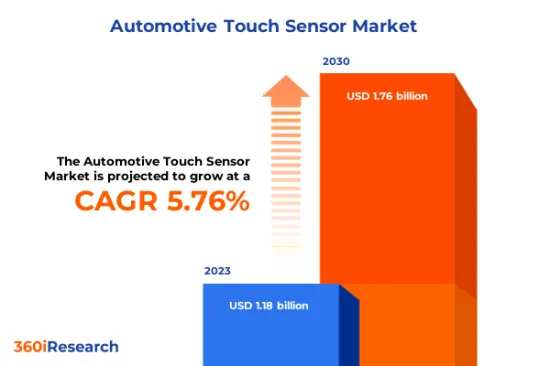
预计2023年汽车触控感测器市场规模为11.8亿美元,2024年将达到12.5亿美元,2030年预计将达到17.6亿美元,复合年增长率为5.76%。
汽车触摸感测器的全球市场
| 主要市场统计 | |
|---|---|
| 基准年[2023] | 11.8亿美元 |
| 预测年份 [2024] | 12.5亿美元 |
| 预测年份 [2030] | 17.6亿美元 |
| 复合年增长率(%) | 5.76% |
汽车触控感测器是一种检测和测量汽车内各种表面上的触控输入的装置。这些输入可以包括驾驶人或乘客的触摸,并且通常在资讯娱乐系统萤幕、控制面板甚至门把手等表面上进行。这些感测器背后的技术通常依赖电容式触摸,当手指接近或触摸表面时,感测器会检测到电容的变化。该技术支援互动系统的设计,透过提供导航、娱乐和气候控制设定等功能的直觉控制来改善使用者体验。随着汽车产业转向联网汽车和自动驾驶汽车,可靠且响应灵敏的触控感测器变得越来越重要。此外,汽车触控感测器市场的成长主要是由于对车辆先进用户介面的需求不断增长、触控感测器功能的技术创新以及配备最新主机系统的电动和混合动力汽车的日益普及等因素推动的。汽车触控感测器功能的技术创新以及配备最新控制台系统的电动和混合动力汽车的日益普及等因素推动的。汽车触控感测器功能的采用正在增加。然而,将触控感测器无缝整合到汽车系统中的高生产成本和复杂性给市场成长带来了挑战。此外,车辆介面设计的进步和实体按钮的消失正在阻碍触控感测器技术的标准化。然而,自动驾驶汽车的兴起以及对先进控制系统的相关需求也增加了市场扩张机会。在各种环境条件下有效工作的耐用且响应灵敏的触控感测器的市场开拓可能会进一步推动市场需求。
区域洞察
在美洲地区,美国由于其强大的汽车工业和消费者对先进汽车技术的高度偏好,在汽车触控感测器市场上处于领先地位。该市场是由资讯娱乐和导航系统中触摸感测器的引入、电动车产量的增加以及更严格的安全法规所推动的。此外,汽车製造商和触控感测器技术开发人员之间的合作很常见,旨在实现更灵敏的使用者介面和更快的系统反应时间。美国仍然是创新中心,每年都会申请数十项触控感测器技术专利,旨在使系统更具互动性和安全性。欧洲地区因其严格的安全标准和高水准的汽车技术采用而脱颖而出。该地区的豪华汽车製造商处于将触控感测器技术融入车辆设计的前沿。该地区的汽车製造商和科技公司正在大力投资直觉的触控控制。为了推动触控感应器在最新车型的应用,策略合作很常见。中东和非洲仍处于汽车触控感测器采用的早期阶段,但由于豪华汽车销量的成长和消费者对高科技汽车的需求不断增长,显示出潜力。亚太地区汽车触控感测器市场前景乐观,主要受到主要经济体的推动。主要汽车製造商的存在、汽车的大量生产以及新技术的快速推出正在刺激触控感测器在汽车领域的扩张。此外,不断增长的中阶人口以及对具有先进触控控制功能的小客车的需求不断增加,也促进了该地区的市场成长。
FPNV定位矩阵
FPNV定位矩阵对于评估汽车触控感测器市场至关重要。我们检视与业务策略和产品满意度相关的关键指标,以对供应商进行全面评估。这种深入的分析使用户能够根据自己的要求做出明智的决策。根据评估,供应商被分为四个成功程度不同的像限:前沿(F)、探路者(P)、利基(N)和重要(V)。
市场占有率分析
市场占有率分析是一种综合工具,可对汽车触控感测器市场供应商的现状进行深入而详细的研究。全面比较和分析供应商在整体收益、基本客群和其他关键指标方面的贡献,以便更好地了解公司的绩效及其在争夺市场占有率时面临的挑战。此外,该分析还提供了对该行业竞争特征的宝贵考察,包括在研究基准年观察到的累积、分散主导地位和合併特征等因素。这种详细程度的提高使供应商能够做出更明智的决策并制定有效的策略,从而在市场上获得竞争优势。
本报告在以下方面提供了宝贵的见解:
1-市场渗透率:提供有关主要企业所服务的市场的全面资讯。
2-市场开拓:我们深入研究利润丰厚的新兴市场,并分析它们在成熟细分市场中的渗透率。
3- 市场多元化:提供有关新产品发布、开拓地区、最新发展和投资的详细资讯。
4-竞争力评估与资讯:对主要企业的市场占有率、策略、产品、认证、监管状况、专利状况、製造能力等进行全面评估。
5- 产品开发与创新:提供对未来技术、研发活动和突破性产品开发的见解。
本报告解决了以下关键问题:
1-汽车触控感测器市场的市场规模和预测是多少?
2-在汽车触控感测器市场预测期内,有哪些产品、细分市场、应用和领域需要考虑投资?
3-汽车触控感测器市场的技术趋势和法律规范是什么?
4-汽车触控感应器市场主要厂商的市场占有率是多少?
5-进入汽车触控感测器市场合适的型态和策略手段是什么?
目录
第一章 前言
第二章调查方法
第三章执行摘要
第四章市场概况
第五章市场洞察
- 市场动态
- 促进因素
- 对增强型车辆使用者介面的需求不断增长
- 具有触控操作介面的智慧汽车越来越受欢迎
- 抑制因素
- 在汽车应用中实施触控感测器的初始成本较高
- 机会
- 汽车触摸感应器的技术不断进步
- 汽车电动在全球范围内取得进展
- 任务
- 触控感应器设计缺乏标准
- 促进因素
- 市场区隔分析
- 车辆类型:提高商用车中触控感应器的可用性,实现先进的功能和耐用性
- 应用:驾驶时更多使用资讯娱乐系统
- 分布:由于定义的标准和品质要求,OEM作为触摸感测器製造商的重要性
- 市场趋势分析
- 高通膨的累积效应
- 波特五力分析
- 价值炼和关键路径分析
- 法律规范
第六章汽车触控感知器市场:依车型分类
- 商用车触控感应器
- 小客车触控感应器
第七章汽车触控感应器市场:依应用分类
- 空调及控制面板
- 驾驶辅助系统
- 手势姿态辨识
- 资讯娱乐系统
第八章汽车触控感光元件市场分布
- 售后市场
- OEM
第九章北美和南美汽车触控感应器市场
- 阿根廷
- 巴西
- 加拿大
- 墨西哥
- 美国
第10章亚太地区汽车触控感测器市场
- 澳洲
- 中国
- 印度
- 印尼
- 日本
- 马来西亚
- 菲律宾
- 新加坡
- 韩国
- 台湾
- 泰国
- 越南
第十一章欧洲、中东和非洲汽车触控感测器市场
- 丹麦
- 埃及
- 芬兰
- 法国
- 德国
- 以色列
- 义大利
- 荷兰
- 奈及利亚
- 挪威
- 波兰
- 卡达
- 俄罗斯
- 沙乌地阿拉伯
- 南非
- 西班牙
- 瑞典
- 瑞士
- 土耳其
- 阿拉伯聯合大公国
- 英国
第十二章竞争形势
- FPNV定位矩阵
- 市场占有率分析:主要企业
- 主要企业竞争情境分析
- 合约、合作和伙伴关係
- 新产品发布和功能增强
第13章竞争产品组合
- 主要公司简介
- Allegro Microsystems, Inc.
- Amphenol Advanced Sensors
- Analog Devices, Inc.
- Autoliv, Inc.
- BorgWarner, Inc.
- Canatu Oy
- Continental AG
- CTS Corporation
- DENSO Corporation
- ELMOS Semiconductor SE
- Fujikura Ltd.
- Fujitsu Semiconductor Ltd.
- Futaba Corporation
- Infineon Technologies AG
- Innoviz Technologies Ltd.
- LeddarTech
- Lumissil Microsystems
- Magna International Inc.
- Melexis NV by Xtrion NV
- Microchip Technology Inc.
- Molex LLC by Koch Industries, Inc.
- Neonode Inc
- Nissha Co., Ltd.
- ON Semiconductor Corporation
- Peratech Holdco Limited
- Renesas Electronics Corporation
- Robert Bosch GmbH
- Sensata Technologies
- STMicroelectronics NV
- Synaptics Incorporated
- TE Connectivity Ltd.
- Tokyo Parts Industrial Co., Ltd.
- Valeo SA
- ZF Friedrichshafen AG
- 主要产品系列
第十四章附录
- 讨论指南
- 关于许可证和定价
[197 Pages Report] The Automotive Touch Sensor Market size was estimated at USD 1.18 billion in 2023 and expected to reach USD 1.25 billion in 2024, at a CAGR 5.76% to reach USD 1.76 billion by 2030.
Global Automotive Touch Sensor Market
| KEY MARKET STATISTICS | |
|---|---|
| Base Year [2023] | USD 1.18 billion |
| Estimated Year [2024] | USD 1.25 billion |
| Forecast Year [2030] | USD 1.76 billion |
| CAGR (%) | 5.76% |
An automotive touch sensor is a type of device that detects and measures touch inputs on various surfaces within a vehicle. These inputs can include a driver's or passenger's touch, most often on surfaces including infotainment system screens, control panels, and even door handles. The technology behind these sensors often relies on capacitive touch, where the sensor detects changes in capacitance when a finger approaches or touches the surface. This technology enables the design of interactive systems that enhance the user experience by providing intuitive control of features such as navigation, entertainment, climate settings, and more. With the automotive industry's shift towards more connected and autonomous vehicles, the importance of reliable and responsive touch sensors has grown significantly. Moreover, the growth of the automotive touch sensor market is primarily influenced by factors such as the increasing demand for advanced user interfaces in vehicles, technological innovations in touch sensor capabilities, and the rising adoption of electric and hybrid vehicles equipped with modern console systems has increased the adoption of automotive touch sensors. However, high production costs, the complexity of integrating touch sensors seamlessly into automotive systems may challenge the market growth. Furthermore, the evolving landscape of vehicle interface design and the move away from physical buttons challenge the standardization of touch sensor technologies. Nevertheless, the rise in autonomous vehicles and the corresponding need for sophisticated control systems also present growing opportunities for market expansion. Development of more durable and responsive touch sensors that can operate effectively in various environmental conditions may further boost the market demand.
Regional Insights
In the Americas region, the United States leads the automotive touch sensor market with its strong automotive industry and high consumer preference for advanced vehicle technology. Factors such as integrating touch sensors in infotainment and navigation systems, the growth of electric vehicle production, and enhanced safety regulations drive the market. Furthermore, collaborations between automotive OEMs and touch sensor technology developers are common, aiming to provide a more responsive user interface and faster system reaction times. The U.S. continues to be a hub for innovation, with numerous patents filed yearly for touch sensor technology, often aimed at improving the interactivity and safety of these systems. The European region stands out with strict safety standards and high levels of technology adoption in vehicles. Luxury automakers in this region are at the forefront of integrating touch sensor technology into their vehicle designs. The region's auto manufacturers and tech companies are investing heavily in intuitive touch controls. Strategic collaborations are common to drive the integration of touch sensors in the latest vehicle models. The Middle East and Africa, while still emerging in automotive touch sensor adoption, show potential due to the growth in luxury vehicle sales and the increasing consumer demand for high-tech vehicles. The Asia Pacific region showcases an opportunistic landscape for the automotive touch sensor market, primarily driven by major economies. The presence of major automotive manufacturers, high volume of vehicle production, and rapid adoption of new technologies fuel the expansion of touch sensors in the automotive sector. In addition, the growing middle-class population and increased demand for passenger vehicles with advanced touch control features are contributing to the region's market growth.
FPNV Positioning Matrix
The FPNV Positioning Matrix is pivotal in evaluating the Automotive Touch Sensor Market. It offers a comprehensive assessment of vendors, examining key metrics related to Business Strategy and Product Satisfaction. This in-depth analysis empowers users to make well-informed decisions aligned with their requirements. Based on the evaluation, the vendors are then categorized into four distinct quadrants representing varying levels of success: Forefront (F), Pathfinder (P), Niche (N), or Vital (V).
Market Share Analysis
The Market Share Analysis is a comprehensive tool that provides an insightful and in-depth examination of the current state of vendors in the Automotive Touch Sensor Market. By meticulously comparing and analyzing vendor contributions in terms of overall revenue, customer base, and other key metrics, we can offer companies a greater understanding of their performance and the challenges they face when competing for market share. Additionally, this analysis provides valuable insights into the competitive nature of the sector, including factors such as accumulation, fragmentation dominance, and amalgamation traits observed over the base year period studied. With this expanded level of detail, vendors can make more informed decisions and devise effective strategies to gain a competitive edge in the market.
Key Company Profiles
The report delves into recent significant developments in the Automotive Touch Sensor Market, highlighting leading vendors and their innovative profiles. These include Allegro Microsystems, Inc., Amphenol Advanced Sensors, Analog Devices, Inc., Autoliv, Inc., BorgWarner, Inc., Canatu Oy, Continental AG, CTS Corporation, DENSO Corporation, ELMOS Semiconductor SE, Fujikura Ltd., Fujitsu Semiconductor Ltd., Futaba Corporation, Infineon Technologies AG, Innoviz Technologies Ltd., LeddarTech, Lumissil Microsystems, Magna International Inc., Melexis N.V. by Xtrion N.V., Microchip Technology Inc., Molex LLC by Koch Industries, Inc., Neonode Inc, Nissha Co., Ltd., ON Semiconductor Corporation, Peratech Holdco Limited, Renesas Electronics Corporation, Robert Bosch GmbH, Sensata Technologies, STMicroelectronics N.V., Synaptics Incorporated, TE Connectivity Ltd., Tokyo Parts Industrial Co., Ltd., Valeo S.A., and ZF Friedrichshafen AG.
Market Segmentation & Coverage
This research report categorizes the Automotive Touch Sensor Market to forecast the revenues and analyze trends in each of the following sub-markets:
- Vehicle Type
- Commercial Vehicle Touch Sensor
- Passenger Vehicle Touch Sensor
- Application
- Climate & Control Panels
- Driver-Assistance Systems
- Gesture Recognition
- Infotainment Systems
- Distribution
- Aftermarket
- OEM
- Region
- Americas
- Argentina
- Brazil
- Canada
- Mexico
- United States
- California
- Florida
- Illinois
- New York
- Ohio
- Pennsylvania
- Texas
- Asia-Pacific
- Australia
- China
- India
- Indonesia
- Japan
- Malaysia
- Philippines
- Singapore
- South Korea
- Taiwan
- Thailand
- Vietnam
- Europe, Middle East & Africa
- Denmark
- Egypt
- Finland
- France
- Germany
- Israel
- Italy
- Netherlands
- Nigeria
- Norway
- Poland
- Qatar
- Russia
- Saudi Arabia
- South Africa
- Spain
- Sweden
- Switzerland
- Turkey
- United Arab Emirates
- United Kingdom
- Americas
The report offers valuable insights on the following aspects:
1. Market Penetration: It presents comprehensive information on the market provided by key players.
2. Market Development: It delves deep into lucrative emerging markets and analyzes the penetration across mature market segments.
3. Market Diversification: It provides detailed information on new product launches, untapped geographic regions, recent developments, and investments.
4. Competitive Assessment & Intelligence: It conducts an exhaustive assessment of market shares, strategies, products, certifications, regulatory approvals, patent landscape, and manufacturing capabilities of the leading players.
5. Product Development & Innovation: It offers intelligent insights on future technologies, R&D activities, and breakthrough product developments.
The report addresses key questions such as:
1. What is the market size and forecast of the Automotive Touch Sensor Market?
2. Which products, segments, applications, and areas should one consider investing in over the forecast period in the Automotive Touch Sensor Market?
3. What are the technology trends and regulatory frameworks in the Automotive Touch Sensor Market?
4. What is the market share of the leading vendors in the Automotive Touch Sensor Market?
5. Which modes and strategic moves are suitable for entering the Automotive Touch Sensor Market?
Table of Contents
1. Preface
- 1.1. Objectives of the Study
- 1.2. Market Segmentation & Coverage
- 1.3. Years Considered for the Study
- 1.4. Currency & Pricing
- 1.5. Language
- 1.6. Limitations
- 1.7. Assumptions
- 1.8. Stakeholders
2. Research Methodology
- 2.1. Define: Research Objective
- 2.2. Determine: Research Design
- 2.3. Prepare: Research Instrument
- 2.4. Collect: Data Source
- 2.5. Analyze: Data Interpretation
- 2.6. Formulate: Data Verification
- 2.7. Publish: Research Report
- 2.8. Repeat: Report Update
3. Executive Summary
4. Market Overview
- 4.1. Introduction
- 4.2. Automotive Touch Sensor Market, by Region
5. Market Insights
- 5.1. Market Dynamics
- 5.1.1. Drivers
- 5.1.1.1. Rising demand for user interface enhancement in vehicles
- 5.1.1.2. Growing popularity of smart vehicles with touch-controlled interfaces
- 5.1.2. Restraints
- 5.1.2.1. High initial costs associated with implementing touch sensors in automotive applications
- 5.1.3. Opportunities
- 5.1.3.1. Ongoing technological advancements in automotive touch sensor
- 5.1.3.2. Increasing vehicle electrification globally
- 5.1.4. Challenges
- 5.1.4.1. Lack of standards in the design of touch sensors
- 5.1.1. Drivers
- 5.2. Market Segmentation Analysis
- 5.2.1. Vehicle Type: Increasing usability of touch sensors in commercial vehicles for advanced functionality and durability
- 5.2.2. Application: Increasing use of Infotainment systems during a drive
- 5.2.3. Distribution: Cruciality of OEM as touch sensor manufacturers owing to dictation of standard and quality requirements
- 5.3. Market Trend Analysis
- 5.4. Cumulative Impact of High Inflation
- 5.5. Porter's Five Forces Analysis
- 5.5.1. Threat of New Entrants
- 5.5.2. Threat of Substitutes
- 5.5.3. Bargaining Power of Customers
- 5.5.4. Bargaining Power of Suppliers
- 5.5.5. Industry Rivalry
- 5.6. Value Chain & Critical Path Analysis
- 5.7. Regulatory Framework
6. Automotive Touch Sensor Market, by Vehicle Type
- 6.1. Introduction
- 6.2. Commercial Vehicle Touch Sensor
- 6.3. Passenger Vehicle Touch Sensor
7. Automotive Touch Sensor Market, by Application
- 7.1. Introduction
- 7.2. Climate & Control Panels
- 7.3. Driver-Assistance Systems
- 7.4. Gesture Recognition
- 7.5. Infotainment Systems
8. Automotive Touch Sensor Market, by Distribution
- 8.1. Introduction
- 8.2. Aftermarket
- 8.3. OEM
9. Americas Automotive Touch Sensor Market
- 9.1. Introduction
- 9.2. Argentina
- 9.3. Brazil
- 9.4. Canada
- 9.5. Mexico
- 9.6. United States
10. Asia-Pacific Automotive Touch Sensor Market
- 10.1. Introduction
- 10.2. Australia
- 10.3. China
- 10.4. India
- 10.5. Indonesia
- 10.6. Japan
- 10.7. Malaysia
- 10.8. Philippines
- 10.9. Singapore
- 10.10. South Korea
- 10.11. Taiwan
- 10.12. Thailand
- 10.13. Vietnam
11. Europe, Middle East & Africa Automotive Touch Sensor Market
- 11.1. Introduction
- 11.2. Denmark
- 11.3. Egypt
- 11.4. Finland
- 11.5. France
- 11.6. Germany
- 11.7. Israel
- 11.8. Italy
- 11.9. Netherlands
- 11.10. Nigeria
- 11.11. Norway
- 11.12. Poland
- 11.13. Qatar
- 11.14. Russia
- 11.15. Saudi Arabia
- 11.16. South Africa
- 11.17. Spain
- 11.18. Sweden
- 11.19. Switzerland
- 11.20. Turkey
- 11.21. United Arab Emirates
- 11.22. United Kingdom
12. Competitive Landscape
- 12.1. FPNV Positioning Matrix
- 12.2. Market Share Analysis, By Key Player
- 12.3. Competitive Scenario Analysis, By Key Player
- 12.3.1. Agreement, Collaboration, & Partnership
- 12.3.1.1. Ultrasense, Mobase Team to Bring Touch Sensing Into Vehicles
- 12.3.2. New Product Launch & Enhancement
- 12.3.2.1. UltraSense Systems Launches TouchPoint Q to Improve the Touch Experience for Automotive User Interfaces
- 12.3.2.2. New KIA EV9 Utilizes TouchNetix' Smart Surface for Dashboard Controls
- 12.3.1. Agreement, Collaboration, & Partnership
13. Competitive Portfolio
- 13.1. Key Company Profiles
- 13.1.1. Allegro Microsystems, Inc.
- 13.1.2. Amphenol Advanced Sensors
- 13.1.3. Analog Devices, Inc.
- 13.1.4. Autoliv, Inc.
- 13.1.5. BorgWarner, Inc.
- 13.1.6. Canatu Oy
- 13.1.7. Continental AG
- 13.1.8. CTS Corporation
- 13.1.9. DENSO Corporation
- 13.1.10. ELMOS Semiconductor SE
- 13.1.11. Fujikura Ltd.
- 13.1.12. Fujitsu Semiconductor Ltd.
- 13.1.13. Futaba Corporation
- 13.1.14. Infineon Technologies AG
- 13.1.15. Innoviz Technologies Ltd.
- 13.1.16. LeddarTech
- 13.1.17. Lumissil Microsystems
- 13.1.18. Magna International Inc.
- 13.1.19. Melexis N.V. by Xtrion N.V.
- 13.1.20. Microchip Technology Inc.
- 13.1.21. Molex LLC by Koch Industries, Inc.
- 13.1.22. Neonode Inc
- 13.1.23. Nissha Co., Ltd.
- 13.1.24. ON Semiconductor Corporation
- 13.1.25. Peratech Holdco Limited
- 13.1.26. Renesas Electronics Corporation
- 13.1.27. Robert Bosch GmbH
- 13.1.28. Sensata Technologies
- 13.1.29. STMicroelectronics N.V.
- 13.1.30. Synaptics Incorporated
- 13.1.31. TE Connectivity Ltd.
- 13.1.32. Tokyo Parts Industrial Co., Ltd.
- 13.1.33. Valeo S.A.
- 13.1.34. ZF Friedrichshafen AG
- 13.2. Key Product Portfolio
14. Appendix
- 14.1. Discussion Guide
- 14.2. License & Pricing
LIST OF FIGURES
- FIGURE 1. AUTOMOTIVE TOUCH SENSOR MARKET RESEARCH PROCESS
- FIGURE 2. AUTOMOTIVE TOUCH SENSOR MARKET SIZE, 2023 VS 2030
- FIGURE 3. AUTOMOTIVE TOUCH SENSOR MARKET SIZE, 2018-2030 (USD MILLION)
- FIGURE 4. AUTOMOTIVE TOUCH SENSOR MARKET SIZE, BY REGION, 2023 VS 2030 (%)
- FIGURE 5. AUTOMOTIVE TOUCH SENSOR MARKET SIZE, BY REGION, 2023 VS 2024 VS 2030 (USD MILLION)
- FIGURE 6. AUTOMOTIVE TOUCH SENSOR MARKET DYNAMICS
- FIGURE 7. AUTOMOTIVE TOUCH SENSOR MARKET SIZE, BY VEHICLE TYPE, 2023 VS 2030 (%)
- FIGURE 8. AUTOMOTIVE TOUCH SENSOR MARKET SIZE, BY VEHICLE TYPE, 2023 VS 2024 VS 2030 (USD MILLION)
- FIGURE 9. AUTOMOTIVE TOUCH SENSOR MARKET SIZE, BY APPLICATION, 2023 VS 2030 (%)
- FIGURE 10. AUTOMOTIVE TOUCH SENSOR MARKET SIZE, BY APPLICATION, 2023 VS 2024 VS 2030 (USD MILLION)
- FIGURE 11. AUTOMOTIVE TOUCH SENSOR MARKET SIZE, BY DISTRIBUTION, 2023 VS 2030 (%)
- FIGURE 12. AUTOMOTIVE TOUCH SENSOR MARKET SIZE, BY DISTRIBUTION, 2023 VS 2024 VS 2030 (USD MILLION)
- FIGURE 13. AMERICAS AUTOMOTIVE TOUCH SENSOR MARKET SIZE, BY COUNTRY, 2023 VS 2030 (%)
- FIGURE 14. AMERICAS AUTOMOTIVE TOUCH SENSOR MARKET SIZE, BY COUNTRY, 2023 VS 2024 VS 2030 (USD MILLION)
- FIGURE 15. UNITED STATES AUTOMOTIVE TOUCH SENSOR MARKET SIZE, BY STATE, 2023 VS 2030 (%)
- FIGURE 16. UNITED STATES AUTOMOTIVE TOUCH SENSOR MARKET SIZE, BY STATE, 2023 VS 2024 VS 2030 (USD MILLION)
- FIGURE 17. ASIA-PACIFIC AUTOMOTIVE TOUCH SENSOR MARKET SIZE, BY COUNTRY, 2023 VS 2030 (%)
- FIGURE 18. ASIA-PACIFIC AUTOMOTIVE TOUCH SENSOR MARKET SIZE, BY COUNTRY, 2023 VS 2024 VS 2030 (USD MILLION)
- FIGURE 19. EUROPE, MIDDLE EAST & AFRICA AUTOMOTIVE TOUCH SENSOR MARKET SIZE, BY COUNTRY, 2023 VS 2030 (%)
- FIGURE 20. EUROPE, MIDDLE EAST & AFRICA AUTOMOTIVE TOUCH SENSOR MARKET SIZE, BY COUNTRY, 2023 VS 2024 VS 2030 (USD MILLION)
- FIGURE 21. AUTOMOTIVE TOUCH SENSOR MARKET, FPNV POSITIONING MATRIX, 2023
- FIGURE 22. AUTOMOTIVE TOUCH SENSOR MARKET SHARE, BY KEY PLAYER, 2023
LIST OF TABLES
- TABLE 1. AUTOMOTIVE TOUCH SENSOR MARKET SEGMENTATION & COVERAGE
- TABLE 2. UNITED STATES DOLLAR EXCHANGE RATE, 2018-2023
- TABLE 3. AUTOMOTIVE TOUCH SENSOR MARKET SIZE, 2018-2030 (USD MILLION)
- TABLE 4. GLOBAL AUTOMOTIVE TOUCH SENSOR MARKET SIZE, BY REGION, 2018-2030 (USD MILLION)
- TABLE 5. AUTOMOTIVE TOUCH SENSOR MARKET SIZE, BY VEHICLE TYPE, 2018-2030 (USD MILLION)
- TABLE 6. AUTOMOTIVE TOUCH SENSOR MARKET SIZE, BY COMMERCIAL VEHICLE TOUCH SENSOR, BY REGION, 2018-2030 (USD MILLION)
- TABLE 7. AUTOMOTIVE TOUCH SENSOR MARKET SIZE, BY PASSENGER VEHICLE TOUCH SENSOR, BY REGION, 2018-2030 (USD MILLION)
- TABLE 8. AUTOMOTIVE TOUCH SENSOR MARKET SIZE, BY APPLICATION, 2018-2030 (USD MILLION)
- TABLE 9. AUTOMOTIVE TOUCH SENSOR MARKET SIZE, BY CLIMATE & CONTROL PANELS, BY REGION, 2018-2030 (USD MILLION)
- TABLE 10. AUTOMOTIVE TOUCH SENSOR MARKET SIZE, BY DRIVER-ASSISTANCE SYSTEMS, BY REGION, 2018-2030 (USD MILLION)
- TABLE 11. AUTOMOTIVE TOUCH SENSOR MARKET SIZE, BY GESTURE RECOGNITION, BY REGION, 2018-2030 (USD MILLION)
- TABLE 12. AUTOMOTIVE TOUCH SENSOR MARKET SIZE, BY INFOTAINMENT SYSTEMS, BY REGION, 2018-2030 (USD MILLION)
- TABLE 13. AUTOMOTIVE TOUCH SENSOR MARKET SIZE, BY DISTRIBUTION, 2018-2030 (USD MILLION)
- TABLE 14. AUTOMOTIVE TOUCH SENSOR MARKET SIZE, BY AFTERMARKET, BY REGION, 2018-2030 (USD MILLION)
- TABLE 15. AUTOMOTIVE TOUCH SENSOR MARKET SIZE, BY OEM, BY REGION, 2018-2030 (USD MILLION)
- TABLE 16. AMERICAS AUTOMOTIVE TOUCH SENSOR MARKET SIZE, BY VEHICLE TYPE, 2018-2030 (USD MILLION)
- TABLE 17. AMERICAS AUTOMOTIVE TOUCH SENSOR MARKET SIZE, BY APPLICATION, 2018-2030 (USD MILLION)
- TABLE 18. AMERICAS AUTOMOTIVE TOUCH SENSOR MARKET SIZE, BY DISTRIBUTION, 2018-2030 (USD MILLION)
- TABLE 19. AMERICAS AUTOMOTIVE TOUCH SENSOR MARKET SIZE, BY COUNTRY, 2018-2030 (USD MILLION)
- TABLE 20. ARGENTINA AUTOMOTIVE TOUCH SENSOR MARKET SIZE, BY VEHICLE TYPE, 2018-2030 (USD MILLION)
- TABLE 21. ARGENTINA AUTOMOTIVE TOUCH SENSOR MARKET SIZE, BY APPLICATION, 2018-2030 (USD MILLION)
- TABLE 22. ARGENTINA AUTOMOTIVE TOUCH SENSOR MARKET SIZE, BY DISTRIBUTION, 2018-2030 (USD MILLION)
- TABLE 23. BRAZIL AUTOMOTIVE TOUCH SENSOR MARKET SIZE, BY VEHICLE TYPE, 2018-2030 (USD MILLION)
- TABLE 24. BRAZIL AUTOMOTIVE TOUCH SENSOR MARKET SIZE, BY APPLICATION, 2018-2030 (USD MILLION)
- TABLE 25. BRAZIL AUTOMOTIVE TOUCH SENSOR MARKET SIZE, BY DISTRIBUTION, 2018-2030 (USD MILLION)
- TABLE 26. CANADA AUTOMOTIVE TOUCH SENSOR MARKET SIZE, BY VEHICLE TYPE, 2018-2030 (USD MILLION)
- TABLE 27. CANADA AUTOMOTIVE TOUCH SENSOR MARKET SIZE, BY APPLICATION, 2018-2030 (USD MILLION)
- TABLE 28. CANADA AUTOMOTIVE TOUCH SENSOR MARKET SIZE, BY DISTRIBUTION, 2018-2030 (USD MILLION)
- TABLE 29. MEXICO AUTOMOTIVE TOUCH SENSOR MARKET SIZE, BY VEHICLE TYPE, 2018-2030 (USD MILLION)
- TABLE 30. MEXICO AUTOMOTIVE TOUCH SENSOR MARKET SIZE, BY APPLICATION, 2018-2030 (USD MILLION)
- TABLE 31. MEXICO AUTOMOTIVE TOUCH SENSOR MARKET SIZE, BY DISTRIBUTION, 2018-2030 (USD MILLION)
- TABLE 32. UNITED STATES AUTOMOTIVE TOUCH SENSOR MARKET SIZE, BY VEHICLE TYPE, 2018-2030 (USD MILLION)
- TABLE 33. UNITED STATES AUTOMOTIVE TOUCH SENSOR MARKET SIZE, BY APPLICATION, 2018-2030 (USD MILLION)
- TABLE 34. UNITED STATES AUTOMOTIVE TOUCH SENSOR MARKET SIZE, BY DISTRIBUTION, 2018-2030 (USD MILLION)
- TABLE 35. UNITED STATES AUTOMOTIVE TOUCH SENSOR MARKET SIZE, BY STATE, 2018-2030 (USD MILLION)
- TABLE 36. ASIA-PACIFIC AUTOMOTIVE TOUCH SENSOR MARKET SIZE, BY VEHICLE TYPE, 2018-2030 (USD MILLION)
- TABLE 37. ASIA-PACIFIC AUTOMOTIVE TOUCH SENSOR MARKET SIZE, BY APPLICATION, 2018-2030 (USD MILLION)
- TABLE 38. ASIA-PACIFIC AUTOMOTIVE TOUCH SENSOR MARKET SIZE, BY DISTRIBUTION, 2018-2030 (USD MILLION)
- TABLE 39. ASIA-PACIFIC AUTOMOTIVE TOUCH SENSOR MARKET SIZE, BY COUNTRY, 2018-2030 (USD MILLION)
- TABLE 40. AUSTRALIA AUTOMOTIVE TOUCH SENSOR MARKET SIZE, BY VEHICLE TYPE, 2018-2030 (USD MILLION)
- TABLE 41. AUSTRALIA AUTOMOTIVE TOUCH SENSOR MARKET SIZE, BY APPLICATION, 2018-2030 (USD MILLION)
- TABLE 42. AUSTRALIA AUTOMOTIVE TOUCH SENSOR MARKET SIZE, BY DISTRIBUTION, 2018-2030 (USD MILLION)
- TABLE 43. CHINA AUTOMOTIVE TOUCH SENSOR MARKET SIZE, BY VEHICLE TYPE, 2018-2030 (USD MILLION)
- TABLE 44. CHINA AUTOMOTIVE TOUCH SENSOR MARKET SIZE, BY APPLICATION, 2018-2030 (USD MILLION)
- TABLE 45. CHINA AUTOMOTIVE TOUCH SENSOR MARKET SIZE, BY DISTRIBUTION, 2018-2030 (USD MILLION)
- TABLE 46. INDIA AUTOMOTIVE TOUCH SENSOR MARKET SIZE, BY VEHICLE TYPE, 2018-2030 (USD MILLION)
- TABLE 47. INDIA AUTOMOTIVE TOUCH SENSOR MARKET SIZE, BY APPLICATION, 2018-2030 (USD MILLION)
- TABLE 48. INDIA AUTOMOTIVE TOUCH SENSOR MARKET SIZE, BY DISTRIBUTION, 2018-2030 (USD MILLION)
- TABLE 49. INDONESIA AUTOMOTIVE TOUCH SENSOR MARKET SIZE, BY VEHICLE TYPE, 2018-2030 (USD MILLION)
- TABLE 50. INDONESIA AUTOMOTIVE TOUCH SENSOR MARKET SIZE, BY APPLICATION, 2018-2030 (USD MILLION)
- TABLE 51. INDONESIA AUTOMOTIVE TOUCH SENSOR MARKET SIZE, BY DISTRIBUTION, 2018-2030 (USD MILLION)
- TABLE 52. JAPAN AUTOMOTIVE TOUCH SENSOR MARKET SIZE, BY VEHICLE TYPE, 2018-2030 (USD MILLION)
- TABLE 53. JAPAN AUTOMOTIVE TOUCH SENSOR MARKET SIZE, BY APPLICATION, 2018-2030 (USD MILLION)
- TABLE 54. JAPAN AUTOMOTIVE TOUCH SENSOR MARKET SIZE, BY DISTRIBUTION, 2018-2030 (USD MILLION)
- TABLE 55. MALAYSIA AUTOMOTIVE TOUCH SENSOR MARKET SIZE, BY VEHICLE TYPE, 2018-2030 (USD MILLION)
- TABLE 56. MALAYSIA AUTOMOTIVE TOUCH SENSOR MARKET SIZE, BY APPLICATION, 2018-2030 (USD MILLION)
- TABLE 57. MALAYSIA AUTOMOTIVE TOUCH SENSOR MARKET SIZE, BY DISTRIBUTION, 2018-2030 (USD MILLION)
- TABLE 58. PHILIPPINES AUTOMOTIVE TOUCH SENSOR MARKET SIZE, BY VEHICLE TYPE, 2018-2030 (USD MILLION)
- TABLE 59. PHILIPPINES AUTOMOTIVE TOUCH SENSOR MARKET SIZE, BY APPLICATION, 2018-2030 (USD MILLION)
- TABLE 60. PHILIPPINES AUTOMOTIVE TOUCH SENSOR MARKET SIZE, BY DISTRIBUTION, 2018-2030 (USD MILLION)
- TABLE 61. SINGAPORE AUTOMOTIVE TOUCH SENSOR MARKET SIZE, BY VEHICLE TYPE, 2018-2030 (USD MILLION)
- TABLE 62. SINGAPORE AUTOMOTIVE TOUCH SENSOR MARKET SIZE, BY APPLICATION, 2018-2030 (USD MILLION)
- TABLE 63. SINGAPORE AUTOMOTIVE TOUCH SENSOR MARKET SIZE, BY DISTRIBUTION, 2018-2030 (USD MILLION)
- TABLE 64. SOUTH KOREA AUTOMOTIVE TOUCH SENSOR MARKET SIZE, BY VEHICLE TYPE, 2018-2030 (USD MILLION)
- TABLE 65. SOUTH KOREA AUTOMOTIVE TOUCH SENSOR MARKET SIZE, BY APPLICATION, 2018-2030 (USD MILLION)
- TABLE 66. SOUTH KOREA AUTOMOTIVE TOUCH SENSOR MARKET SIZE, BY DISTRIBUTION, 2018-2030 (USD MILLION)
- TABLE 67. TAIWAN AUTOMOTIVE TOUCH SENSOR MARKET SIZE, BY VEHICLE TYPE, 2018-2030 (USD MILLION)
- TABLE 68. TAIWAN AUTOMOTIVE TOUCH SENSOR MARKET SIZE, BY APPLICATION, 2018-2030 (USD MILLION)
- TABLE 69. TAIWAN AUTOMOTIVE TOUCH SENSOR MARKET SIZE, BY DISTRIBUTION, 2018-2030 (USD MILLION)
- TABLE 70. THAILAND AUTOMOTIVE TOUCH SENSOR MARKET SIZE, BY VEHICLE TYPE, 2018-2030 (USD MILLION)
- TABLE 71. THAILAND AUTOMOTIVE TOUCH SENSOR MARKET SIZE, BY APPLICATION, 2018-2030 (USD MILLION)
- TABLE 72. THAILAND AUTOMOTIVE TOUCH SENSOR MARKET SIZE, BY DISTRIBUTION, 2018-2030 (USD MILLION)
- TABLE 73. VIETNAM AUTOMOTIVE TOUCH SENSOR MARKET SIZE, BY VEHICLE TYPE, 2018-2030 (USD MILLION)
- TABLE 74. VIETNAM AUTOMOTIVE TOUCH SENSOR MARKET SIZE, BY APPLICATION, 2018-2030 (USD MILLION)
- TABLE 75. VIETNAM AUTOMOTIVE TOUCH SENSOR MARKET SIZE, BY DISTRIBUTION, 2018-2030 (USD MILLION)
- TABLE 76. EUROPE, MIDDLE EAST & AFRICA AUTOMOTIVE TOUCH SENSOR MARKET SIZE, BY VEHICLE TYPE, 2018-2030 (USD MILLION)
- TABLE 77. EUROPE, MIDDLE EAST & AFRICA AUTOMOTIVE TOUCH SENSOR MARKET SIZE, BY APPLICATION, 2018-2030 (USD MILLION)
- TABLE 78. EUROPE, MIDDLE EAST & AFRICA AUTOMOTIVE TOUCH SENSOR MARKET SIZE, BY DISTRIBUTION, 2018-2030 (USD MILLION)
- TABLE 79. EUROPE, MIDDLE EAST & AFRICA AUTOMOTIVE TOUCH SENSOR MARKET SIZE, BY COUNTRY, 2018-2030 (USD MILLION)
- TABLE 80. DENMARK AUTOMOTIVE TOUCH SENSOR MARKET SIZE, BY VEHICLE TYPE, 2018-2030 (USD MILLION)
- TABLE 81. DENMARK AUTOMOTIVE TOUCH SENSOR MARKET SIZE, BY APPLICATION, 2018-2030 (USD MILLION)
- TABLE 82. DENMARK AUTOMOTIVE TOUCH SENSOR MARKET SIZE, BY DISTRIBUTION, 2018-2030 (USD MILLION)
- TABLE 83. EGYPT AUTOMOTIVE TOUCH SENSOR MARKET SIZE, BY VEHICLE TYPE, 2018-2030 (USD MILLION)
- TABLE 84. EGYPT AUTOMOTIVE TOUCH SENSOR MARKET SIZE, BY APPLICATION, 2018-2030 (USD MILLION)
- TABLE 85. EGYPT AUTOMOTIVE TOUCH SENSOR MARKET SIZE, BY DISTRIBUTION, 2018-2030 (USD MILLION)
- TABLE 86. FINLAND AUTOMOTIVE TOUCH SENSOR MARKET SIZE, BY VEHICLE TYPE, 2018-2030 (USD MILLION)
- TABLE 87. FINLAND AUTOMOTIVE TOUCH SENSOR MARKET SIZE, BY APPLICATION, 2018-2030 (USD MILLION)
- TABLE 88. FINLAND AUTOMOTIVE TOUCH SENSOR MARKET SIZE, BY DISTRIBUTION, 2018-2030 (USD MILLION)
- TABLE 89. FRANCE AUTOMOTIVE TOUCH SENSOR MARKET SIZE, BY VEHICLE TYPE, 2018-2030 (USD MILLION)
- TABLE 90. FRANCE AUTOMOTIVE TOUCH SENSOR MARKET SIZE, BY APPLICATION, 2018-2030 (USD MILLION)
- TABLE 91. FRANCE AUTOMOTIVE TOUCH SENSOR MARKET SIZE, BY DISTRIBUTION, 2018-2030 (USD MILLION)
- TABLE 92. GERMANY AUTOMOTIVE TOUCH SENSOR MARKET SIZE, BY VEHICLE TYPE, 2018-2030 (USD MILLION)
- TABLE 93. GERMANY AUTOMOTIVE TOUCH SENSOR MARKET SIZE, BY APPLICATION, 2018-2030 (USD MILLION)
- TABLE 94. GERMANY AUTOMOTIVE TOUCH SENSOR MARKET SIZE, BY DISTRIBUTION, 2018-2030 (USD MILLION)
- TABLE 95. ISRAEL AUTOMOTIVE TOUCH SENSOR MARKET SIZE, BY VEHICLE TYPE, 2018-2030 (USD MILLION)
- TABLE 96. ISRAEL AUTOMOTIVE TOUCH SENSOR MARKET SIZE, BY APPLICATION, 2018-2030 (USD MILLION)
- TABLE 97. ISRAEL AUTOMOTIVE TOUCH SENSOR MARKET SIZE, BY DISTRIBUTION, 2018-2030 (USD MILLION)
- TABLE 98. ITALY AUTOMOTIVE TOUCH SENSOR MARKET SIZE, BY VEHICLE TYPE, 2018-2030 (USD MILLION)
- TABLE 99. ITALY AUTOMOTIVE TOUCH SENSOR MARKET SIZE, BY APPLICATION, 2018-2030 (USD MILLION)
- TABLE 100. ITALY AUTOMOTIVE TOUCH SENSOR MARKET SIZE, BY DISTRIBUTION, 2018-2030 (USD MILLION)
- TABLE 101. NETHERLANDS AUTOMOTIVE TOUCH SENSOR MARKET SIZE, BY VEHICLE TYPE, 2018-2030 (USD MILLION)
- TABLE 102. NETHERLANDS AUTOMOTIVE TOUCH SENSOR MARKET SIZE, BY APPLICATION, 2018-2030 (USD MILLION)
- TABLE 103. NETHERLANDS AUTOMOTIVE TOUCH SENSOR MARKET SIZE, BY DISTRIBUTION, 2018-2030 (USD MILLION)
- TABLE 104. NIGERIA AUTOMOTIVE TOUCH SENSOR MARKET SIZE, BY VEHICLE TYPE, 2018-2030 (USD MILLION)
- TABLE 105. NIGERIA AUTOMOTIVE TOUCH SENSOR MARKET SIZE, BY APPLICATION, 2018-2030 (USD MILLION)
- TABLE 106. NIGERIA AUTOMOTIVE TOUCH SENSOR MARKET SIZE, BY DISTRIBUTION, 2018-2030 (USD MILLION)
- TABLE 107. NORWAY AUTOMOTIVE TOUCH SENSOR MARKET SIZE, BY VEHICLE TYPE, 2018-2030 (USD MILLION)
- TABLE 108. NORWAY AUTOMOTIVE TOUCH SENSOR MARKET SIZE, BY APPLICATION, 2018-2030 (USD MILLION)
- TABLE 109. NORWAY AUTOMOTIVE TOUCH SENSOR MARKET SIZE, BY DISTRIBUTION, 2018-2030 (USD MILLION)
- TABLE 110. POLAND AUTOMOTIVE TOUCH SENSOR MARKET SIZE, BY VEHICLE TYPE, 2018-2030 (USD MILLION)
- TABLE 111. POLAND AUTOMOTIVE TOUCH SENSOR MARKET SIZE, BY APPLICATION, 2018-2030 (USD MILLION)
- TABLE 112. POLAND AUTOMOTIVE TOUCH SENSOR MARKET SIZE, BY DISTRIBUTION, 2018-2030 (USD MILLION)
- TABLE 113. QATAR AUTOMOTIVE TOUCH SENSOR MARKET SIZE, BY VEHICLE TYPE, 2018-2030 (USD MILLION)
- TABLE 114. QATAR AUTOMOTIVE TOUCH SENSOR MARKET SIZE, BY APPLICATION, 2018-2030 (USD MILLION)
- TABLE 115. QATAR AUTOMOTIVE TOUCH SENSOR MARKET SIZE, BY DISTRIBUTION, 2018-2030 (USD MILLION)
- TABLE 116. RUSSIA AUTOMOTIVE TOUCH SENSOR MARKET SIZE, BY VEHICLE TYPE, 2018-2030 (USD MILLION)
- TABLE 117. RUSSIA AUTOMOTIVE TOUCH SENSOR MARKET SIZE, BY APPLICATION, 2018-2030 (USD MILLION)
- TABLE 118. RUSSIA AUTOMOTIVE TOUCH SENSOR MARKET SIZE, BY DISTRIBUTION, 2018-2030 (USD MILLION)
- TABLE 119. SAUDI ARABIA AUTOMOTIVE TOUCH SENSOR MARKET SIZE, BY VEHICLE TYPE, 2018-2030 (USD MILLION)
- TABLE 120. SAUDI ARABIA AUTOMOTIVE TOUCH SENSOR MARKET SIZE, BY APPLICATION, 2018-2030 (USD MILLION)
- TABLE 121. SAUDI ARABIA AUTOMOTIVE TOUCH SENSOR MARKET SIZE, BY DISTRIBUTION, 2018-2030 (USD MILLION)
- TABLE 122. SOUTH AFRICA AUTOMOTIVE TOUCH SENSOR MARKET SIZE, BY VEHICLE TYPE, 2018-2030 (USD MILLION)
- TABLE 123. SOUTH AFRICA AUTOMOTIVE TOUCH SENSOR MARKET SIZE, BY APPLICATION, 2018-2030 (USD MILLION)
- TABLE 124. SOUTH AFRICA AUTOMOTIVE TOUCH SENSOR MARKET SIZE, BY DISTRIBUTION, 2018-2030 (USD MILLION)
- TABLE 125. SPAIN AUTOMOTIVE TOUCH SENSOR MARKET SIZE, BY VEHICLE TYPE, 2018-2030 (USD MILLION)
- TABLE 126. SPAIN AUTOMOTIVE TOUCH SENSOR MARKET SIZE, BY APPLICATION, 2018-2030 (USD MILLION)
- TABLE 127. SPAIN AUTOMOTIVE TOUCH SENSOR MARKET SIZE, BY DISTRIBUTION, 2018-2030 (USD MILLION)
- TABLE 128. SWEDEN AUTOMOTIVE TOUCH SENSOR MARKET SIZE, BY VEHICLE TYPE, 2018-2030 (USD MILLION)
- TABLE 129. SWEDEN AUTOMOTIVE TOUCH SENSOR MARKET SIZE, BY APPLICATION, 2018-2030 (USD MILLION)
- TABLE 130. SWEDEN AUTOMOTIVE TOUCH SENSOR MARKET SIZE, BY DISTRIBUTION, 2018-2030 (USD MILLION)
- TABLE 131. SWITZERLAND AUTOMOTIVE TOUCH SENSOR MARKET SIZE, BY VEHICLE TYPE, 2018-2030 (USD MILLION)
- TABLE 132. SWITZERLAND AUTOMOTIVE TOUCH SENSOR MARKET SIZE, BY APPLICATION, 2018-2030 (USD MILLION)
- TABLE 133. SWITZERLAND AUTOMOTIVE TOUCH SENSOR MARKET SIZE, BY DISTRIBUTION, 2018-2030 (USD MILLION)
- TABLE 134. TURKEY AUTOMOTIVE TOUCH SENSOR MARKET SIZE, BY VEHICLE TYPE, 2018-2030 (USD MILLION)
- TABLE 135. TURKEY AUTOMOTIVE TOUCH SENSOR MARKET SIZE, BY APPLICATION, 2018-2030 (USD MILLION)
- TABLE 136. TURKEY AUTOMOTIVE TOUCH SENSOR MARKET SIZE, BY DISTRIBUTION, 2018-2030 (USD MILLION)
- TABLE 137. UNITED ARAB EMIRATES AUTOMOTIVE TOUCH SENSOR MARKET SIZE, BY VEHICLE TYPE, 2018-2030 (USD MILLION)
- TABLE 138. UNITED ARAB EMIRATES AUTOMOTIVE TOUCH SENSOR MARKET SIZE, BY APPLICATION, 2018-2030 (USD MILLION)
- TABLE 139. UNITED ARAB EMIRATES AUTOMOTIVE TOUCH SENSOR MARKET SIZE, BY DISTRIBUTION, 2018-2030 (USD MILLION)
- TABLE 140. UNITED KINGDOM AUTOMOTIVE TOUCH SENSOR MARKET SIZE, BY VEHICLE TYPE, 2018-2030 (USD MILLION)
- TABLE 141. UNITED KINGDOM AUTOMOTIVE TOUCH SENSOR MARKET SIZE, BY APPLICATION, 2018-2030 (USD MILLION)
- TABLE 142. UNITED KINGDOM AUTOMOTIVE TOUCH SENSOR MARKET SIZE, BY DISTRIBUTION, 2018-2030 (USD MILLION)
- TABLE 143. AUTOMOTIVE TOUCH SENSOR MARKET, FPNV POSITIONING MATRIX, 2023
- TABLE 144. AUTOMOTIVE TOUCH SENSOR MARKET SHARE, BY KEY PLAYER, 2023
- TABLE 145. AUTOMOTIVE TOUCH SENSOR MARKET LICENSE & PRICING


