


 |
市场调查报告书
商品编码
1413875
生物液化天然气市场:按来源类型、应用划分 - 2024-2030 年全球预测Bio-LNG Market by Source Type (Agricultural Waste, Municipal Waste, Organic Household Waste), Application (Power Generation, Transportation Fuel) - Global Forecast 2024-2030 |
||||||
※ 本网页内容可能与最新版本有所差异。详细情况请与我们联繫。
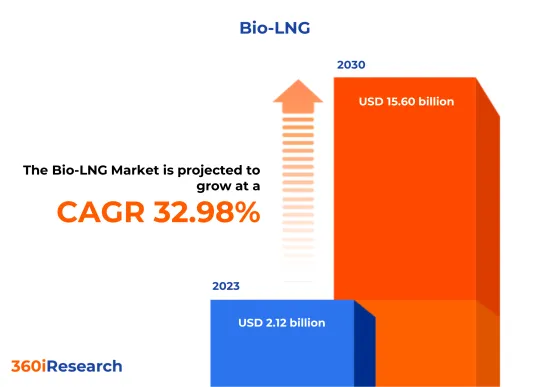
预计2023年生物液化天然气市场规模为21.2亿美元,2024年达28亿美元,2030年预计将达156亿美元,复合年增长率为32.98%。
全球生物液化天然气市场
| 主要市场统计 | |
|---|---|
| 基准年[2023] | 21.2亿美元 |
| 预测年份 [2024] | 28亿美元 |
| 预测年份 [2030] | 156亿美元 |
| 复合年增长率(%) | 32.98% |
生物液化天然气(bio-LNG)是一种可再生且永续的液化天然气(LNG)型态,由有机或可再生资源生产。透过精製过程,从沼气中去除二氧化碳等杂质,从而产生具有与传统液化天然气相似的特性的产品。由于生物液化天然气是由可再生资源生产的,与传统石化燃料液化天然气相比,它可以显着减少温室气体排放,使其成为传统液化天然气的环保替代品。与常规液化天然气一样,它可用于多种用途,包括运输、发电和暖气。由于碳中和努力以及政府不断增加鼓励生物液化天然气采用的奖励和补贴,对生物液化天然气的需求正在增加。然而,建立生产工厂的初始资本投资较高以及液化天然气处理和运输的复杂性阻碍了市场成长。此外,沼气升级、液化技术的进步以及模组化和可扩展的生物液化天然气生产工厂的市场开拓正在为市场提供重大的成长机会。
区域洞察
在美洲地区,对生物液化天然气的需求主要由运输部门推动,重点是减少重型车辆的二氧化碳排放。该地区正在对生物液化天然气生产设施和燃料供应基础设施进行大量投资。客户受到政府激励措施和可再生燃料标准 (RFS) 下可可再生燃料识别号 (RIN) 可用性的影响。欧盟国家在采用生物液化天然气方面处于领先地位,特别是在严格排放法规推动的航运和重型运输领域。欧盟的绿色新政承诺和一系列国家级奖励正在刺激广泛的研究和投资。客户受到环境合规性和降低长期燃料成本的潜在经济效益的激励。中东传统上以其石油和天然气蕴藏量而闻名,但人们对包括生物液化天然气在内的替代燃料越来越感兴趣。在能源来源多元化和减少与能源出口相关的碳排放的双重愿望的推动下,该地区开始投资研究和先导计画。在该地区,客户的购买行为仍处于起步阶段并且持续发展。亚太地区正在进行研究倡议,以探索新的原材料来源并提高业务扩充性。对生物液化天然气的需求正在增加,特别是在印度、中国和日本,这些国家对新计画和法律规范进行了大量投资。
FPNV定位矩阵
FPNV定位矩阵对于评估生物液化天然气市场至关重要。我们检视与业务策略和产品满意度相关的关键指标,以对供应商进行全面评估。这种深入的分析使用户能够根据自己的要求做出明智的决策。根据评估,供应商被分为四个成功程度不同的像限:前沿(F)、探路者(P)、利基(N)和重要(V)。
市场占有率分析
市场占有率分析是一种综合工具,可以对生物液化天然气市场供应商的现状进行深入而详细的研究。全面比较和分析供应商在整体收益、基本客群和其他关键指标方面的贡献,以便更好地了解公司的绩效及其在争夺市场占有率时面临的挑战。此外,该分析还提供了对该行业竞争特征的宝贵考察,包括在研究基准年观察到的累积、分散主导地位和合併特征等因素。这种详细程度的提高使供应商能够做出更明智的决策并制定有效的策略,从而在市场上获得竞争优势。
本报告在以下方面提供了宝贵的见解:
1-市场渗透率:提供有关主要企业所服务的市场的全面资讯。
2-市场开拓:我们深入研究利润丰厚的新兴市场,并分析它们在成熟细分市场中的渗透率。
3- 市场多元化:提供有关新产品发布、开拓地区、最新发展和投资的详细资讯。
4-竞争力评估与资讯:对主要企业的市场占有率、策略、产品、认证、监管状况、专利状况、製造能力等进行全面评估。
5- 产品开发与创新:提供对未来技术、研发活动和突破性产品开发的见解。
本报告解决了以下关键问题:
1-生物液化天然气市场的市场规模与预测是多少?
2-生物液化天然气市场预测期间需要考虑投资的产品、细分市场、应用和领域有哪些?
3-生物液化天然气市场的技术趋势和法律规范是什么?
4-生物液化天然气市场主要供应商的市场占有率为何?
5-进入生物LNG市场的合适型态和策略手段是什么?
目录
第一章 前言
第二章调查方法
第三章执行摘要
第四章市场概况
第五章市场洞察
- 市场动态
- 促进因素
- 政府促进生质燃料生产的倡议
- 人们越来越认识到使用生物基燃料的环境效益
- 出货和运输活动增加
- 抑制因素
- 昂贵的生质燃料和生物液化天然气
- 机会
- 液化技术的进展
- 安装生质燃料生产厂以及私人和公共公司之间的伙伴关係
- 任务
- 缺乏生物甲烷生产的监管标准
- 促进因素
- 市场区隔分析
- 来源类型:城市废弃物和家庭有机废弃物大量用于生产生物液化天然气
- 应用:扩大生物液化天然气作为运输燃料的采用
- 市场趋势分析
- 高通膨的累积效应
- 波特五力分析
- 价值炼和关键路径分析
- 法律规范
第六章按来源类型分類的生物液化天然气市场
- 农业废弃物
- 都市废弃物
- 有机生活废弃物
- 有机工业废弃物
第七章生物液化天然气市场:依应用分类
- 发电
- 运输燃料
第八章北美和南美生物液化天然气市场
- 阿根廷
- 巴西
- 加拿大
- 墨西哥
- 美国
第九章亚太地区生物LNG市场
- 澳洲
- 中国
- 印度
- 印尼
- 日本
- 马来西亚
- 菲律宾
- 新加坡
- 韩国
- 台湾
- 泰国
- 越南
第十章欧洲、中东和非洲生物液化天然气市场
- 丹麦
- 埃及
- 芬兰
- 法国
- 德国
- 以色列
- 义大利
- 荷兰
- 奈及利亚
- 挪威
- 波兰
- 卡达
- 俄罗斯
- 沙乌地阿拉伯
- 南非
- 西班牙
- 瑞典
- 瑞士
- 土耳其
- 阿拉伯聯合大公国
- 英国
第十一章竞争形势
- FPNV定位矩阵
- 市场占有率分析:主要企业
- 主要企业竞争情境分析
- 新产品发布和功能增强
- 奖项/奖励/扩展
第12章竞争产品组合
- 主要公司简介
- Air Liquide SA
- Axegaz T&T
- BoxLNG Pvt. Ltd.
- Bright Renewables BV
- Cryonorm BV
- DBG Group BV
- DMT Environmental Technology
- Flogas Britain Ltd.
- Hitachi Zosen Inova AG
- Linde PLC
- MEGA as
- Nordsol
- Pentair PLC
- RUHE Biogas Service GmbH
- Shell PLC
- Titan LNG
- TotalEnergies
- Wartsila Corporation
- 主要产品系列
第十三章附录
- 讨论指南
- 关于许可证和定价
[187 Pages Report] The Bio-LNG Market size was estimated at USD 2.12 billion in 2023 and expected to reach USD 2.80 billion in 2024, at a CAGR 32.98% to reach USD 15.60 billion by 2030.
Global Bio-LNG Market
| KEY MARKET STATISTICS | |
|---|---|
| Base Year [2023] | USD 2.12 billion |
| Estimated Year [2024] | USD 2.80 billion |
| Forecast Year [2030] | USD 15.60 billion |
| CAGR (%) | 32.98% |
Bio-liquefied natural gas (Bio-LNG) is a renewable and sustainable form of liquefied natural gas (LNG) produced from organic or renewable sources. It's derived from biogas through a purification process that removes impurities such as carbon dioxide and other contaminants, resulting in a product that shares similar properties with traditional LNG. Bio-LNG is an environmentally friendly alternative to conventional LNG, as it's produced from renewable sources, significantly reducing greenhouse gas emissions compared to traditional fossil fuel-based LNG. It can be used similarly to regular LNG in various applications, including transportation, power generation, and heating. The increase in carbon neutrality initiatives and government incentives and subsidies fostering the adoption of Bio-LNG has increased the demand for bio-LNG. However, the high initial capital investment for production plant setup and complexities associated with the handling and transportation of LNG hinder market growth. Furthermore, advancements in biogas upgrading and liquefaction technologies and the development of modular and scalable bio-LNG production plants provide significant growth opportunities for the market.
Regional Insights
In the Americas region, the demand for Bio-LNG is primarily driven by the transportation sector, emphasizing reducing carbon emissions from heavy-duty vehicles. The region has seen substantial investments in bio-LNG production facilities and fueling infrastructure. Customers are influenced by government incentives and the availability of renewable identification numbers (RINs) under the Renewable Fuel Standard (RFS). EU countries are leading in adopting bio-LNG, particularly in the maritime and heavy-duty transport sectors, fostered by stringent emission regulations. The EU's commitment to the Green Deal and various state-level incentives have spurred significant research and investment. Customers are motivated by both environmental compliance and the potential economic benefits of lower long-term fuel costs. While the Middle East is traditionally known for its oil and gas reserves, there is a growing interest in alternative fuels, including bio-LNG. The region is beginning to invest in research and pilot projects, driven by the dual desire to diversify energy sources and reduce the carbon footprint of its energy exports. Customer purchasing behaviors are still nascent and evolving in this region. In the APAC region, research initiatives explore novel feedstock sources and enhance bio-LNG operations' scalability. Considerable investment flows into new projects, particularly in India, China, and Japan, with supportive regulatory frameworks are increasing the demand for bio-LNG.
FPNV Positioning Matrix
The FPNV Positioning Matrix is pivotal in evaluating the Bio-LNG Market. It offers a comprehensive assessment of vendors, examining key metrics related to Business Strategy and Product Satisfaction. This in-depth analysis empowers users to make well-informed decisions aligned with their requirements. Based on the evaluation, the vendors are then categorized into four distinct quadrants representing varying levels of success: Forefront (F), Pathfinder (P), Niche (N), or Vital (V).
Market Share Analysis
The Market Share Analysis is a comprehensive tool that provides an insightful and in-depth examination of the current state of vendors in the Bio-LNG Market. By meticulously comparing and analyzing vendor contributions in terms of overall revenue, customer base, and other key metrics, we can offer companies a greater understanding of their performance and the challenges they face when competing for market share. Additionally, this analysis provides valuable insights into the competitive nature of the sector, including factors such as accumulation, fragmentation dominance, and amalgamation traits observed over the base year period studied. With this expanded level of detail, vendors can make more informed decisions and devise effective strategies to gain a competitive edge in the market.
Key Company Profiles
The report delves into recent significant developments in the Bio-LNG Market, highlighting leading vendors and their innovative profiles. These include Air Liquide S.A., Axegaz T&T, BoxLNG Pvt. Ltd., Bright Renewables B.V., Cryonorm BV, DBG Group B.V., DMT Environmental Technology, Flogas Britain Ltd., Hitachi Zosen Inova AG, Linde PLC, MEGA a.s., Nordsol, Pentair PLC, RUHE Biogas Service GmbH, Shell PLC, Titan LNG, TotalEnergies, and Wartsila Corporation.
Market Segmentation & Coverage
This research report categorizes the Bio-LNG Market to forecast the revenues and analyze trends in each of the following sub-markets:
- Source Type
- Agricultural Waste
- Municipal Waste
- Organic Household Waste
- Organic Industrial Waste
- Application
- Power Generation
- Transportation Fuel
- Region
- Americas
- Argentina
- Brazil
- Canada
- Mexico
- United States
- California
- Florida
- Illinois
- New York
- Ohio
- Pennsylvania
- Texas
- Asia-Pacific
- Australia
- China
- India
- Indonesia
- Japan
- Malaysia
- Philippines
- Singapore
- South Korea
- Taiwan
- Thailand
- Vietnam
- Europe, Middle East & Africa
- Denmark
- Egypt
- Finland
- France
- Germany
- Israel
- Italy
- Netherlands
- Nigeria
- Norway
- Poland
- Qatar
- Russia
- Saudi Arabia
- South Africa
- Spain
- Sweden
- Switzerland
- Turkey
- United Arab Emirates
- United Kingdom
- Americas
The report offers valuable insights on the following aspects:
1. Market Penetration: It presents comprehensive information on the market provided by key players.
2. Market Development: It delves deep into lucrative emerging markets and analyzes the penetration across mature market segments.
3. Market Diversification: It provides detailed information on new product launches, untapped geographic regions, recent developments, and investments.
4. Competitive Assessment & Intelligence: It conducts an exhaustive assessment of market shares, strategies, products, certifications, regulatory approvals, patent landscape, and manufacturing capabilities of the leading players.
5. Product Development & Innovation: It offers intelligent insights on future technologies, R&D activities, and breakthrough product developments.
The report addresses key questions such as:
1. What is the market size and forecast of the Bio-LNG Market?
2. Which products, segments, applications, and areas should one consider investing in over the forecast period in the Bio-LNG Market?
3. What are the technology trends and regulatory frameworks in the Bio-LNG Market?
4. What is the market share of the leading vendors in the Bio-LNG Market?
5. Which modes and strategic moves are suitable for entering the Bio-LNG Market?
Table of Contents
1. Preface
- 1.1. Objectives of the Study
- 1.2. Market Segmentation & Coverage
- 1.3. Years Considered for the Study
- 1.4. Currency & Pricing
- 1.5. Language
- 1.6. Limitations
- 1.7. Assumptions
- 1.8. Stakeholders
2. Research Methodology
- 2.1. Define: Research Objective
- 2.2. Determine: Research Design
- 2.3. Prepare: Research Instrument
- 2.4. Collect: Data Source
- 2.5. Analyze: Data Interpretation
- 2.6. Formulate: Data Verification
- 2.7. Publish: Research Report
- 2.8. Repeat: Report Update
3. Executive Summary
4. Market Overview
- 4.1. Introduction
- 4.2. Bio-LNG Market, by Region
5. Market Insights
- 5.1. Market Dynamics
- 5.1.1. Drivers
- 5.1.1.1. Government initiatives to promote biofuel production
- 5.1.1.2. Growing awareness about the environmental benefits of utilizing bio-based fuels
- 5.1.1.3. Rising number of shipping and transportation activities
- 5.1.2. Restraints
- 5.1.2.1. High cost of biofuels and bio-LNG
- 5.1.3. Opportunities
- 5.1.3.1. Advancements in liquefaction technology
- 5.1.3.2. Installation of biofuel production plants and partnerships between private and public players
- 5.1.4. Challenges
- 5.1.4.1. Lack of regulatory standards for biomethane production
- 5.1.1. Drivers
- 5.2. Market Segmentation Analysis
- 5.2.1. Source Type: Significant use of municipal and organic household waste for the production of Bio-LNG
- 5.2.2. Application: Growing adoption of Bio-LNG for transportation fuel
- 5.3. Market Trend Analysis
- 5.4. Cumulative Impact of High Inflation
- 5.5. Porter's Five Forces Analysis
- 5.5.1. Threat of New Entrants
- 5.5.2. Threat of Substitutes
- 5.5.3. Bargaining Power of Customers
- 5.5.4. Bargaining Power of Suppliers
- 5.5.5. Industry Rivalry
- 5.6. Value Chain & Critical Path Analysis
- 5.7. Regulatory Framework
6. Bio-LNG Market, by Source Type
- 6.1. Introduction
- 6.2. Agricultural Waste
- 6.3. Municipal Waste
- 6.4. Organic Household Waste
- 6.5. Organic Industrial Waste
7. Bio-LNG Market, by Application
- 7.1. Introduction
- 7.2. Power Generation
- 7.3. Transportation Fuel
8. Americas Bio-LNG Market
- 8.1. Introduction
- 8.2. Argentina
- 8.3. Brazil
- 8.4. Canada
- 8.5. Mexico
- 8.6. United States
9. Asia-Pacific Bio-LNG Market
- 9.1. Introduction
- 9.2. Australia
- 9.3. China
- 9.4. India
- 9.5. Indonesia
- 9.6. Japan
- 9.7. Malaysia
- 9.8. Philippines
- 9.9. Singapore
- 9.10. South Korea
- 9.11. Taiwan
- 9.12. Thailand
- 9.13. Vietnam
10. Europe, Middle East & Africa Bio-LNG Market
- 10.1. Introduction
- 10.2. Denmark
- 10.3. Egypt
- 10.4. Finland
- 10.5. France
- 10.6. Germany
- 10.7. Israel
- 10.8. Italy
- 10.9. Netherlands
- 10.10. Nigeria
- 10.11. Norway
- 10.12. Poland
- 10.13. Qatar
- 10.14. Russia
- 10.15. Saudi Arabia
- 10.16. South Africa
- 10.17. Spain
- 10.18. Sweden
- 10.19. Switzerland
- 10.20. Turkey
- 10.21. United Arab Emirates
- 10.22. United Kingdom
11. Competitive Landscape
- 11.1. FPNV Positioning Matrix
- 11.2. Market Share Analysis, By Key Player
- 11.3. Competitive Scenario Analysis, By Key Player
- 11.3.1. New Product Launch & Enhancement
- 11.3.1.1. Germany's Largest Bio-LNG Plant Ready for Launch
- 11.3.2. Award, Recognition, & Expansion
- 11.3.2.1. Germany's Ruhe Boosts bio-LNG Production
- 11.3.2.2. Biokraft Commissions World's Largest Biomethane Liquefaction Unit
- 11.3.1. New Product Launch & Enhancement
12. Competitive Portfolio
- 12.1. Key Company Profiles
- 12.1.1. Air Liquide S.A.
- 12.1.2. Axegaz T&T
- 12.1.3. BoxLNG Pvt. Ltd.
- 12.1.4. Bright Renewables B.V.
- 12.1.5. Cryonorm BV
- 12.1.6. DBG Group B.V.
- 12.1.7. DMT Environmental Technology
- 12.1.8. Flogas Britain Ltd.
- 12.1.9. Hitachi Zosen Inova AG
- 12.1.10. Linde PLC
- 12.1.11. MEGA a.s.
- 12.1.12. Nordsol
- 12.1.13. Pentair PLC
- 12.1.14. RUHE Biogas Service GmbH
- 12.1.15. Shell PLC
- 12.1.16. Titan LNG
- 12.1.17. TotalEnergies
- 12.1.18. Wartsila Corporation
- 12.2. Key Product Portfolio
13. Appendix
- 13.1. Discussion Guide
- 13.2. License & Pricing
LIST OF FIGURES
- FIGURE 1. BIO-LNG MARKET RESEARCH PROCESS
- FIGURE 2. BIO-LNG MARKET SIZE, 2023 VS 2030
- FIGURE 3. BIO-LNG MARKET SIZE, 2018-2030 (USD MILLION)
- FIGURE 4. BIO-LNG MARKET SIZE, BY REGION, 2023 VS 2030 (%)
- FIGURE 5. BIO-LNG MARKET SIZE, BY REGION, 2023 VS 2024 VS 2030 (USD MILLION)
- FIGURE 6. BIO-LNG MARKET DYNAMICS
- FIGURE 7. BIO-LNG MARKET SIZE, BY SOURCE TYPE, 2023 VS 2030 (%)
- FIGURE 8. BIO-LNG MARKET SIZE, BY SOURCE TYPE, 2023 VS 2024 VS 2030 (USD MILLION)
- FIGURE 9. BIO-LNG MARKET SIZE, BY APPLICATION, 2023 VS 2030 (%)
- FIGURE 10. BIO-LNG MARKET SIZE, BY APPLICATION, 2023 VS 2024 VS 2030 (USD MILLION)
- FIGURE 11. AMERICAS BIO-LNG MARKET SIZE, BY COUNTRY, 2023 VS 2030 (%)
- FIGURE 12. AMERICAS BIO-LNG MARKET SIZE, BY COUNTRY, 2023 VS 2024 VS 2030 (USD MILLION)
- FIGURE 13. UNITED STATES BIO-LNG MARKET SIZE, BY STATE, 2023 VS 2030 (%)
- FIGURE 14. UNITED STATES BIO-LNG MARKET SIZE, BY STATE, 2023 VS 2024 VS 2030 (USD MILLION)
- FIGURE 15. ASIA-PACIFIC BIO-LNG MARKET SIZE, BY COUNTRY, 2023 VS 2030 (%)
- FIGURE 16. ASIA-PACIFIC BIO-LNG MARKET SIZE, BY COUNTRY, 2023 VS 2024 VS 2030 (USD MILLION)
- FIGURE 17. EUROPE, MIDDLE EAST & AFRICA BIO-LNG MARKET SIZE, BY COUNTRY, 2023 VS 2030 (%)
- FIGURE 18. EUROPE, MIDDLE EAST & AFRICA BIO-LNG MARKET SIZE, BY COUNTRY, 2023 VS 2024 VS 2030 (USD MILLION)
- FIGURE 19. BIO-LNG MARKET, FPNV POSITIONING MATRIX, 2023
- FIGURE 20. BIO-LNG MARKET SHARE, BY KEY PLAYER, 2023
LIST OF TABLES
- TABLE 1. BIO-LNG MARKET SEGMENTATION & COVERAGE
- TABLE 2. UNITED STATES DOLLAR EXCHANGE RATE, 2018-2023
- TABLE 3. BIO-LNG MARKET SIZE, 2018-2030 (USD MILLION)
- TABLE 4. GLOBAL BIO-LNG MARKET SIZE, BY REGION, 2018-2030 (USD MILLION)
- TABLE 5. BIO-LNG MARKET SIZE, BY SOURCE TYPE, 2018-2030 (USD MILLION)
- TABLE 6. BIO-LNG MARKET SIZE, BY AGRICULTURAL WASTE, BY REGION, 2018-2030 (USD MILLION)
- TABLE 7. BIO-LNG MARKET SIZE, BY MUNICIPAL WASTE, BY REGION, 2018-2030 (USD MILLION)
- TABLE 8. BIO-LNG MARKET SIZE, BY ORGANIC HOUSEHOLD WASTE, BY REGION, 2018-2030 (USD MILLION)
- TABLE 9. BIO-LNG MARKET SIZE, BY ORGANIC INDUSTRIAL WASTE, BY REGION, 2018-2030 (USD MILLION)
- TABLE 10. BIO-LNG MARKET SIZE, BY APPLICATION, 2018-2030 (USD MILLION)
- TABLE 11. BIO-LNG MARKET SIZE, BY POWER GENERATION, BY REGION, 2018-2030 (USD MILLION)
- TABLE 12. BIO-LNG MARKET SIZE, BY TRANSPORTATION FUEL, BY REGION, 2018-2030 (USD MILLION)
- TABLE 13. AMERICAS BIO-LNG MARKET SIZE, BY SOURCE TYPE, 2018-2030 (USD MILLION)
- TABLE 14. AMERICAS BIO-LNG MARKET SIZE, BY APPLICATION, 2018-2030 (USD MILLION)
- TABLE 15. AMERICAS BIO-LNG MARKET SIZE, BY COUNTRY, 2018-2030 (USD MILLION)
- TABLE 16. ARGENTINA BIO-LNG MARKET SIZE, BY SOURCE TYPE, 2018-2030 (USD MILLION)
- TABLE 17. ARGENTINA BIO-LNG MARKET SIZE, BY APPLICATION, 2018-2030 (USD MILLION)
- TABLE 18. BRAZIL BIO-LNG MARKET SIZE, BY SOURCE TYPE, 2018-2030 (USD MILLION)
- TABLE 19. BRAZIL BIO-LNG MARKET SIZE, BY APPLICATION, 2018-2030 (USD MILLION)
- TABLE 20. CANADA BIO-LNG MARKET SIZE, BY SOURCE TYPE, 2018-2030 (USD MILLION)
- TABLE 21. CANADA BIO-LNG MARKET SIZE, BY APPLICATION, 2018-2030 (USD MILLION)
- TABLE 22. MEXICO BIO-LNG MARKET SIZE, BY SOURCE TYPE, 2018-2030 (USD MILLION)
- TABLE 23. MEXICO BIO-LNG MARKET SIZE, BY APPLICATION, 2018-2030 (USD MILLION)
- TABLE 24. UNITED STATES BIO-LNG MARKET SIZE, BY SOURCE TYPE, 2018-2030 (USD MILLION)
- TABLE 25. UNITED STATES BIO-LNG MARKET SIZE, BY APPLICATION, 2018-2030 (USD MILLION)
- TABLE 26. UNITED STATES BIO-LNG MARKET SIZE, BY STATE, 2018-2030 (USD MILLION)
- TABLE 27. ASIA-PACIFIC BIO-LNG MARKET SIZE, BY SOURCE TYPE, 2018-2030 (USD MILLION)
- TABLE 28. ASIA-PACIFIC BIO-LNG MARKET SIZE, BY APPLICATION, 2018-2030 (USD MILLION)
- TABLE 29. ASIA-PACIFIC BIO-LNG MARKET SIZE, BY COUNTRY, 2018-2030 (USD MILLION)
- TABLE 30. AUSTRALIA BIO-LNG MARKET SIZE, BY SOURCE TYPE, 2018-2030 (USD MILLION)
- TABLE 31. AUSTRALIA BIO-LNG MARKET SIZE, BY APPLICATION, 2018-2030 (USD MILLION)
- TABLE 32. CHINA BIO-LNG MARKET SIZE, BY SOURCE TYPE, 2018-2030 (USD MILLION)
- TABLE 33. CHINA BIO-LNG MARKET SIZE, BY APPLICATION, 2018-2030 (USD MILLION)
- TABLE 34. INDIA BIO-LNG MARKET SIZE, BY SOURCE TYPE, 2018-2030 (USD MILLION)
- TABLE 35. INDIA BIO-LNG MARKET SIZE, BY APPLICATION, 2018-2030 (USD MILLION)
- TABLE 36. INDONESIA BIO-LNG MARKET SIZE, BY SOURCE TYPE, 2018-2030 (USD MILLION)
- TABLE 37. INDONESIA BIO-LNG MARKET SIZE, BY APPLICATION, 2018-2030 (USD MILLION)
- TABLE 38. JAPAN BIO-LNG MARKET SIZE, BY SOURCE TYPE, 2018-2030 (USD MILLION)
- TABLE 39. JAPAN BIO-LNG MARKET SIZE, BY APPLICATION, 2018-2030 (USD MILLION)
- TABLE 40. MALAYSIA BIO-LNG MARKET SIZE, BY SOURCE TYPE, 2018-2030 (USD MILLION)
- TABLE 41. MALAYSIA BIO-LNG MARKET SIZE, BY APPLICATION, 2018-2030 (USD MILLION)
- TABLE 42. PHILIPPINES BIO-LNG MARKET SIZE, BY SOURCE TYPE, 2018-2030 (USD MILLION)
- TABLE 43. PHILIPPINES BIO-LNG MARKET SIZE, BY APPLICATION, 2018-2030 (USD MILLION)
- TABLE 44. SINGAPORE BIO-LNG MARKET SIZE, BY SOURCE TYPE, 2018-2030 (USD MILLION)
- TABLE 45. SINGAPORE BIO-LNG MARKET SIZE, BY APPLICATION, 2018-2030 (USD MILLION)
- TABLE 46. SOUTH KOREA BIO-LNG MARKET SIZE, BY SOURCE TYPE, 2018-2030 (USD MILLION)
- TABLE 47. SOUTH KOREA BIO-LNG MARKET SIZE, BY APPLICATION, 2018-2030 (USD MILLION)
- TABLE 48. TAIWAN BIO-LNG MARKET SIZE, BY SOURCE TYPE, 2018-2030 (USD MILLION)
- TABLE 49. TAIWAN BIO-LNG MARKET SIZE, BY APPLICATION, 2018-2030 (USD MILLION)
- TABLE 50. THAILAND BIO-LNG MARKET SIZE, BY SOURCE TYPE, 2018-2030 (USD MILLION)
- TABLE 51. THAILAND BIO-LNG MARKET SIZE, BY APPLICATION, 2018-2030 (USD MILLION)
- TABLE 52. VIETNAM BIO-LNG MARKET SIZE, BY SOURCE TYPE, 2018-2030 (USD MILLION)
- TABLE 53. VIETNAM BIO-LNG MARKET SIZE, BY APPLICATION, 2018-2030 (USD MILLION)
- TABLE 54. EUROPE, MIDDLE EAST & AFRICA BIO-LNG MARKET SIZE, BY SOURCE TYPE, 2018-2030 (USD MILLION)
- TABLE 55. EUROPE, MIDDLE EAST & AFRICA BIO-LNG MARKET SIZE, BY APPLICATION, 2018-2030 (USD MILLION)
- TABLE 56. EUROPE, MIDDLE EAST & AFRICA BIO-LNG MARKET SIZE, BY COUNTRY, 2018-2030 (USD MILLION)
- TABLE 57. DENMARK BIO-LNG MARKET SIZE, BY SOURCE TYPE, 2018-2030 (USD MILLION)
- TABLE 58. DENMARK BIO-LNG MARKET SIZE, BY APPLICATION, 2018-2030 (USD MILLION)
- TABLE 59. EGYPT BIO-LNG MARKET SIZE, BY SOURCE TYPE, 2018-2030 (USD MILLION)
- TABLE 60. EGYPT BIO-LNG MARKET SIZE, BY APPLICATION, 2018-2030 (USD MILLION)
- TABLE 61. FINLAND BIO-LNG MARKET SIZE, BY SOURCE TYPE, 2018-2030 (USD MILLION)
- TABLE 62. FINLAND BIO-LNG MARKET SIZE, BY APPLICATION, 2018-2030 (USD MILLION)
- TABLE 63. FRANCE BIO-LNG MARKET SIZE, BY SOURCE TYPE, 2018-2030 (USD MILLION)
- TABLE 64. FRANCE BIO-LNG MARKET SIZE, BY APPLICATION, 2018-2030 (USD MILLION)
- TABLE 65. GERMANY BIO-LNG MARKET SIZE, BY SOURCE TYPE, 2018-2030 (USD MILLION)
- TABLE 66. GERMANY BIO-LNG MARKET SIZE, BY APPLICATION, 2018-2030 (USD MILLION)
- TABLE 67. ISRAEL BIO-LNG MARKET SIZE, BY SOURCE TYPE, 2018-2030 (USD MILLION)
- TABLE 68. ISRAEL BIO-LNG MARKET SIZE, BY APPLICATION, 2018-2030 (USD MILLION)
- TABLE 69. ITALY BIO-LNG MARKET SIZE, BY SOURCE TYPE, 2018-2030 (USD MILLION)
- TABLE 70. ITALY BIO-LNG MARKET SIZE, BY APPLICATION, 2018-2030 (USD MILLION)
- TABLE 71. NETHERLANDS BIO-LNG MARKET SIZE, BY SOURCE TYPE, 2018-2030 (USD MILLION)
- TABLE 72. NETHERLANDS BIO-LNG MARKET SIZE, BY APPLICATION, 2018-2030 (USD MILLION)
- TABLE 73. NIGERIA BIO-LNG MARKET SIZE, BY SOURCE TYPE, 2018-2030 (USD MILLION)
- TABLE 74. NIGERIA BIO-LNG MARKET SIZE, BY APPLICATION, 2018-2030 (USD MILLION)
- TABLE 75. NORWAY BIO-LNG MARKET SIZE, BY SOURCE TYPE, 2018-2030 (USD MILLION)
- TABLE 76. NORWAY BIO-LNG MARKET SIZE, BY APPLICATION, 2018-2030 (USD MILLION)
- TABLE 77. POLAND BIO-LNG MARKET SIZE, BY SOURCE TYPE, 2018-2030 (USD MILLION)
- TABLE 78. POLAND BIO-LNG MARKET SIZE, BY APPLICATION, 2018-2030 (USD MILLION)
- TABLE 79. QATAR BIO-LNG MARKET SIZE, BY SOURCE TYPE, 2018-2030 (USD MILLION)
- TABLE 80. QATAR BIO-LNG MARKET SIZE, BY APPLICATION, 2018-2030 (USD MILLION)
- TABLE 81. RUSSIA BIO-LNG MARKET SIZE, BY SOURCE TYPE, 2018-2030 (USD MILLION)
- TABLE 82. RUSSIA BIO-LNG MARKET SIZE, BY APPLICATION, 2018-2030 (USD MILLION)
- TABLE 83. SAUDI ARABIA BIO-LNG MARKET SIZE, BY SOURCE TYPE, 2018-2030 (USD MILLION)
- TABLE 84. SAUDI ARABIA BIO-LNG MARKET SIZE, BY APPLICATION, 2018-2030 (USD MILLION)
- TABLE 85. SOUTH AFRICA BIO-LNG MARKET SIZE, BY SOURCE TYPE, 2018-2030 (USD MILLION)
- TABLE 86. SOUTH AFRICA BIO-LNG MARKET SIZE, BY APPLICATION, 2018-2030 (USD MILLION)
- TABLE 87. SPAIN BIO-LNG MARKET SIZE, BY SOURCE TYPE, 2018-2030 (USD MILLION)
- TABLE 88. SPAIN BIO-LNG MARKET SIZE, BY APPLICATION, 2018-2030 (USD MILLION)
- TABLE 89. SWEDEN BIO-LNG MARKET SIZE, BY SOURCE TYPE, 2018-2030 (USD MILLION)
- TABLE 90. SWEDEN BIO-LNG MARKET SIZE, BY APPLICATION, 2018-2030 (USD MILLION)
- TABLE 91. SWITZERLAND BIO-LNG MARKET SIZE, BY SOURCE TYPE, 2018-2030 (USD MILLION)
- TABLE 92. SWITZERLAND BIO-LNG MARKET SIZE, BY APPLICATION, 2018-2030 (USD MILLION)
- TABLE 93. TURKEY BIO-LNG MARKET SIZE, BY SOURCE TYPE, 2018-2030 (USD MILLION)
- TABLE 94. TURKEY BIO-LNG MARKET SIZE, BY APPLICATION, 2018-2030 (USD MILLION)
- TABLE 95. UNITED ARAB EMIRATES BIO-LNG MARKET SIZE, BY SOURCE TYPE, 2018-2030 (USD MILLION)
- TABLE 96. UNITED ARAB EMIRATES BIO-LNG MARKET SIZE, BY APPLICATION, 2018-2030 (USD MILLION)
- TABLE 97. UNITED KINGDOM BIO-LNG MARKET SIZE, BY SOURCE TYPE, 2018-2030 (USD MILLION)
- TABLE 98. UNITED KINGDOM BIO-LNG MARKET SIZE, BY APPLICATION, 2018-2030 (USD MILLION)
- TABLE 99. BIO-LNG MARKET, FPNV POSITIONING MATRIX, 2023
- TABLE 100. BIO-LNG MARKET SHARE, BY KEY PLAYER, 2023
- TABLE 101. BIO-LNG MARKET LICENSE & PRICING
 2024-2032 年按技术(液化、再气化)、最终用途产业(住宅、商业、工业)及地区分類的规划液化天然气市场
 C 型储罐市场规模和预测、全球和区域份额、趋势和成长机会分析报告范围:按储罐类型、应用、最终用户和地理位置
 亚太生物液化天然气市场:分析与预测(2023-2032)
 欧洲生物液化天然气市场-分析与预测(2023-2032)
 2024年液化天然气压缩机全球市场报告
 液化天然气市场:按类型、应用分类 - 2024-2030 年全球预测
 2024 年液化天然气全球市场报告
 液化天然气卡车的全球市场(2024年版):金额、数量、卡车类型、重量类型、应用、地区、国家、市场分析、考察进行分析(2019-2029)
 LNG长期契约动向的检讨分析:各地区,各契约,各企业,2022年
 全球生物液化天然气市场 2023-2030