


 |
市场调查报告书
商品编码
1413912
数位功率计市场:按阶段和应用分列 - 2024 年至 2030 年全球预测Digital Power Meters Market by Phase (Single Phase, Three Phase), Application (Commercial, Industrial, Residential) - Global Forecast 2024-2030 |
||||||
※ 本网页内容可能与最新版本有所差异。详细情况请与我们联繫。
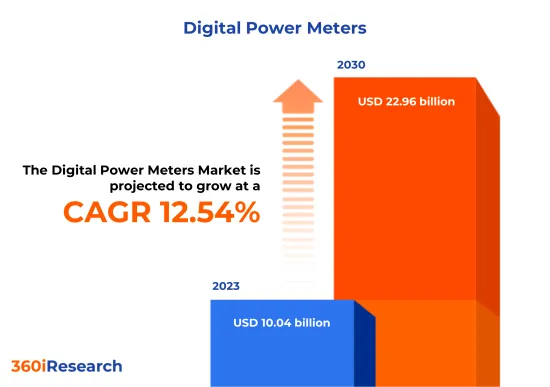
预计2023年数位电錶市场规模为100.4亿美元,2024年达112.6亿美元,2030年预计将达229.6亿美元,复合年增长率为12.54%。
全球数位功率计市场
| 主要市场统计 | |
|---|---|
| 基准年[2023] | 100.4亿美元 |
| 预测年份 [2024] | 112.6亿美元 |
| 预测年份 [2030] | 229.6亿美元 |
| 复合年增长率(%) | 12.54% |
数位功率计是一种先进的测量设备,可记录住宅、企业或电动设备消耗的电力。与先前的类比仪表不同,这些仪表采用数位技术来收集、处理和显示资料。它以其高精度、高可靠性以及能够提供有关一段时间内的电力使用情况的详细资讯闻名。这些仪表通常具有数位显示器,并且可以结合先进的功能,例如使用时间收费、资料通讯和远端读取功能。您可以监控各种电气参数,例如电压、电流、功率因数和千瓦时 (kWh)消费量。节能意识的增强和智慧家庭的兴起,以及政府在能源管理和智慧电网技术方面的倡议,正在推动数位电錶的采用。然而,资料安全问题和数位仪表的复杂功能以及较高的初始成本可能会阻碍市场成长。然而,先进能源管理软体的开发和先进电池储存整合的研究预计将为市场成长创造机会。
区域洞察
由于能源效率和电网现代化的共同努力,美洲对数位电錶表现出强劲的需求。这些国家由于拥有大量智慧家庭且正向智慧电网转型,已成为数位电錶技术的重要消费者。这些地区的客户倾向于提供即时监控和能源管理的整合解决方案。美国智慧电网投资津贴(SGIG) 和加拿大智慧电网计画等倡议凸显了该地区对加强电网基础设施和推动对先进仪器仪表需求的重视。欧洲、中东和非洲地区的数位功率计呈现出多元化的市场形势。欧盟 (EU) 对数位化和永续能源的推动正在极大地加速创新测量解决方案的采用。由于节能和高效资源管理的需求,欧盟国家正积极采用创新的电网技术。客户喜欢符合严格监管标准并提供资料安全的产品。基础设施和智慧城市计划的成长导致中东地区对先进仪器基础设施 (AMI) 的接受度不断提高。由于电力监控和减少盗窃的需要,非洲的意识和采用率正在提高。一些非洲国家现在正在利用行动技术整合到预付式数位电錶解决方案中。亚太地区数位电錶市场是由需要高效电源管理系统的大型基础设施计划所推动的。此外,该地区国家注重节能和技术先进的基础设施,客户偏好偏向高精度和耐用的功率计,这也对市场需求做出了重大贡献。
FPNV定位矩阵
FPNV定位矩阵对于评估数位功率计市场至关重要。我们检视与业务策略和产品满意度相关的关键指标,以对供应商进行全面评估。这种深入的分析使用户能够根据自己的要求做出明智的决策。根据评估,供应商被分为四个成功程度不同的像限。最前线 (F)、探路者 (P)、利基 (N) 和重要 (V)。
市场占有率分析
市场占有率分析是一种综合工具,可以对数位功率计市场供应商的现状进行深入而详细的研究。全面比较和分析供应商在整体收益、基本客群和其他关键指标方面的贡献,以便更好地了解公司的绩效及其在争夺市场占有率时面临的挑战。此外,该分析还提供了对该行业竞争特征的宝贵考察,包括在研究基准年观察到的累积、分散主导地位和合併特征等因素。详细程度的提高使供应商能够做出更明智的决策并制定有效的策略,从而在市场上获得竞争优势。
该报告对以下几个方面提供了宝贵的见解:
1-市场渗透率:提供有关主要企业所服务的市场的全面资讯。
2-市场开拓:我们深入研究利润丰厚的新兴市场,并分析它们在成熟细分市场中的渗透率。
3- 市场多元化:提供有关新产品发布、开拓地区、最新发展和投资的详细资讯。
4-竞争力评估与资讯:对主要企业的市场占有率、策略、产品、认证、监管状况、专利状况、製造能力等进行全面评估。
5- 产品开发与创新:提供对未来技术、研发活动和突破性产品开发的见解。
本报告解决了以下关键问题:
1-数位电錶市场的市场规模和预测是多少?
2-在数位功率计市场的预测期间内,有哪些产品、细分市场、应用和领域需要考虑投资?
3-数位电錶市场的技术趋势和法律规范是什么?
4-数位功率计市场主要供应商的市场占有率是多少?
5-进入数位电錶市场合适的型态和策略手段是什么?
目录
第一章 前言
第二章调查方法
第三章执行摘要
第四章市场概况
第五章市场洞察
- 市场动态
- 促进因素
- 由于节能意识的提高,智慧家庭的增加
- 政府能源管理和智慧电网技术倡议
- 对远端监控和控制能源使用的需求不断增加
- 抑制因素
- 数位电能计量基础设施的初始投资较高
- 机会
- 透过物联网和资料分析的创新扩展数位功率计的功能
- 透过探索先进的电池整合开发先进的能源管理软体
- 任务
- 对资料安全和数位仪表复杂功能的担忧
- 促进因素
- 市场区隔分析
- 相位:三相电錶在工业环境中至关重要,因为它们可以处理高负载并保持电能品质
- 应用:推动数位功率计在商业领域的使用
- 市场趋势分析
- 高通膨的累积效应
- 波特五力分析
- 价值炼和关键路径分析
- 法律规范
第六章数位功率计市场:爱别
- 介绍
- 单相
- 三相
第七章数位功率计市场:依应用分类
- 介绍
- 商业的
- 工业的
- 住宅
第八章美洲数位功率计市场
- 介绍
- 阿根廷
- 巴西
- 加拿大
- 墨西哥
- 美国
第九章亚太数位功率计市场
- 介绍
- 澳洲
- 中国
- 印度
- 印尼
- 日本
- 马来西亚
- 菲律宾
- 新加坡
- 韩国
- 台湾
- 泰国
- 越南
第十章欧洲、中东和非洲数位电錶市场
- 介绍
- 丹麦
- 埃及
- 芬兰
- 法国
- 德国
- 以色列
- 义大利
- 荷兰
- 奈及利亚
- 挪威
- 波兰
- 卡达
- 俄罗斯
- 沙乌地阿拉伯
- 南非
- 西班牙
- 瑞典
- 瑞士
- 土耳其
- 阿拉伯聯合大公国
- 英国
第十一章竞争形势
- FPNV定位矩阵
- 市场占有率分析:主要企业
- 主要企业竞争情境分析
- 併购
- 新产品发布和功能增强
- 奖项/奖励/扩展
第12章竞争产品组合
- 主要公司简介
- ABB Ltd.
- Advanced Electronics Company
- Carrel Electrade Limited
- Circutor SA
- EASTRON ELECTRONIC CO., LTD.
- Eaton Corporation PLC
- EKM Metering Inc.
- Elster Group GmbH by Honeywell International Inc.
- General Electric company
- Holley Technology Ltd.
- HPL Electric and Power Limited
- Iskraemeco Group
- Itron, Inc.
- Jiangsu Linyang Energy Co., Ltd.
- Kamstrup A/S
- Landis+Gyr AG
- Murata Manufacturing Co., Ltd.
- Ningbo Sanxing Electric Co. Ltd.
- Osaki Electric Co. Ltd.
- Schneider Electric SE
- Sensus by Xylem Inc.
- Siemens AG
- Simpson Electric Company, Inc.
- TE Connectivity Ltd.
- Wasion International Co., Ltd.
- 主要产品系列
第十三章附录
- 讨论指南
- 关于许可证和定价
[189 Pages Report] The Digital Power Meters Market size was estimated at USD 10.04 billion in 2023 and expected to reach USD 11.26 billion in 2024, at a CAGR 12.54% to reach USD 22.96 billion by 2030.
Global Digital Power Meters Market
| KEY MARKET STATISTICS | |
|---|---|
| Base Year [2023] | USD 10.04 billion |
| Estimated Year [2024] | USD 11.26 billion |
| Forecast Year [2030] | USD 22.96 billion |
| CAGR (%) | 12.54% |
Digital Power Meters are advanced measurement devices that record the amount of electric energy consumed by a residence, business establishment, or an electronically powered device. Unlike their analog predecessors, these meters employ digital technology to collect, process, and display the data. They are known for their high accuracy, reliability, and ability to provide detailed information about power usage over time. These meters typically feature a digital display and may incorporate sophisticated functions such as time-of-use billing, data communication, and remote reading capabilities. They can monitor various electrical parameters, including voltage, current, power factor, and kilowatt-hours (kWh) energy consumption. Growing number of smart homes with increasing awareness about energy conservation and government initiatives for energy management and smart grid technologies increases the adoption of digital power meters. However, concerns regarding data security and the complex functionality of digital meters with high initial costs may impede market growth. Nevertheless, developing sophisticated energy management software with research into advanced battery storage integration is anticipated to create lucrative opportunities for market growth.
Regional Insights
The Americas is showcasing a strong demand for digital power meters driven by concerted efforts for energy efficiency and grid modernization. These countries have become significant digital power meter technology consumers with many smart homes and an ongoing transition to smart grids. Customers in these territories are inclined towards integrated solutions providing real-time monitoring and energy management. Initiatives such as the U.S. Smart Grid Investment Grant (SGIG) and Canada's Smart Grid Program underline the region's focus on enhancing power grid infrastructure, propelling demand for advanced metering devices. The EMEA region presents a diverse market landscape for digital power meters. The European Union's drive for digitalization and sustainable energy has significantly spurred the adoption of innovative metering solutions. Requirements for energy saving and efficient resource management make EU countries avid adopters of innovative grid technologies. Customers prefer products that align with stringent regulatory standards and provide data security. With its growing infrastructure and smart city projects, the Middle East is becoming increasingly receptive to advanced metering infrastructure (AMI). In Africa, there is growing awareness and adoption driven by the need for electricity monitoring and theft reduction. Several African countries now leverage mobile technology integration for pre-paid digital power meter solutions. The digital power meter market in Asia Pacific is driven by massive infrastructure projects that demand highly efficient power management systems. Furthermore, countries in this region focus on energy conservation and technologically sophisticated infrastructure that contributes significantly to market demand, with customer preferences skewed towards high-precision and durable power meters.
FPNV Positioning Matrix
The FPNV Positioning Matrix is pivotal in evaluating the Digital Power Meters Market. It offers a comprehensive assessment of vendors, examining key metrics related to Business Strategy and Product Satisfaction. This in-depth analysis empowers users to make well-informed decisions aligned with their requirements. Based on the evaluation, the vendors are then categorized into four distinct quadrants representing varying levels of success: Forefront (F), Pathfinder (P), Niche (N), or Vital (V).
Market Share Analysis
The Market Share Analysis is a comprehensive tool that provides an insightful and in-depth examination of the current state of vendors in the Digital Power Meters Market. By meticulously comparing and analyzing vendor contributions in terms of overall revenue, customer base, and other key metrics, we can offer companies a greater understanding of their performance and the challenges they face when competing for market share. Additionally, this analysis provides valuable insights into the competitive nature of the sector, including factors such as accumulation, fragmentation dominance, and amalgamation traits observed over the base year period studied. With this expanded level of detail, vendors can make more informed decisions and devise effective strategies to gain a competitive edge in the market.
Key Company Profiles
The report delves into recent significant developments in the Digital Power Meters Market, highlighting leading vendors and their innovative profiles. These include ABB Ltd., Advanced Electronics Company, Carrel Electrade Limited, Circutor SA, EASTRON ELECTRONIC CO., LTD., Eaton Corporation PLC, EKM Metering Inc., Elster Group GmbH by Honeywell International Inc., General Electric company, Holley Technology Ltd., HPL Electric and Power Limited, Iskraemeco Group, Itron, Inc., Jiangsu Linyang Energy Co., Ltd., Kamstrup A/S, Landis+Gyr AG, Murata Manufacturing Co., Ltd., Ningbo Sanxing Electric Co. Ltd., Osaki Electric Co. Ltd., Schneider Electric SE, Sensus by Xylem Inc., Siemens AG, Simpson Electric Company, Inc., TE Connectivity Ltd., and Wasion International Co., Ltd..
Market Segmentation & Coverage
This research report categorizes the Digital Power Meters Market to forecast the revenues and analyze trends in each of the following sub-markets:
- Phase
- Single Phase
- Three Phase
- Application
- Commercial
- Industrial
- Residential
- Region
- Americas
- Argentina
- Brazil
- Canada
- Mexico
- United States
- California
- Florida
- Illinois
- New York
- Ohio
- Pennsylvania
- Texas
- Asia-Pacific
- Australia
- China
- India
- Indonesia
- Japan
- Malaysia
- Philippines
- Singapore
- South Korea
- Taiwan
- Thailand
- Vietnam
- Europe, Middle East & Africa
- Denmark
- Egypt
- Finland
- France
- Germany
- Israel
- Italy
- Netherlands
- Nigeria
- Norway
- Poland
- Qatar
- Russia
- Saudi Arabia
- South Africa
- Spain
- Sweden
- Switzerland
- Turkey
- United Arab Emirates
- United Kingdom
- Americas
The report offers valuable insights on the following aspects:
1. Market Penetration: It presents comprehensive information on the market provided by key players.
2. Market Development: It delves deep into lucrative emerging markets and analyzes the penetration across mature market segments.
3. Market Diversification: It provides detailed information on new product launches, untapped geographic regions, recent developments, and investments.
4. Competitive Assessment & Intelligence: It conducts an exhaustive assessment of market shares, strategies, products, certifications, regulatory approvals, patent landscape, and manufacturing capabilities of the leading players.
5. Product Development & Innovation: It offers intelligent insights on future technologies, R&D activities, and breakthrough product developments.
The report addresses key questions such as:
1. What is the market size and forecast of the Digital Power Meters Market?
2. Which products, segments, applications, and areas should one consider investing in over the forecast period in the Digital Power Meters Market?
3. What are the technology trends and regulatory frameworks in the Digital Power Meters Market?
4. What is the market share of the leading vendors in the Digital Power Meters Market?
5. Which modes and strategic moves are suitable for entering the Digital Power Meters Market?
Table of Contents
1. Preface
- 1.1. Objectives of the Study
- 1.2. Market Segmentation & Coverage
- 1.3. Years Considered for the Study
- 1.4. Currency & Pricing
- 1.5. Language
- 1.6. Limitations
- 1.7. Assumptions
- 1.8. Stakeholders
2. Research Methodology
- 2.1. Define: Research Objective
- 2.2. Determine: Research Design
- 2.3. Prepare: Research Instrument
- 2.4. Collect: Data Source
- 2.5. Analyze: Data Interpretation
- 2.6. Formulate: Data Verification
- 2.7. Publish: Research Report
- 2.8. Repeat: Report Update
3. Executive Summary
4. Market Overview
- 4.1. Introduction
- 4.2. Digital Power Meters Market, by Region
5. Market Insights
- 5.1. Market Dynamics
- 5.1.1. Drivers
- 5.1.1.1. Growing number of smart homes with increasing awareness about energy conservation
- 5.1.1.2. Government initiatives for energy management and smart grid technologies
- 5.1.1.3. Increasing need for remote monitoring and control of energy usage
- 5.1.2. Restraints
- 5.1.2.1. High initial investment in digital power meter infrastructure
- 5.1.3. Opportunities
- 5.1.3.1. Expanding capabilities of digital power meters due to innovations in IoT and data analytics
- 5.1.3.2. Development of sophisticated energy management software with research into advanced battery storage integration
- 5.1.4. Challenges
- 5.1.4.1. Concern regarding data security and complex functionality of digital meters
- 5.1.1. Drivers
- 5.2. Market Segmentation Analysis
- 5.2.1. Phase: Three-phase meters are essential in industrial settings due to their ability to handle high loads and maintain power quality
- 5.2.2. Application: Evolving usage of digital power meters in the commercial sector
- 5.3. Market Trend Analysis
- 5.4. Cumulative Impact of High Inflation
- 5.5. Porter's Five Forces Analysis
- 5.5.1. Threat of New Entrants
- 5.5.2. Threat of Substitutes
- 5.5.3. Bargaining Power of Customers
- 5.5.4. Bargaining Power of Suppliers
- 5.5.5. Industry Rivalry
- 5.6. Value Chain & Critical Path Analysis
- 5.7. Regulatory Framework
6. Digital Power Meters Market, by Phase
- 6.1. Introduction
- 6.2. Single Phase
- 6.3. Three Phase
7. Digital Power Meters Market, by Application
- 7.1. Introduction
- 7.2. Commercial
- 7.3. Industrial
- 7.4. Residential
8. Americas Digital Power Meters Market
- 8.1. Introduction
- 8.2. Argentina
- 8.3. Brazil
- 8.4. Canada
- 8.5. Mexico
- 8.6. United States
9. Asia-Pacific Digital Power Meters Market
- 9.1. Introduction
- 9.2. Australia
- 9.3. China
- 9.4. India
- 9.5. Indonesia
- 9.6. Japan
- 9.7. Malaysia
- 9.8. Philippines
- 9.9. Singapore
- 9.10. South Korea
- 9.11. Taiwan
- 9.12. Thailand
- 9.13. Vietnam
10. Europe, Middle East & Africa Digital Power Meters Market
- 10.1. Introduction
- 10.2. Denmark
- 10.3. Egypt
- 10.4. Finland
- 10.5. France
- 10.6. Germany
- 10.7. Israel
- 10.8. Italy
- 10.9. Netherlands
- 10.10. Nigeria
- 10.11. Norway
- 10.12. Poland
- 10.13. Qatar
- 10.14. Russia
- 10.15. Saudi Arabia
- 10.16. South Africa
- 10.17. Spain
- 10.18. Sweden
- 10.19. Switzerland
- 10.20. Turkey
- 10.21. United Arab Emirates
- 10.22. United Kingdom
11. Competitive Landscape
- 11.1. FPNV Positioning Matrix
- 11.2. Market Share Analysis, By Key Player
- 11.3. Competitive Scenario Analysis, By Key Player
- 11.3.1. Merger & Acquisition
- 11.3.1.1. Gridspertise Acquires Nordic Metering Provider Aidon
- 11.3.2. New Product Launch & Enhancement
- 11.3.2.1. ABB India Strengthens its Portfolio of Energy Efficiency Devices with a New Range of Smart Metering Solutions for Efficient Energy Management
- 11.3.3. Award, Recognition, & Expansion
- 11.3.3.1. Adani Energy forms JV with IHC-backed Firm to Expand Smart-Meter Business
- 11.3.1. Merger & Acquisition
12. Competitive Portfolio
- 12.1. Key Company Profiles
- 12.1.1. ABB Ltd.
- 12.1.2. Advanced Electronics Company
- 12.1.3. Carrel Electrade Limited
- 12.1.4. Circutor SA
- 12.1.5. EASTRON ELECTRONIC CO., LTD.
- 12.1.6. Eaton Corporation PLC
- 12.1.7. EKM Metering Inc.
- 12.1.8. Elster Group GmbH by Honeywell International Inc.
- 12.1.9. General Electric company
- 12.1.10. Holley Technology Ltd.
- 12.1.11. HPL Electric and Power Limited
- 12.1.12. Iskraemeco Group
- 12.1.13. Itron, Inc.
- 12.1.14. Jiangsu Linyang Energy Co., Ltd.
- 12.1.15. Kamstrup A/S
- 12.1.16. Landis+Gyr AG
- 12.1.17. Murata Manufacturing Co., Ltd.
- 12.1.18. Ningbo Sanxing Electric Co. Ltd.
- 12.1.19. Osaki Electric Co. Ltd.
- 12.1.20. Schneider Electric SE
- 12.1.21. Sensus by Xylem Inc.
- 12.1.22. Siemens AG
- 12.1.23. Simpson Electric Company, Inc.
- 12.1.24. TE Connectivity Ltd.
- 12.1.25. Wasion International Co., Ltd.
- 12.2. Key Product Portfolio
13. Appendix
- 13.1. Discussion Guide
- 13.2. License & Pricing
LIST OF FIGURES
- FIGURE 1. DIGITAL POWER METERS MARKET RESEARCH PROCESS
- FIGURE 2. DIGITAL POWER METERS MARKET SIZE, 2023 VS 2030
- FIGURE 3. DIGITAL POWER METERS MARKET SIZE, 2018-2030 (USD MILLION)
- FIGURE 4. DIGITAL POWER METERS MARKET SIZE, BY REGION, 2023 VS 2030 (%)
- FIGURE 5. DIGITAL POWER METERS MARKET SIZE, BY REGION, 2023 VS 2024 VS 2030 (USD MILLION)
- FIGURE 6. DIGITAL POWER METERS MARKET DYNAMICS
- FIGURE 7. DIGITAL POWER METERS MARKET SIZE, BY PHASE, 2023 VS 2030 (%)
- FIGURE 8. DIGITAL POWER METERS MARKET SIZE, BY PHASE, 2023 VS 2024 VS 2030 (USD MILLION)
- FIGURE 9. DIGITAL POWER METERS MARKET SIZE, BY APPLICATION, 2023 VS 2030 (%)
- FIGURE 10. DIGITAL POWER METERS MARKET SIZE, BY APPLICATION, 2023 VS 2024 VS 2030 (USD MILLION)
- FIGURE 11. AMERICAS DIGITAL POWER METERS MARKET SIZE, BY COUNTRY, 2023 VS 2030 (%)
- FIGURE 12. AMERICAS DIGITAL POWER METERS MARKET SIZE, BY COUNTRY, 2023 VS 2024 VS 2030 (USD MILLION)
- FIGURE 13. UNITED STATES DIGITAL POWER METERS MARKET SIZE, BY STATE, 2023 VS 2030 (%)
- FIGURE 14. UNITED STATES DIGITAL POWER METERS MARKET SIZE, BY STATE, 2023 VS 2024 VS 2030 (USD MILLION)
- FIGURE 15. ASIA-PACIFIC DIGITAL POWER METERS MARKET SIZE, BY COUNTRY, 2023 VS 2030 (%)
- FIGURE 16. ASIA-PACIFIC DIGITAL POWER METERS MARKET SIZE, BY COUNTRY, 2023 VS 2024 VS 2030 (USD MILLION)
- FIGURE 17. EUROPE, MIDDLE EAST & AFRICA DIGITAL POWER METERS MARKET SIZE, BY COUNTRY, 2023 VS 2030 (%)
- FIGURE 18. EUROPE, MIDDLE EAST & AFRICA DIGITAL POWER METERS MARKET SIZE, BY COUNTRY, 2023 VS 2024 VS 2030 (USD MILLION)
- FIGURE 19. DIGITAL POWER METERS MARKET, FPNV POSITIONING MATRIX, 2023
- FIGURE 20. DIGITAL POWER METERS MARKET SHARE, BY KEY PLAYER, 2023
LIST OF TABLES
- TABLE 1. DIGITAL POWER METERS MARKET SEGMENTATION & COVERAGE
- TABLE 2. UNITED STATES DOLLAR EXCHANGE RATE, 2018-2023
- TABLE 3. DIGITAL POWER METERS MARKET SIZE, 2018-2030 (USD MILLION)
- TABLE 4. GLOBAL DIGITAL POWER METERS MARKET SIZE, BY REGION, 2018-2030 (USD MILLION)
- TABLE 5. DIGITAL POWER METERS MARKET SIZE, BY PHASE, 2018-2030 (USD MILLION)
- TABLE 6. DIGITAL POWER METERS MARKET SIZE, BY SINGLE PHASE, BY REGION, 2018-2030 (USD MILLION)
- TABLE 7. DIGITAL POWER METERS MARKET SIZE, BY THREE PHASE, BY REGION, 2018-2030 (USD MILLION)
- TABLE 8. DIGITAL POWER METERS MARKET SIZE, BY APPLICATION, 2018-2030 (USD MILLION)
- TABLE 9. DIGITAL POWER METERS MARKET SIZE, BY COMMERCIAL, BY REGION, 2018-2030 (USD MILLION)
- TABLE 10. DIGITAL POWER METERS MARKET SIZE, BY INDUSTRIAL, BY REGION, 2018-2030 (USD MILLION)
- TABLE 11. DIGITAL POWER METERS MARKET SIZE, BY RESIDENTIAL, BY REGION, 2018-2030 (USD MILLION)
- TABLE 12. AMERICAS DIGITAL POWER METERS MARKET SIZE, BY PHASE, 2018-2030 (USD MILLION)
- TABLE 13. AMERICAS DIGITAL POWER METERS MARKET SIZE, BY APPLICATION, 2018-2030 (USD MILLION)
- TABLE 14. AMERICAS DIGITAL POWER METERS MARKET SIZE, BY COUNTRY, 2018-2030 (USD MILLION)
- TABLE 15. ARGENTINA DIGITAL POWER METERS MARKET SIZE, BY PHASE, 2018-2030 (USD MILLION)
- TABLE 16. ARGENTINA DIGITAL POWER METERS MARKET SIZE, BY APPLICATION, 2018-2030 (USD MILLION)
- TABLE 17. BRAZIL DIGITAL POWER METERS MARKET SIZE, BY PHASE, 2018-2030 (USD MILLION)
- TABLE 18. BRAZIL DIGITAL POWER METERS MARKET SIZE, BY APPLICATION, 2018-2030 (USD MILLION)
- TABLE 19. CANADA DIGITAL POWER METERS MARKET SIZE, BY PHASE, 2018-2030 (USD MILLION)
- TABLE 20. CANADA DIGITAL POWER METERS MARKET SIZE, BY APPLICATION, 2018-2030 (USD MILLION)
- TABLE 21. MEXICO DIGITAL POWER METERS MARKET SIZE, BY PHASE, 2018-2030 (USD MILLION)
- TABLE 22. MEXICO DIGITAL POWER METERS MARKET SIZE, BY APPLICATION, 2018-2030 (USD MILLION)
- TABLE 23. UNITED STATES DIGITAL POWER METERS MARKET SIZE, BY PHASE, 2018-2030 (USD MILLION)
- TABLE 24. UNITED STATES DIGITAL POWER METERS MARKET SIZE, BY APPLICATION, 2018-2030 (USD MILLION)
- TABLE 25. UNITED STATES DIGITAL POWER METERS MARKET SIZE, BY STATE, 2018-2030 (USD MILLION)
- TABLE 26. ASIA-PACIFIC DIGITAL POWER METERS MARKET SIZE, BY PHASE, 2018-2030 (USD MILLION)
- TABLE 27. ASIA-PACIFIC DIGITAL POWER METERS MARKET SIZE, BY APPLICATION, 2018-2030 (USD MILLION)
- TABLE 28. ASIA-PACIFIC DIGITAL POWER METERS MARKET SIZE, BY COUNTRY, 2018-2030 (USD MILLION)
- TABLE 29. AUSTRALIA DIGITAL POWER METERS MARKET SIZE, BY PHASE, 2018-2030 (USD MILLION)
- TABLE 30. AUSTRALIA DIGITAL POWER METERS MARKET SIZE, BY APPLICATION, 2018-2030 (USD MILLION)
- TABLE 31. CHINA DIGITAL POWER METERS MARKET SIZE, BY PHASE, 2018-2030 (USD MILLION)
- TABLE 32. CHINA DIGITAL POWER METERS MARKET SIZE, BY APPLICATION, 2018-2030 (USD MILLION)
- TABLE 33. INDIA DIGITAL POWER METERS MARKET SIZE, BY PHASE, 2018-2030 (USD MILLION)
- TABLE 34. INDIA DIGITAL POWER METERS MARKET SIZE, BY APPLICATION, 2018-2030 (USD MILLION)
- TABLE 35. INDONESIA DIGITAL POWER METERS MARKET SIZE, BY PHASE, 2018-2030 (USD MILLION)
- TABLE 36. INDONESIA DIGITAL POWER METERS MARKET SIZE, BY APPLICATION, 2018-2030 (USD MILLION)
- TABLE 37. JAPAN DIGITAL POWER METERS MARKET SIZE, BY PHASE, 2018-2030 (USD MILLION)
- TABLE 38. JAPAN DIGITAL POWER METERS MARKET SIZE, BY APPLICATION, 2018-2030 (USD MILLION)
- TABLE 39. MALAYSIA DIGITAL POWER METERS MARKET SIZE, BY PHASE, 2018-2030 (USD MILLION)
- TABLE 40. MALAYSIA DIGITAL POWER METERS MARKET SIZE, BY APPLICATION, 2018-2030 (USD MILLION)
- TABLE 41. PHILIPPINES DIGITAL POWER METERS MARKET SIZE, BY PHASE, 2018-2030 (USD MILLION)
- TABLE 42. PHILIPPINES DIGITAL POWER METERS MARKET SIZE, BY APPLICATION, 2018-2030 (USD MILLION)
- TABLE 43. SINGAPORE DIGITAL POWER METERS MARKET SIZE, BY PHASE, 2018-2030 (USD MILLION)
- TABLE 44. SINGAPORE DIGITAL POWER METERS MARKET SIZE, BY APPLICATION, 2018-2030 (USD MILLION)
- TABLE 45. SOUTH KOREA DIGITAL POWER METERS MARKET SIZE, BY PHASE, 2018-2030 (USD MILLION)
- TABLE 46. SOUTH KOREA DIGITAL POWER METERS MARKET SIZE, BY APPLICATION, 2018-2030 (USD MILLION)
- TABLE 47. TAIWAN DIGITAL POWER METERS MARKET SIZE, BY PHASE, 2018-2030 (USD MILLION)
- TABLE 48. TAIWAN DIGITAL POWER METERS MARKET SIZE, BY APPLICATION, 2018-2030 (USD MILLION)
- TABLE 49. THAILAND DIGITAL POWER METERS MARKET SIZE, BY PHASE, 2018-2030 (USD MILLION)
- TABLE 50. THAILAND DIGITAL POWER METERS MARKET SIZE, BY APPLICATION, 2018-2030 (USD MILLION)
- TABLE 51. VIETNAM DIGITAL POWER METERS MARKET SIZE, BY PHASE, 2018-2030 (USD MILLION)
- TABLE 52. VIETNAM DIGITAL POWER METERS MARKET SIZE, BY APPLICATION, 2018-2030 (USD MILLION)
- TABLE 53. EUROPE, MIDDLE EAST & AFRICA DIGITAL POWER METERS MARKET SIZE, BY PHASE, 2018-2030 (USD MILLION)
- TABLE 54. EUROPE, MIDDLE EAST & AFRICA DIGITAL POWER METERS MARKET SIZE, BY APPLICATION, 2018-2030 (USD MILLION)
- TABLE 55. EUROPE, MIDDLE EAST & AFRICA DIGITAL POWER METERS MARKET SIZE, BY COUNTRY, 2018-2030 (USD MILLION)
- TABLE 56. DENMARK DIGITAL POWER METERS MARKET SIZE, BY PHASE, 2018-2030 (USD MILLION)
- TABLE 57. DENMARK DIGITAL POWER METERS MARKET SIZE, BY APPLICATION, 2018-2030 (USD MILLION)
- TABLE 58. EGYPT DIGITAL POWER METERS MARKET SIZE, BY PHASE, 2018-2030 (USD MILLION)
- TABLE 59. EGYPT DIGITAL POWER METERS MARKET SIZE, BY APPLICATION, 2018-2030 (USD MILLION)
- TABLE 60. FINLAND DIGITAL POWER METERS MARKET SIZE, BY PHASE, 2018-2030 (USD MILLION)
- TABLE 61. FINLAND DIGITAL POWER METERS MARKET SIZE, BY APPLICATION, 2018-2030 (USD MILLION)
- TABLE 62. FRANCE DIGITAL POWER METERS MARKET SIZE, BY PHASE, 2018-2030 (USD MILLION)
- TABLE 63. FRANCE DIGITAL POWER METERS MARKET SIZE, BY APPLICATION, 2018-2030 (USD MILLION)
- TABLE 64. GERMANY DIGITAL POWER METERS MARKET SIZE, BY PHASE, 2018-2030 (USD MILLION)
- TABLE 65. GERMANY DIGITAL POWER METERS MARKET SIZE, BY APPLICATION, 2018-2030 (USD MILLION)
- TABLE 66. ISRAEL DIGITAL POWER METERS MARKET SIZE, BY PHASE, 2018-2030 (USD MILLION)
- TABLE 67. ISRAEL DIGITAL POWER METERS MARKET SIZE, BY APPLICATION, 2018-2030 (USD MILLION)
- TABLE 68. ITALY DIGITAL POWER METERS MARKET SIZE, BY PHASE, 2018-2030 (USD MILLION)
- TABLE 69. ITALY DIGITAL POWER METERS MARKET SIZE, BY APPLICATION, 2018-2030 (USD MILLION)
- TABLE 70. NETHERLANDS DIGITAL POWER METERS MARKET SIZE, BY PHASE, 2018-2030 (USD MILLION)
- TABLE 71. NETHERLANDS DIGITAL POWER METERS MARKET SIZE, BY APPLICATION, 2018-2030 (USD MILLION)
- TABLE 72. NIGERIA DIGITAL POWER METERS MARKET SIZE, BY PHASE, 2018-2030 (USD MILLION)
- TABLE 73. NIGERIA DIGITAL POWER METERS MARKET SIZE, BY APPLICATION, 2018-2030 (USD MILLION)
- TABLE 74. NORWAY DIGITAL POWER METERS MARKET SIZE, BY PHASE, 2018-2030 (USD MILLION)
- TABLE 75. NORWAY DIGITAL POWER METERS MARKET SIZE, BY APPLICATION, 2018-2030 (USD MILLION)
- TABLE 76. POLAND DIGITAL POWER METERS MARKET SIZE, BY PHASE, 2018-2030 (USD MILLION)
- TABLE 77. POLAND DIGITAL POWER METERS MARKET SIZE, BY APPLICATION, 2018-2030 (USD MILLION)
- TABLE 78. QATAR DIGITAL POWER METERS MARKET SIZE, BY PHASE, 2018-2030 (USD MILLION)
- TABLE 79. QATAR DIGITAL POWER METERS MARKET SIZE, BY APPLICATION, 2018-2030 (USD MILLION)
- TABLE 80. RUSSIA DIGITAL POWER METERS MARKET SIZE, BY PHASE, 2018-2030 (USD MILLION)
- TABLE 81. RUSSIA DIGITAL POWER METERS MARKET SIZE, BY APPLICATION, 2018-2030 (USD MILLION)
- TABLE 82. SAUDI ARABIA DIGITAL POWER METERS MARKET SIZE, BY PHASE, 2018-2030 (USD MILLION)
- TABLE 83. SAUDI ARABIA DIGITAL POWER METERS MARKET SIZE, BY APPLICATION, 2018-2030 (USD MILLION)
- TABLE 84. SOUTH AFRICA DIGITAL POWER METERS MARKET SIZE, BY PHASE, 2018-2030 (USD MILLION)
- TABLE 85. SOUTH AFRICA DIGITAL POWER METERS MARKET SIZE, BY APPLICATION, 2018-2030 (USD MILLION)
- TABLE 86. SPAIN DIGITAL POWER METERS MARKET SIZE, BY PHASE, 2018-2030 (USD MILLION)
- TABLE 87. SPAIN DIGITAL POWER METERS MARKET SIZE, BY APPLICATION, 2018-2030 (USD MILLION)
- TABLE 88. SWEDEN DIGITAL POWER METERS MARKET SIZE, BY PHASE, 2018-2030 (USD MILLION)
- TABLE 89. SWEDEN DIGITAL POWER METERS MARKET SIZE, BY APPLICATION, 2018-2030 (USD MILLION)
- TABLE 90. SWITZERLAND DIGITAL POWER METERS MARKET SIZE, BY PHASE, 2018-2030 (USD MILLION)
- TABLE 91. SWITZERLAND DIGITAL POWER METERS MARKET SIZE, BY APPLICATION, 2018-2030 (USD MILLION)
- TABLE 92. TURKEY DIGITAL POWER METERS MARKET SIZE, BY PHASE, 2018-2030 (USD MILLION)
- TABLE 93. TURKEY DIGITAL POWER METERS MARKET SIZE, BY APPLICATION, 2018-2030 (USD MILLION)
- TABLE 94. UNITED ARAB EMIRATES DIGITAL POWER METERS MARKET SIZE, BY PHASE, 2018-2030 (USD MILLION)
- TABLE 95. UNITED ARAB EMIRATES DIGITAL POWER METERS MARKET SIZE, BY APPLICATION, 2018-2030 (USD MILLION)
- TABLE 96. UNITED KINGDOM DIGITAL POWER METERS MARKET SIZE, BY PHASE, 2018-2030 (USD MILLION)
- TABLE 97. UNITED KINGDOM DIGITAL POWER METERS MARKET SIZE, BY APPLICATION, 2018-2030 (USD MILLION)
- TABLE 98. DIGITAL POWER METERS MARKET, FPNV POSITIONING MATRIX, 2023
- TABLE 99. DIGITAL POWER METERS MARKET SHARE, BY KEY PLAYER, 2023
- TABLE 100. DIGITAL POWER METERS MARKET LICENSE & PRICING
 全球电錶市场规模、份额、成长分析(按电錶类型、分阶段)- 产业预测,2024-2031 年
 2024-2032 年预付费电錶市场报告(按类型、组件、阶段、最终用户和地区)
 单相电錶市场报告:2030 年趋势、预测与竞争分析
 全球电力计量市场:按阶段、按应用:机会分析和产业预测(2023-2032)
 数位功率计市场报告:2030 年趋势、预测与竞争分析
 电錶市场:按技术(类比电錶、数位电錶、智慧电錶)、最终用户(商业、工业、住宅)划分 - 全球预测 2023-2030 年
 功率计市场:全球产业分析,规模,占有率,成长,趋势,预测,2023年~2031年
 数位功率计的全球市场
 电力计量市场 - 增长、趋势、COVID-19 影响和预测 (2023-2028)
 电力数量计的全球市场 2022-2026