


 |
市场调查报告书
商品编码
1415294
聚合物共混物和合金市场:按类型、应用分类 - 2024-2030 年全球预测Polymer Blends & Alloys Market by Type (Polycarbonate, PPE/PPO), Application (Aerospace, Automotive, Electrical & Electronics) - Global Forecast 2024-2030 |
||||||
※ 本网页内容可能与最新版本有所差异。详细情况请与我们联繫。
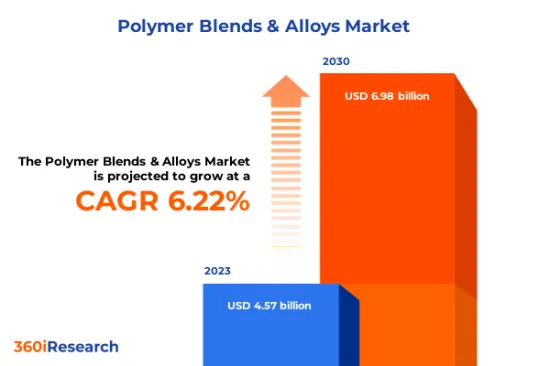
聚合物共混物和合金市场规模预计2023年为45.7亿美元,预计2024年将达到48.3亿美元,2030年将达到69.8亿美元,复合年增长率为6.22%。
聚合物共混物和合金的全球市场
| 主要市场统计 | |
|---|---|
| 基准年[2023] | 45.7亿美元 |
| 预测年份 [2024] | 48.3亿美元 |
| 预测年份 [2030] | 69.8亿美元 |
| 复合年增长率(%) | 6.22% |
聚合物共混物和合金是在分子层面上结合两种或多种不同聚合物的复合材料,以改善材料性能,如机械性能、热稳定性、加工性能和耐化学性。这些先进材料由于其可自订的特性而广泛应用于各种工业应用。近年来,在结合塑胶树脂的材料科学取得进展的推动下,全球聚合物共混物和合金市场经历了显着增长。此外,由于严格的排放法规,汽车产业对轻量材料的需求不断增加,正在推动采用聚合物共混物来减轻重量。儘管有这些成长要素,但由于复杂的合成方法和昂贵的原材料而与新材料相关的高生产成本等限制因素影响了整体盈利。此外,严格的挥发性有机化合物排放法规和对塑胶废弃物管理的担忧正在缩小市场范围。然而,快速的都市化和基础设施发展进一步推动了建筑应用中对先进聚合物的需求。从淀粉和纤维素等可再生资源中开拓生物基聚合物以及将奈米技术融入聚合物配方中,预计将增强全球聚合物共混物和合金市场的未来前景。
区域洞察
在美洲,尤其是北美,由于汽车、航太和包装等行业越来越多地采用这些材料,聚合物共混物和合金市场正在稳步成长。此外,EPA(环保署)对燃油效率的严格规定增加了对汽车应用中聚合物共混物和合金等轻量材料的关注。电动车在美洲的普及也促进了市场的成长。在欧洲、中东和非洲地区,由于该地区完善的工业基础设施,欧洲在聚合物共混物和合金的消费和生产方面占据较高的地位。此外,由于建筑、基础设施发展和工业化投资的增加,中东和非洲市场预计将展现出巨大的成长潜力。包装产业对聚合物共混物的需求也预计将推动该地区的市场成长。由于快速的工业化、都市化和人口增长,亚太地区在全球聚合物共混物和合金市场中成长最快。中国、日本、韩国和印度是市场扩张的主要贡献者。製造业的扩张正在增加对耐用且能够承受恶劣操作条件的高性能材料的需求。
FPNV定位矩阵
FPNV 定位矩阵对于评估聚合物共混物和合金市场至关重要。我们检视与业务策略和产品满意度相关的关键指标,以对供应商进行全面评估。这种深入的分析使用户能够根据自己的要求做出明智的决策。根据评估,供应商被分为四个成功程度不同的像限。最前线 (F)、探路者 (P)、利基 (N) 和重要 (V)。
市场占有率分析
市场占有率分析是一种综合工具,可以对聚合物共混物和合金市场供应商的现状进行深入而深入的研究。全面比较和分析供应商在整体收益、基本客群和其他关键指标方面的贡献,以便更好地了解公司的绩效及其在争夺市场占有率时面临的挑战。此外,该分析还提供了对该行业竞争特征的宝贵考察,包括在研究基准年观察到的累积、分散主导地位和合併特征等因素。这种详细程度的提高使供应商能够做出更明智的决策并制定有效的策略,从而在市场上获得竞争优势。
本报告在以下方面提供了宝贵的见解:
1-市场渗透率:提供有关主要企业所服务的市场的全面资讯。
2-市场开拓:我们深入研究利润丰厚的新兴市场,并分析它们在成熟细分市场中的渗透率。
3- 市场多元化:提供有关新产品发布、开拓地区、最新发展和投资的详细资讯。
4-竞争力评估与资讯:对主要企业的市场占有率、策略、产品、认证、监管状况、专利状况、製造能力等进行全面评估。
5- 产品开发与创新:提供对未来技术、研发活动和突破性产品开发的见解。
本报告解决了以下关键问题:
1-聚合物共混物和合金市场的市场规模和预测是多少?
2-聚合物共混物和合金市场预测期内需要考虑投资的产品、细分市场、应用和领域有哪些?
3-聚合物共混物和合金市场的技术趋势和法律规范是什么?
4-聚合物共混物和合金市场主要供应商的市场占有率是多少?
5-进入聚合物共混物和合金市场的合适型态和战略手段是什么?
目录
第一章 前言
第二章调查方法
第三章执行摘要
第四章市场概况
第五章市场洞察
- 市场动态
- 促进因素
- 对轻量材料的需求不断增加,以提高燃油效率并减少排放气体
- 整个产业对环保材料的兴趣日益浓厚
- 包装和电子产业出现了新的可能性
- 抑制因素
- 与聚合物共混物和合金相关的原料成本高昂
- 机会
- 活性化研发活动以引进先进的聚合物共混物和合金
- 客製化聚合物共混物和合金的成长趋势
- 任务
- 聚合物共混物和合金的性能权衡
- 促进因素
- 市场区隔分析
- 类型:PPE/PPO 材料将优先解决有关阻燃性和耐化学性的具体挑战
- 应用:汽车产业对节能且弹性的聚合物共混物和合金的需求不断增长
- 市场趋势分析
- 高通膨的累积效应
- 波特五力分析
- 价值炼和关键路径分析
- 法律规范
第六章聚合物共混物和合金市场:依类型
- 介绍
- 聚碳酸酯
- PPE/PPO
第七章聚合物共混物与合金市场:依应用分类
- 介绍
- 航太
- 车
- 电力/电子
第八章美洲聚合物共混物与合金市场
- 介绍
- 阿根廷
- 巴西
- 加拿大
- 墨西哥
- 美国
第九章亚太聚合物共混物和合金市场
- 介绍
- 澳洲
- 中国
- 印度
- 印尼
- 日本
- 马来西亚
- 菲律宾
- 新加坡
- 韩国
- 台湾
- 泰国
- 越南
第10章欧洲/中东/非洲聚合物共混物和合金市场
- 介绍
- 丹麦
- 埃及
- 芬兰
- 法国
- 德国
- 以色列
- 义大利
- 荷兰
- 奈及利亚
- 挪威
- 波兰
- 卡达
- 俄罗斯
- 沙乌地阿拉伯
- 南非
- 西班牙
- 瑞典
- 瑞士
- 土耳其
- 阿拉伯聯合大公国
- 英国
第十一章竞争形势
- FPNV定位矩阵
- 市场占有率分析:主要企业
- 主要企业竞争情境分析
- 合约、合作和伙伴关係
- 新产品发布和功能增强
第12章竞争产品组合
- 主要公司简介
- Americhem
- Arkema SA
- Asahi Kasei Corporation
- Axel Polymers Limited
- Bada AG
- BASF SE
- Celanese Corporation
- CHEMIEURO
- CHIMEI Corporation
- Covestro AG
- Daicel Corporation
- Dirco Polymers Pvt Ltd
- Foster Corporation
- INEOS Styrolution Group GmbH
- JSR Corporation
- LG Chem Ltd.
- LyondellBasell Industries Holdings BV
- Mitsubishi Engineering-Plastics Corporation
- Padmanabh Alloys & Polymers Ltd
- PLUSS Advanced Technologies
- Polykemi AB
- Radici Partecipazioni SpA
- Romira GmbH
- SABIC
- Trinseo PLC
- 主要产品系列
第十三章附录
- 讨论指南
- 关于许可证和定价
[187 Pages Report] The Polymer Blends & Alloys Market size was estimated at USD 4.57 billion in 2023 and expected to reach USD 4.83 billion in 2024, at a CAGR 6.22% to reach USD 6.98 billion by 2030.
Global Polymer Blends & Alloys Market
| KEY MARKET STATISTICS | |
|---|---|
| Base Year [2023] | USD 4.57 billion |
| Estimated Year [2024] | USD 4.83 billion |
| Forecast Year [2030] | USD 6.98 billion |
| CAGR (%) | 6.22% |
Polymer blends and alloys are composite materials consisting of two or more distinct polymers combined at the molecular level to achieve enhanced material properties, such as improved mechanical performance, thermal stability, processability, and chemical resistance. These advanced materials have widespread applications in diverse industrial applications owing to their customizable characteristics. In recent years, the global polymer blends & alloys market has witnessed significant growth, attributed to the advancements in material science that combine distinct thermoplastic resins into high-performance products with superior mechanical properties such as strength, durability, heat resistance, or chemical resistance. Moreover, the rising demand for lightweight materials in the automotive industry, owing to stringent emission regulations, has driven the adoption of polymer blends for weight reduction. Despite these growth factors, limitations such as high production costs associated with novel materials owing to complex synthesis methods or expensive raw materials impact overall profitability. Additionally, stringent VOC emission regulations and concerns over plastic waste management have been limiting the market scope. However, rapid urbanization and infrastructural development are further propelling demand for advanced polymers in construction applications. Developing bio-based polymers from renewable sources, including starch or cellulose, and incorporating nanotechnology into polymer formulations is expected to create a stronger future landscape for the global polymer blends & alloys market.
Regional Insights
In the Americas region, especially North America, the market for polymer blends and alloys is experiencing steady growth owing to the increasing adoption of these materials in industries such as industries such as automotive, aerospace, and packaging. Furthermore, stringent regulations regarding fuel efficiency by the EPA (Environmental Protection Agency) have led to an increased focus on lightweight materials, such as polymer blends and alloys in automotive applications. The surge of electric vehicles across the Americas also contributes to the market growth. In the EMEA region, Europe holds a higher position in terms of consumption and production of polymer blends & alloys, which is attributed to well-established industrial infrastructure across the region. Moreover, the Middle East and Africa market is anticipated to exhibit significant potential for growth attributed to increasing investments in construction, infrastructure development, and industrialization. The demand for polymer blends in the packaging industry is also expected to boost the market growth in this region. The APAC region is exhibiting the fastest growth rate in the global polymer blends & alloys market owing to rapid industrialization, urbanization, and growing population. China, Japan, South Korea, and India are contributing significantly towards market expansion. The expansion of manufacturing sectors has generated massive demand for high-performance materials that can withstand harsh operating conditions while offering excellent durability.
FPNV Positioning Matrix
The FPNV Positioning Matrix is pivotal in evaluating the Polymer Blends & Alloys Market. It offers a comprehensive assessment of vendors, examining key metrics related to Business Strategy and Product Satisfaction. This in-depth analysis empowers users to make well-informed decisions aligned with their requirements. Based on the evaluation, the vendors are then categorized into four distinct quadrants representing varying levels of success: Forefront (F), Pathfinder (P), Niche (N), or Vital (V).
Market Share Analysis
The Market Share Analysis is a comprehensive tool that provides an insightful and in-depth examination of the current state of vendors in the Polymer Blends & Alloys Market. By meticulously comparing and analyzing vendor contributions in terms of overall revenue, customer base, and other key metrics, we can offer companies a greater understanding of their performance and the challenges they face when competing for market share. Additionally, this analysis provides valuable insights into the competitive nature of the sector, including factors such as accumulation, fragmentation dominance, and amalgamation traits observed over the base year period studied. With this expanded level of detail, vendors can make more informed decisions and devise effective strategies to gain a competitive edge in the market.
Key Company Profiles
The report delves into recent significant developments in the Polymer Blends & Alloys Market, highlighting leading vendors and their innovative profiles. These include Americhem, Arkema S.A., Asahi Kasei Corporation, Axel Polymers Limited, Bada AG, BASF SE, Celanese Corporation, CHEMIEURO, CHIMEI Corporation, Covestro AG, Daicel Corporation, Dirco Polymers Pvt Ltd, Foster Corporation, INEOS Styrolution Group GmbH, JSR Corporation, LG Chem Ltd., LyondellBasell Industries Holdings B.V., Mitsubishi Engineering-Plastics Corporation, Padmanabh Alloys & Polymers Ltd, PLUSS Advanced Technologies, Polykemi AB, Radici Partecipazioni SpA, Romira GmbH, SABIC, and Trinseo PLC.
Market Segmentation & Coverage
This research report categorizes the Polymer Blends & Alloys Market to forecast the revenues and analyze trends in each of the following sub-markets:
- Type
- Polycarbonate
- PPE/PPO
- Application
- Aerospace
- Automotive
- Electrical & Electronics
- Region
- Americas
- Argentina
- Brazil
- Canada
- Mexico
- United States
- California
- Florida
- Illinois
- New York
- Ohio
- Pennsylvania
- Texas
- Asia-Pacific
- Australia
- China
- India
- Indonesia
- Japan
- Malaysia
- Philippines
- Singapore
- South Korea
- Taiwan
- Thailand
- Vietnam
- Europe, Middle East & Africa
- Denmark
- Egypt
- Finland
- France
- Germany
- Israel
- Italy
- Netherlands
- Nigeria
- Norway
- Poland
- Qatar
- Russia
- Saudi Arabia
- South Africa
- Spain
- Sweden
- Switzerland
- Turkey
- United Arab Emirates
- United Kingdom
- Americas
The report offers valuable insights on the following aspects:
1. Market Penetration: It presents comprehensive information on the market provided by key players.
2. Market Development: It delves deep into lucrative emerging markets and analyzes the penetration across mature market segments.
3. Market Diversification: It provides detailed information on new product launches, untapped geographic regions, recent developments, and investments.
4. Competitive Assessment & Intelligence: It conducts an exhaustive assessment of market shares, strategies, products, certifications, regulatory approvals, patent landscape, and manufacturing capabilities of the leading players.
5. Product Development & Innovation: It offers intelligent insights on future technologies, R&D activities, and breakthrough product developments.
The report addresses key questions such as:
1. What is the market size and forecast of the Polymer Blends & Alloys Market?
2. Which products, segments, applications, and areas should one consider investing in over the forecast period in the Polymer Blends & Alloys Market?
3. What are the technology trends and regulatory frameworks in the Polymer Blends & Alloys Market?
4. What is the market share of the leading vendors in the Polymer Blends & Alloys Market?
5. Which modes and strategic moves are suitable for entering the Polymer Blends & Alloys Market?
Table of Contents
1. Preface
- 1.1. Objectives of the Study
- 1.2. Market Segmentation & Coverage
- 1.3. Years Considered for the Study
- 1.4. Currency & Pricing
- 1.5. Language
- 1.6. Limitations
- 1.7. Assumptions
- 1.8. Stakeholders
2. Research Methodology
- 2.1. Define: Research Objective
- 2.2. Determine: Research Design
- 2.3. Prepare: Research Instrument
- 2.4. Collect: Data Source
- 2.5. Analyze: Data Interpretation
- 2.6. Formulate: Data Verification
- 2.7. Publish: Research Report
- 2.8. Repeat: Report Update
3. Executive Summary
4. Market Overview
- 4.1. Introduction
- 4.2. Polymer Blends & Alloys Market, by Region
5. Market Insights
- 5.1. Market Dynamics
- 5.1.1. Drivers
- 5.1.1.1. Growing demand for lightweight materials to improve fuel efficiency and reduce emissions
- 5.1.1.2. Rising inclination towards eco-friendly materials across industries
- 5.1.1.3. Emerging potential across packaging and electronics industries
- 5.1.2. Restraints
- 5.1.2.1. High cost of raw materials associated with polymer blends & alloys
- 5.1.3. Opportunities
- 5.1.3.1. Rising research & development activities to introduce advanced polymer blends & alloys
- 5.1.3.2. Growing inclination towards customized polymer blends & alloys
- 5.1.4. Challenges
- 5.1.4.1. Performance trade-offs with polymer blends & alloys
- 5.1.1. Drivers
- 5.2. Market Segmentation Analysis
- 5.2.1. Type: Higher preferences for PPE/PPO materials to address specific challenges related to flame retardance and chemical resistance.
- 5.2.2. Application: Growing demand for fuel-efficient and flexible polymer blends & alloys in the automotive industry
- 5.3. Market Trend Analysis
- 5.4. Cumulative Impact of High Inflation
- 5.5. Porter's Five Forces Analysis
- 5.5.1. Threat of New Entrants
- 5.5.2. Threat of Substitutes
- 5.5.3. Bargaining Power of Customers
- 5.5.4. Bargaining Power of Suppliers
- 5.5.5. Industry Rivalry
- 5.6. Value Chain & Critical Path Analysis
- 5.7. Regulatory Framework
6. Polymer Blends & Alloys Market, by Type
- 6.1. Introduction
- 6.2. Polycarbonate
- 6.3. PPE/PPO
7. Polymer Blends & Alloys Market, by Application
- 7.1. Introduction
- 7.2. Aerospace
- 7.3. Automotive
- 7.4. Electrical & Electronics
8. Americas Polymer Blends & Alloys Market
- 8.1. Introduction
- 8.2. Argentina
- 8.3. Brazil
- 8.4. Canada
- 8.5. Mexico
- 8.6. United States
9. Asia-Pacific Polymer Blends & Alloys Market
- 9.1. Introduction
- 9.2. Australia
- 9.3. China
- 9.4. India
- 9.5. Indonesia
- 9.6. Japan
- 9.7. Malaysia
- 9.8. Philippines
- 9.9. Singapore
- 9.10. South Korea
- 9.11. Taiwan
- 9.12. Thailand
- 9.13. Vietnam
10. Europe, Middle East & Africa Polymer Blends & Alloys Market
- 10.1. Introduction
- 10.2. Denmark
- 10.3. Egypt
- 10.4. Finland
- 10.5. France
- 10.6. Germany
- 10.7. Israel
- 10.8. Italy
- 10.9. Netherlands
- 10.10. Nigeria
- 10.11. Norway
- 10.12. Poland
- 10.13. Qatar
- 10.14. Russia
- 10.15. Saudi Arabia
- 10.16. South Africa
- 10.17. Spain
- 10.18. Sweden
- 10.19. Switzerland
- 10.20. Turkey
- 10.21. United Arab Emirates
- 10.22. United Kingdom
11. Competitive Landscape
- 11.1. FPNV Positioning Matrix
- 11.2. Market Share Analysis, By Key Player
- 11.3. Competitive Scenario Analysis, By Key Player
- 11.3.1. Agreement, Collaboration, & Partnership
- 11.3.1.1. FRX Innovations Enters into Strategic MOU with Polymer Compounders to Supply Over USD 10 Million of Nofia Flame Retardant Additives
- 11.3.2. New Product Launch & Enhancement
- 11.3.2.1. FRX Innovations Invents New Polycarbonate Formulations Free of Forever Chemicals
- 11.3.2.2. Asahi Kasei Introduces New XYRON mPPE Grades - Versatile Materials for Improved Efficiency of 5G Applications
- 11.3.1. Agreement, Collaboration, & Partnership
12. Competitive Portfolio
- 12.1. Key Company Profiles
- 12.1.1. Americhem
- 12.1.2. Arkema S.A.
- 12.1.3. Asahi Kasei Corporation
- 12.1.4. Axel Polymers Limited
- 12.1.5. Bada AG
- 12.1.6. BASF SE
- 12.1.7. Celanese Corporation
- 12.1.8. CHEMIEURO
- 12.1.9. CHIMEI Corporation
- 12.1.10. Covestro AG
- 12.1.11. Daicel Corporation
- 12.1.12. Dirco Polymers Pvt Ltd
- 12.1.13. Foster Corporation
- 12.1.14. INEOS Styrolution Group GmbH
- 12.1.15. JSR Corporation
- 12.1.16. LG Chem Ltd.
- 12.1.17. LyondellBasell Industries Holdings B.V.
- 12.1.18. Mitsubishi Engineering-Plastics Corporation
- 12.1.19. Padmanabh Alloys & Polymers Ltd
- 12.1.20. PLUSS Advanced Technologies
- 12.1.21. Polykemi AB
- 12.1.22. Radici Partecipazioni SpA
- 12.1.23. Romira GmbH
- 12.1.24. SABIC
- 12.1.25. Trinseo PLC
- 12.2. Key Product Portfolio
13. Appendix
- 13.1. Discussion Guide
- 13.2. License & Pricing
LIST OF FIGURES
- FIGURE 1. POLYMER BLENDS & ALLOYS MARKET RESEARCH PROCESS
- FIGURE 2. POLYMER BLENDS & ALLOYS MARKET SIZE, 2023 VS 2030
- FIGURE 3. POLYMER BLENDS & ALLOYS MARKET SIZE, 2018-2030 (USD MILLION)
- FIGURE 4. POLYMER BLENDS & ALLOYS MARKET SIZE, BY REGION, 2023 VS 2030 (%)
- FIGURE 5. POLYMER BLENDS & ALLOYS MARKET SIZE, BY REGION, 2023 VS 2024 VS 2030 (USD MILLION)
- FIGURE 6. POLYMER BLENDS & ALLOYS MARKET DYNAMICS
- FIGURE 7. POLYMER BLENDS & ALLOYS MARKET SIZE, BY TYPE, 2023 VS 2030 (%)
- FIGURE 8. POLYMER BLENDS & ALLOYS MARKET SIZE, BY TYPE, 2023 VS 2024 VS 2030 (USD MILLION)
- FIGURE 9. POLYMER BLENDS & ALLOYS MARKET SIZE, BY APPLICATION, 2023 VS 2030 (%)
- FIGURE 10. POLYMER BLENDS & ALLOYS MARKET SIZE, BY APPLICATION, 2023 VS 2024 VS 2030 (USD MILLION)
- FIGURE 11. AMERICAS POLYMER BLENDS & ALLOYS MARKET SIZE, BY COUNTRY, 2023 VS 2030 (%)
- FIGURE 12. AMERICAS POLYMER BLENDS & ALLOYS MARKET SIZE, BY COUNTRY, 2023 VS 2024 VS 2030 (USD MILLION)
- FIGURE 13. UNITED STATES POLYMER BLENDS & ALLOYS MARKET SIZE, BY STATE, 2023 VS 2030 (%)
- FIGURE 14. UNITED STATES POLYMER BLENDS & ALLOYS MARKET SIZE, BY STATE, 2023 VS 2024 VS 2030 (USD MILLION)
- FIGURE 15. ASIA-PACIFIC POLYMER BLENDS & ALLOYS MARKET SIZE, BY COUNTRY, 2023 VS 2030 (%)
- FIGURE 16. ASIA-PACIFIC POLYMER BLENDS & ALLOYS MARKET SIZE, BY COUNTRY, 2023 VS 2024 VS 2030 (USD MILLION)
- FIGURE 17. EUROPE, MIDDLE EAST & AFRICA POLYMER BLENDS & ALLOYS MARKET SIZE, BY COUNTRY, 2023 VS 2030 (%)
- FIGURE 18. EUROPE, MIDDLE EAST & AFRICA POLYMER BLENDS & ALLOYS MARKET SIZE, BY COUNTRY, 2023 VS 2024 VS 2030 (USD MILLION)
- FIGURE 19. POLYMER BLENDS & ALLOYS MARKET, FPNV POSITIONING MATRIX, 2023
- FIGURE 20. POLYMER BLENDS & ALLOYS MARKET SHARE, BY KEY PLAYER, 2023
LIST OF TABLES
- TABLE 1. POLYMER BLENDS & ALLOYS MARKET SEGMENTATION & COVERAGE
- TABLE 2. UNITED STATES DOLLAR EXCHANGE RATE, 2018-2023
- TABLE 3. POLYMER BLENDS & ALLOYS MARKET SIZE, 2018-2030 (USD MILLION)
- TABLE 4. GLOBAL POLYMER BLENDS & ALLOYS MARKET SIZE, BY REGION, 2018-2030 (USD MILLION)
- TABLE 5. POLYMER BLENDS & ALLOYS MARKET SIZE, BY TYPE, 2018-2030 (USD MILLION)
- TABLE 6. POLYMER BLENDS & ALLOYS MARKET SIZE, BY POLYCARBONATE, BY REGION, 2018-2030 (USD MILLION)
- TABLE 7. POLYMER BLENDS & ALLOYS MARKET SIZE, BY PPE/PPO, BY REGION, 2018-2030 (USD MILLION)
- TABLE 8. POLYMER BLENDS & ALLOYS MARKET SIZE, BY APPLICATION, 2018-2030 (USD MILLION)
- TABLE 9. POLYMER BLENDS & ALLOYS MARKET SIZE, BY AEROSPACE, BY REGION, 2018-2030 (USD MILLION)
- TABLE 10. POLYMER BLENDS & ALLOYS MARKET SIZE, BY AUTOMOTIVE, BY REGION, 2018-2030 (USD MILLION)
- TABLE 11. POLYMER BLENDS & ALLOYS MARKET SIZE, BY ELECTRICAL & ELECTRONICS, BY REGION, 2018-2030 (USD MILLION)
- TABLE 12. AMERICAS POLYMER BLENDS & ALLOYS MARKET SIZE, BY TYPE, 2018-2030 (USD MILLION)
- TABLE 13. AMERICAS POLYMER BLENDS & ALLOYS MARKET SIZE, BY APPLICATION, 2018-2030 (USD MILLION)
- TABLE 14. AMERICAS POLYMER BLENDS & ALLOYS MARKET SIZE, BY COUNTRY, 2018-2030 (USD MILLION)
- TABLE 15. ARGENTINA POLYMER BLENDS & ALLOYS MARKET SIZE, BY TYPE, 2018-2030 (USD MILLION)
- TABLE 16. ARGENTINA POLYMER BLENDS & ALLOYS MARKET SIZE, BY APPLICATION, 2018-2030 (USD MILLION)
- TABLE 17. BRAZIL POLYMER BLENDS & ALLOYS MARKET SIZE, BY TYPE, 2018-2030 (USD MILLION)
- TABLE 18. BRAZIL POLYMER BLENDS & ALLOYS MARKET SIZE, BY APPLICATION, 2018-2030 (USD MILLION)
- TABLE 19. CANADA POLYMER BLENDS & ALLOYS MARKET SIZE, BY TYPE, 2018-2030 (USD MILLION)
- TABLE 20. CANADA POLYMER BLENDS & ALLOYS MARKET SIZE, BY APPLICATION, 2018-2030 (USD MILLION)
- TABLE 21. MEXICO POLYMER BLENDS & ALLOYS MARKET SIZE, BY TYPE, 2018-2030 (USD MILLION)
- TABLE 22. MEXICO POLYMER BLENDS & ALLOYS MARKET SIZE, BY APPLICATION, 2018-2030 (USD MILLION)
- TABLE 23. UNITED STATES POLYMER BLENDS & ALLOYS MARKET SIZE, BY TYPE, 2018-2030 (USD MILLION)
- TABLE 24. UNITED STATES POLYMER BLENDS & ALLOYS MARKET SIZE, BY APPLICATION, 2018-2030 (USD MILLION)
- TABLE 25. UNITED STATES POLYMER BLENDS & ALLOYS MARKET SIZE, BY STATE, 2018-2030 (USD MILLION)
- TABLE 26. ASIA-PACIFIC POLYMER BLENDS & ALLOYS MARKET SIZE, BY TYPE, 2018-2030 (USD MILLION)
- TABLE 27. ASIA-PACIFIC POLYMER BLENDS & ALLOYS MARKET SIZE, BY APPLICATION, 2018-2030 (USD MILLION)
- TABLE 28. ASIA-PACIFIC POLYMER BLENDS & ALLOYS MARKET SIZE, BY COUNTRY, 2018-2030 (USD MILLION)
- TABLE 29. AUSTRALIA POLYMER BLENDS & ALLOYS MARKET SIZE, BY TYPE, 2018-2030 (USD MILLION)
- TABLE 30. AUSTRALIA POLYMER BLENDS & ALLOYS MARKET SIZE, BY APPLICATION, 2018-2030 (USD MILLION)
- TABLE 31. CHINA POLYMER BLENDS & ALLOYS MARKET SIZE, BY TYPE, 2018-2030 (USD MILLION)
- TABLE 32. CHINA POLYMER BLENDS & ALLOYS MARKET SIZE, BY APPLICATION, 2018-2030 (USD MILLION)
- TABLE 33. INDIA POLYMER BLENDS & ALLOYS MARKET SIZE, BY TYPE, 2018-2030 (USD MILLION)
- TABLE 34. INDIA POLYMER BLENDS & ALLOYS MARKET SIZE, BY APPLICATION, 2018-2030 (USD MILLION)
- TABLE 35. INDONESIA POLYMER BLENDS & ALLOYS MARKET SIZE, BY TYPE, 2018-2030 (USD MILLION)
- TABLE 36. INDONESIA POLYMER BLENDS & ALLOYS MARKET SIZE, BY APPLICATION, 2018-2030 (USD MILLION)
- TABLE 37. JAPAN POLYMER BLENDS & ALLOYS MARKET SIZE, BY TYPE, 2018-2030 (USD MILLION)
- TABLE 38. JAPAN POLYMER BLENDS & ALLOYS MARKET SIZE, BY APPLICATION, 2018-2030 (USD MILLION)
- TABLE 39. MALAYSIA POLYMER BLENDS & ALLOYS MARKET SIZE, BY TYPE, 2018-2030 (USD MILLION)
- TABLE 40. MALAYSIA POLYMER BLENDS & ALLOYS MARKET SIZE, BY APPLICATION, 2018-2030 (USD MILLION)
- TABLE 41. PHILIPPINES POLYMER BLENDS & ALLOYS MARKET SIZE, BY TYPE, 2018-2030 (USD MILLION)
- TABLE 42. PHILIPPINES POLYMER BLENDS & ALLOYS MARKET SIZE, BY APPLICATION, 2018-2030 (USD MILLION)
- TABLE 43. SINGAPORE POLYMER BLENDS & ALLOYS MARKET SIZE, BY TYPE, 2018-2030 (USD MILLION)
- TABLE 44. SINGAPORE POLYMER BLENDS & ALLOYS MARKET SIZE, BY APPLICATION, 2018-2030 (USD MILLION)
- TABLE 45. SOUTH KOREA POLYMER BLENDS & ALLOYS MARKET SIZE, BY TYPE, 2018-2030 (USD MILLION)
- TABLE 46. SOUTH KOREA POLYMER BLENDS & ALLOYS MARKET SIZE, BY APPLICATION, 2018-2030 (USD MILLION)
- TABLE 47. TAIWAN POLYMER BLENDS & ALLOYS MARKET SIZE, BY TYPE, 2018-2030 (USD MILLION)
- TABLE 48. TAIWAN POLYMER BLENDS & ALLOYS MARKET SIZE, BY APPLICATION, 2018-2030 (USD MILLION)
- TABLE 49. THAILAND POLYMER BLENDS & ALLOYS MARKET SIZE, BY TYPE, 2018-2030 (USD MILLION)
- TABLE 50. THAILAND POLYMER BLENDS & ALLOYS MARKET SIZE, BY APPLICATION, 2018-2030 (USD MILLION)
- TABLE 51. VIETNAM POLYMER BLENDS & ALLOYS MARKET SIZE, BY TYPE, 2018-2030 (USD MILLION)
- TABLE 52. VIETNAM POLYMER BLENDS & ALLOYS MARKET SIZE, BY APPLICATION, 2018-2030 (USD MILLION)
- TABLE 53. EUROPE, MIDDLE EAST & AFRICA POLYMER BLENDS & ALLOYS MARKET SIZE, BY TYPE, 2018-2030 (USD MILLION)
- TABLE 54. EUROPE, MIDDLE EAST & AFRICA POLYMER BLENDS & ALLOYS MARKET SIZE, BY APPLICATION, 2018-2030 (USD MILLION)
- TABLE 55. EUROPE, MIDDLE EAST & AFRICA POLYMER BLENDS & ALLOYS MARKET SIZE, BY COUNTRY, 2018-2030 (USD MILLION)
- TABLE 56. DENMARK POLYMER BLENDS & ALLOYS MARKET SIZE, BY TYPE, 2018-2030 (USD MILLION)
- TABLE 57. DENMARK POLYMER BLENDS & ALLOYS MARKET SIZE, BY APPLICATION, 2018-2030 (USD MILLION)
- TABLE 58. EGYPT POLYMER BLENDS & ALLOYS MARKET SIZE, BY TYPE, 2018-2030 (USD MILLION)
- TABLE 59. EGYPT POLYMER BLENDS & ALLOYS MARKET SIZE, BY APPLICATION, 2018-2030 (USD MILLION)
- TABLE 60. FINLAND POLYMER BLENDS & ALLOYS MARKET SIZE, BY TYPE, 2018-2030 (USD MILLION)
- TABLE 61. FINLAND POLYMER BLENDS & ALLOYS MARKET SIZE, BY APPLICATION, 2018-2030 (USD MILLION)
- TABLE 62. FRANCE POLYMER BLENDS & ALLOYS MARKET SIZE, BY TYPE, 2018-2030 (USD MILLION)
- TABLE 63. FRANCE POLYMER BLENDS & ALLOYS MARKET SIZE, BY APPLICATION, 2018-2030 (USD MILLION)
- TABLE 64. GERMANY POLYMER BLENDS & ALLOYS MARKET SIZE, BY TYPE, 2018-2030 (USD MILLION)
- TABLE 65. GERMANY POLYMER BLENDS & ALLOYS MARKET SIZE, BY APPLICATION, 2018-2030 (USD MILLION)
- TABLE 66. ISRAEL POLYMER BLENDS & ALLOYS MARKET SIZE, BY TYPE, 2018-2030 (USD MILLION)
- TABLE 67. ISRAEL POLYMER BLENDS & ALLOYS MARKET SIZE, BY APPLICATION, 2018-2030 (USD MILLION)
- TABLE 68. ITALY POLYMER BLENDS & ALLOYS MARKET SIZE, BY TYPE, 2018-2030 (USD MILLION)
- TABLE 69. ITALY POLYMER BLENDS & ALLOYS MARKET SIZE, BY APPLICATION, 2018-2030 (USD MILLION)
- TABLE 70. NETHERLANDS POLYMER BLENDS & ALLOYS MARKET SIZE, BY TYPE, 2018-2030 (USD MILLION)
- TABLE 71. NETHERLANDS POLYMER BLENDS & ALLOYS MARKET SIZE, BY APPLICATION, 2018-2030 (USD MILLION)
- TABLE 72. NIGERIA POLYMER BLENDS & ALLOYS MARKET SIZE, BY TYPE, 2018-2030 (USD MILLION)
- TABLE 73. NIGERIA POLYMER BLENDS & ALLOYS MARKET SIZE, BY APPLICATION, 2018-2030 (USD MILLION)
- TABLE 74. NORWAY POLYMER BLENDS & ALLOYS MARKET SIZE, BY TYPE, 2018-2030 (USD MILLION)
- TABLE 75. NORWAY POLYMER BLENDS & ALLOYS MARKET SIZE, BY APPLICATION, 2018-2030 (USD MILLION)
- TABLE 76. POLAND POLYMER BLENDS & ALLOYS MARKET SIZE, BY TYPE, 2018-2030 (USD MILLION)
- TABLE 77. POLAND POLYMER BLENDS & ALLOYS MARKET SIZE, BY APPLICATION, 2018-2030 (USD MILLION)
- TABLE 78. QATAR POLYMER BLENDS & ALLOYS MARKET SIZE, BY TYPE, 2018-2030 (USD MILLION)
- TABLE 79. QATAR POLYMER BLENDS & ALLOYS MARKET SIZE, BY APPLICATION, 2018-2030 (USD MILLION)
- TABLE 80. RUSSIA POLYMER BLENDS & ALLOYS MARKET SIZE, BY TYPE, 2018-2030 (USD MILLION)
- TABLE 81. RUSSIA POLYMER BLENDS & ALLOYS MARKET SIZE, BY APPLICATION, 2018-2030 (USD MILLION)
- TABLE 82. SAUDI ARABIA POLYMER BLENDS & ALLOYS MARKET SIZE, BY TYPE, 2018-2030 (USD MILLION)
- TABLE 83. SAUDI ARABIA POLYMER BLENDS & ALLOYS MARKET SIZE, BY APPLICATION, 2018-2030 (USD MILLION)
- TABLE 84. SOUTH AFRICA POLYMER BLENDS & ALLOYS MARKET SIZE, BY TYPE, 2018-2030 (USD MILLION)
- TABLE 85. SOUTH AFRICA POLYMER BLENDS & ALLOYS MARKET SIZE, BY APPLICATION, 2018-2030 (USD MILLION)
- TABLE 86. SPAIN POLYMER BLENDS & ALLOYS MARKET SIZE, BY TYPE, 2018-2030 (USD MILLION)
- TABLE 87. SPAIN POLYMER BLENDS & ALLOYS MARKET SIZE, BY APPLICATION, 2018-2030 (USD MILLION)
- TABLE 88. SWEDEN POLYMER BLENDS & ALLOYS MARKET SIZE, BY TYPE, 2018-2030 (USD MILLION)
- TABLE 89. SWEDEN POLYMER BLENDS & ALLOYS MARKET SIZE, BY APPLICATION, 2018-2030 (USD MILLION)
- TABLE 90. SWITZERLAND POLYMER BLENDS & ALLOYS MARKET SIZE, BY TYPE, 2018-2030 (USD MILLION)
- TABLE 91. SWITZERLAND POLYMER BLENDS & ALLOYS MARKET SIZE, BY APPLICATION, 2018-2030 (USD MILLION)
- TABLE 92. TURKEY POLYMER BLENDS & ALLOYS MARKET SIZE, BY TYPE, 2018-2030 (USD MILLION)
- TABLE 93. TURKEY POLYMER BLENDS & ALLOYS MARKET SIZE, BY APPLICATION, 2018-2030 (USD MILLION)
- TABLE 94. UNITED ARAB EMIRATES POLYMER BLENDS & ALLOYS MARKET SIZE, BY TYPE, 2018-2030 (USD MILLION)
- TABLE 95. UNITED ARAB EMIRATES POLYMER BLENDS & ALLOYS MARKET SIZE, BY APPLICATION, 2018-2030 (USD MILLION)
- TABLE 96. UNITED KINGDOM POLYMER BLENDS & ALLOYS MARKET SIZE, BY TYPE, 2018-2030 (USD MILLION)
- TABLE 97. UNITED KINGDOM POLYMER BLENDS & ALLOYS MARKET SIZE, BY APPLICATION, 2018-2030 (USD MILLION)
- TABLE 98. POLYMER BLENDS & ALLOYS MARKET, FPNV POSITIONING MATRIX, 2023
- TABLE 99. POLYMER BLENDS & ALLOYS MARKET SHARE, BY KEY PLAYER, 2023
- TABLE 100. POLYMER BLENDS & ALLOYS MARKET LICENSE & PRICING
 聚合物和先进材料的竞争和市场战略信息订阅
 聚合物共混物和合金的全球市场
 聚合物混合·聚合物合金的全球市场:各类型,各用途,各地区 - 预测(~2028年)
 PC 和 PC/ABS IT 伺服器市场:按类型(阻燃级、通用级)、最终用户(家用电器、汽车、电子产品)划分 - COVID-19、俄罗斯-乌克兰衝突、高通膨的累积影响- 2023 年- 世界2030年预测
 聚合物基复合材料市场:按类型、材料基体、黏剂类型、用途- 2023-2030 年全球预测
 生物医学应用的陶瓷聚合物复合材料市场 - 2023-2031年全球行业分析、规模、份额、增长、趋势和预测
 二氧戊环全球市场研究报告 - 2023-2030 年行业分析、规模、份额、增长、趋势和预测
 高分子复合材料的全球市场:2016年~2032年
 先进高分子复合材料的全球市场调查报告-产业分析,规模,占有率,成长,趋势,2022年~2028年前的预测
 先进聚合物复合材料的全球市场 (2022年~2030年):市场规模 (各产品、用途)、COVID-19影响、地区的展望、成长可能性、价格趋势、竞争市场占有率、预测