


 |
市场调查报告书
商品编码
1415307
稀土金属浸出化学品市场:按化学品类型、金属类型、应用划分 - 2024-2030 年全球预测Rare Earth Metals Leaching Chemicals Market by Chemical Type (Acetic Acid, Ammonium Sulfate, Citric Acid), Metal Type (Heavy Rare Earth Metal, Light Rare Earth Metal), Application - Global Forecast 2024-2030 |
||||||
※ 本网页内容可能与最新版本有所差异。详细情况请与我们联繫。
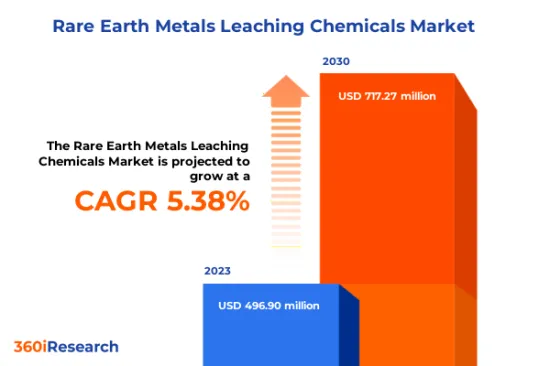
预计2023年稀土金属浸出化学品市场规模为4.969亿美元,预计2024年将达5.2349亿美元,2030年将达到7.1727亿美元,复合年增长率为5.38%。
全球稀土金属浸出化学品市场
| 主要市场统计 | |
|---|---|
| 基准年[2023] | 4.969 亿美元 |
| 预测年份 [2024] | 5.2349亿美元 |
| 预测年份 [2030] | 71727万美元 |
| 复合年增长率(%) | 5.38% |
稀土元素是指17种金属元素,分为轻元素(镧至钐)和重元素(铕至镏)。透过湿式冶金製程从磷矿中回收稀土时用作浸出剂的各种酸,如硫酸(H2SO4)、硝酸(HNO3)、磷酸(H3PO4)和盐酸(HCL),称为稀土酸。地球金属浸出化学品。微电子、半导体和技术设备对稀土元素的需求不断增长,因此需要采用浸出化学方法来获取必需的稀土元素。此外,政府加速稀土开采的努力正在巩固浸出化学品和技术的成长和采用。然而,环境和永续性问题以及公共卫生问题对稀土金属浸出化学物质的成长构成了监管和法律障碍。此外,浸出化学方法的不可靠性以及无法实现稀土元素的充分分离阻碍了稀土金属浸出化学方法的广泛采用。然而,领先企业不断投资提高浸出技术的永续性,并投资开发永续硫酸和永续盐酸技术工厂。此外,透过私人合作伙伴关係加速稀土元素提取的浸出技术的进步以及人工智慧/机器学习技术的采用可以显着提高金属浸出的可靠性和准确性。
区域洞察
美洲地区的特点是拥有先进的化工厂和浸出设备,推动了该地区浸出化学品的成长。此外,电子产品采用的增加、数位化努力的增加以及主要技术企业的存在创造了对稀土元素和相关浸出化学品的需求。欧盟主要国家支持永续采矿实践和浸出方法,这推动了环保浸出化学物质的采用。德国、英国和法国等欧洲国家都参与了改善浸出化学品功能的研究和开发倡议。旨在探勘和发现稀土元素矿床的政府和私人倡议已在欧洲成功实施。在亚太地区的印度和中国等国家,稀土金属开采得到了政府努力的支持,以减少对国际贸易的依赖,从而增强了国内对浸出化学品的需求。此外,由于采矿业和地质宝藏的多样化,中国、印度和越南是最大的稀土金属生产国之一。快速成长的半导体产业和不断发展的新兴企业也有助于加速对稀土金属浸出化学品的需求。
FPNV定位矩阵
FPNV定位矩阵对于评估稀土金属浸出化学物质市场至关重要。我们检视与业务策略和产品满意度相关的关键指标,以对供应商进行全面评估。这种深入的分析使用户能够根据自己的要求做出明智的决策。根据评估,供应商被分为四个成功程度不同的像限:前沿(F)、探路者(P)、利基(N)和重要(V)。
市场占有率分析
市场占有率分析是一种综合工具,可以对稀土金属浸出化学品市场供应商的现状进行深入而详细的研究。全面比较和分析供应商在整体收益、基本客群和其他关键指标方面的贡献,以便更好地了解公司的绩效及其在争夺市场占有率时面临的挑战。此外,该分析还提供了对该行业竞争特征的宝贵考察,包括在研究基准年观察到的累积、分散主导地位和合併特征等因素。这种详细程度的提高使供应商能够做出更明智的决策并制定有效的策略,从而在市场上获得竞争优势。
本报告在以下方面提供了宝贵的见解:
1-市场渗透率:提供有关主要企业所服务的市场的全面资讯。
2-市场开拓:我们深入研究利润丰厚的新兴市场,并分析它们在成熟细分市场中的渗透率。
3- 市场多元化:提供有关新产品发布、开拓地区、最新发展和投资的详细资讯。
4-竞争力评估与资讯:对主要企业的市场占有率、策略、产品、认证、监管状况、专利状况、製造能力等进行全面评估。
5- 产品开发与创新:提供对未来技术、研发活动和突破性产品开发的见解。
本报告解决了以下关键问题:
1-稀土金属浸出化学品市场的市场规模与预测为何?
2-在稀土金属浸出化学品市场的预测期内,有哪些产品、细分市场、应用和领域需要考虑投资?
3-稀土金属浸出化学品市场的技术趋势和法律规范是什么?
4-稀土金属浸出化学品市场主要供应商的市场占有率为何?
5-进入稀土金属浸出化学品市场的合适型态和策略手段是什么?
目录
第一章 前言
第二章调查方法
第三章执行摘要
第四章市场概况
第五章市场洞察
- 市场动态
- 促进因素
- 稀土金属在技术设备和电子元件中的使用增加
- 政府努力扩大稀土元素和金属的采矿作业
- 抑制因素
- 关于使用有毒浸出化学物质的环境问题
- 机会
- 永续浸出化学技术工厂的开发
- 私人合作加速稀土金属萃取与浸出技术的进步
- 任务
- 金属分离不完全的可能性以及浸出化学品使用的技术限制
- 促进因素
- 市场区隔分析
- 化学类型:增加盐酸的使用以实现优异的稀土元素萃取
- 金属种类:重稀土元素产量有限,需求增加
第 5 章 2.3. 应用:
- 市场趋势分析
- 高通膨的累积效应
- 波特五力分析
- 价值炼和关键路径分析
- 法律规范
第六章稀土金属浸出化学品市场(依化学品类型)
- 醋酸
- 硫酸铵
- 柠檬酸
- 盐酸
- 氢氧化钠
- 硫酸
第七章稀土金属浸出化学品市场:依金属类型
- 重稀土元素
- 轻稀土元素
第八章稀土金属浸出化学品市场:依应用分类
- 稀土金属的提取
- 稀土金属回收
第九章美洲稀土金属浸出化学物质市场
- 阿根廷
- 巴西
- 加拿大
- 墨西哥
- 美国
第十章亚太稀土金属浸出化学品市场
- 澳洲
- 中国
- 印度
- 印尼
- 日本
- 马来西亚
- 菲律宾
- 新加坡
- 韩国
- 台湾
- 泰国
- 越南
第十一章欧洲、中东和非洲稀土金属浸出化学品市场
- 丹麦
- 埃及
- 芬兰
- 法国
- 德国
- 以色列
- 义大利
- 荷兰
- 奈及利亚
- 挪威
- 波兰
- 卡达
- 俄罗斯
- 沙乌地阿拉伯
- 南非
- 西班牙
- 瑞典
- 瑞士
- 土耳其
- 阿拉伯聯合大公国
- 英国
第十二章竞争形势
- FPNV定位矩阵
- 市场占有率分析:按主要企业划分
- 主要企业竞争情境分析
- 併购
- 投资、资金筹措
- 奖项/奖励/扩展
第13章竞争产品组合
- 主要公司简介
- Advanced Engineering Materials Limited
- American Elements
- ANHUI FITECH MATERIALS CO., LTD.
- Aurubis AG
- Avalon Advanced Materials Inc.
- BASF SE
- CHENGDU BEYOND CHEMICAL CO., LTD.
- Gujarat Alkalies and Chemical Limited
- Haihang Industry Co., Ltd.
- Iwatani Corporation
- Lanxess AG
- Luossavaara-Kiirunavaara Aktiebolag
- Lynas Rare Earths Ltd
- MP Materials Corporation
- Nanografi Nano Technology
- NIPPON YTTRIUM CO.,LTD
- Olin Corporation
- Otto Chemie Pvt Ltd.
- Oxy Chemical Corporation
- Pacific Industrial Development Corporation
- Shanghai Gona Industrial Co., Ltd.
- Shin-Etsu Chemical Co., Ltd.
- Solvay SA
- Stanford Materials Corporation
- UBE Corporation
- Xinglu Chemical
- 主要产品系列
第十四章附录
- 讨论指南
- 关于许可证和定价
[193 Pages Report] The Rare Earth Metals Leaching Chemicals Market size was estimated at USD 496.90 million in 2023 and expected to reach USD 523.49 million in 2024, at a CAGR 5.38% to reach USD 717.27 million by 2030.
Global Rare Earth Metals Leaching Chemicals Market
| KEY MARKET STATISTICS | |
|---|---|
| Base Year [2023] | USD 496.90 million |
| Estimated Year [2024] | USD 523.49 million |
| Forecast Year [2030] | USD 717.27 million |
| CAGR (%) | 5.38% |
The rare earth metals refer to a set of seventeen metallic elements and are categorized into light elements (lanthanum to samarium) and heavy elements (europium to lutetium). Various acids used as leaching agents in the recovery of rare earth from phosphate rock by hydrometallurgical processes, such as sulphuric acid (H2SO4), Nitric acid (HNO3), phosphoric acid (H3PO4), and hydrochloric acid( HCL) are referred to as rare earth metals leaching chemicals. The rising demand for rare earth metals in microelectronics, semiconductor, and technology devices has necessitated the deployment of leaching chemicals to acquire the essential rare earth metals. Furthermore, government initiatives to accelerate the mining of rare earth metals have cemented the growth and adoption of leaching chemicals and leaching technology. However, environmental and sustainability concerns and public health issues pose regulatory and legal hurdles to the growth of rare earth metal-leaching chemicals. Additionally, the unreliability of leaching chemicals and the inability of chemicals to achieve adequate separation of rare earth metals impede the widespread adoption of rare earth metals leaching chemicals. However, major players are constantly investing to improve the sustainability of leaching technologies and have invested in the development of sustainable sulphuric acid and sustainable hydrochloric acid technology plants. Additionally, private partnerships to accelerate the extraction of rare earth metals and advancements in leaching technologies through the adoption of AI/ML technologies can significantly improve the reliability and accuracy of leaching metals.
Regional Insights
The Americas region is characterized by the presence of advanced chemical plants and leaching equipment, driving the growth of leaching chemicals in this region. Furthermore, the rising adoption of electronic gadgets, rampant digitization efforts, and the presence of major technological businesses created a need for rare earth metals and associated leaching chemicals. Major European Union nations favor sustainable mining practices and leaching methodologies, which has driven the adoption of environmentally conscious leaching chemicals. European countries, including Germany, the U.K., and France, are involved in R&D initiatives to improve the functionality of leaching chemicals. Government and private initiatives to explore and discover rare earth metal deposits in Europe have been successfully carried out. In the APAC region, countries such as India and China, rare earth metal mining has been supported by government initiatives to reduce dependence on international trade, cementing the national demand for leaching chemicals. Additionally, China, India, and Vietnam are some of the largest producers of rare earth metals, owing to their diverse mining sectors and geological treasures. The presence of a burgeoning semiconductor industry and an evolving startup ecosystem also contribute to accelerating the demand for rare earth metal-leaching chemicals.
FPNV Positioning Matrix
The FPNV Positioning Matrix is pivotal in evaluating the Rare Earth Metals Leaching Chemicals Market. It offers a comprehensive assessment of vendors, examining key metrics related to Business Strategy and Product Satisfaction. This in-depth analysis empowers users to make well-informed decisions aligned with their requirements. Based on the evaluation, the vendors are then categorized into four distinct quadrants representing varying levels of success: Forefront (F), Pathfinder (P), Niche (N), or Vital (V).
Market Share Analysis
The Market Share Analysis is a comprehensive tool that provides an insightful and in-depth examination of the current state of vendors in the Rare Earth Metals Leaching Chemicals Market. By meticulously comparing and analyzing vendor contributions in terms of overall revenue, customer base, and other key metrics, we can offer companies a greater understanding of their performance and the challenges they face when competing for market share. Additionally, this analysis provides valuable insights into the competitive nature of the sector, including factors such as accumulation, fragmentation dominance, and amalgamation traits observed over the base year period studied. With this expanded level of detail, vendors can make more informed decisions and devise effective strategies to gain a competitive edge in the market.
Key Company Profiles
The report delves into recent significant developments in the Rare Earth Metals Leaching Chemicals Market, highlighting leading vendors and their innovative profiles. These include Advanced Engineering Materials Limited, American Elements, ANHUI FITECH MATERIALS CO., LTD., Aurubis AG, Avalon Advanced Materials Inc., BASF SE, CHENGDU BEYOND CHEMICAL CO., LTD., Gujarat Alkalies and Chemical Limited, Haihang Industry Co., Ltd., Iwatani Corporation, Lanxess AG, Luossavaara-Kiirunavaara Aktiebolag, Lynas Rare Earths Ltd, MP Materials Corporation, Nanografi Nano Technology, NIPPON YTTRIUM CO.,LTD, Olin Corporation, Otto Chemie Pvt Ltd., Oxy Chemical Corporation, Pacific Industrial Development Corporation, Shanghai Gona Industrial Co., Ltd., Shin-Etsu Chemical Co., Ltd., Solvay S.A., Stanford Materials Corporation, UBE Corporation, and Xinglu Chemical.
Market Segmentation & Coverage
This research report categorizes the Rare Earth Metals Leaching Chemicals Market to forecast the revenues and analyze trends in each of the following sub-markets:
- Chemical Type
- Acetic Acid
- Ammonium Sulfate
- Citric Acid
- Hydrochloric Acid
- Sodium Hydroxide
- Sulfuric Acid
- Metal Type
- Heavy Rare Earth Metal
- Light Rare Earth Metal
- Application
- Rare Earth Metal Extraction
- Rare Earth Metal Recycling
- Region
- Americas
- Argentina
- Brazil
- Canada
- Mexico
- United States
- California
- Florida
- Illinois
- New York
- Ohio
- Pennsylvania
- Texas
- Asia-Pacific
- Australia
- China
- India
- Indonesia
- Japan
- Malaysia
- Philippines
- Singapore
- South Korea
- Taiwan
- Thailand
- Vietnam
- Europe, Middle East & Africa
- Denmark
- Egypt
- Finland
- France
- Germany
- Israel
- Italy
- Netherlands
- Nigeria
- Norway
- Poland
- Qatar
- Russia
- Saudi Arabia
- South Africa
- Spain
- Sweden
- Switzerland
- Turkey
- United Arab Emirates
- United Kingdom
- Americas
The report offers valuable insights on the following aspects:
1. Market Penetration: It presents comprehensive information on the market provided by key players.
2. Market Development: It delves deep into lucrative emerging markets and analyzes the penetration across mature market segments.
3. Market Diversification: It provides detailed information on new product launches, untapped geographic regions, recent developments, and investments.
4. Competitive Assessment & Intelligence: It conducts an exhaustive assessment of market shares, strategies, products, certifications, regulatory approvals, patent landscape, and manufacturing capabilities of the leading players.
5. Product Development & Innovation: It offers intelligent insights on future technologies, R&D activities, and breakthrough product developments.
The report addresses key questions such as:
1. What is the market size and forecast of the Rare Earth Metals Leaching Chemicals Market?
2. Which products, segments, applications, and areas should one consider investing in over the forecast period in the Rare Earth Metals Leaching Chemicals Market?
3. What are the technology trends and regulatory frameworks in the Rare Earth Metals Leaching Chemicals Market?
4. What is the market share of the leading vendors in the Rare Earth Metals Leaching Chemicals Market?
5. Which modes and strategic moves are suitable for entering the Rare Earth Metals Leaching Chemicals Market?
Table of Contents
1. Preface
- 1.1. Objectives of the Study
- 1.2. Market Segmentation & Coverage
- 1.3. Years Considered for the Study
- 1.4. Currency & Pricing
- 1.5. Language
- 1.6. Limitations
- 1.7. Assumptions
- 1.8. Stakeholders
2. Research Methodology
- 2.1. Define: Research Objective
- 2.2. Determine: Research Design
- 2.3. Prepare: Research Instrument
- 2.4. Collect: Data Source
- 2.5. Analyze: Data Interpretation
- 2.6. Formulate: Data Verification
- 2.7. Publish: Research Report
- 2.8. Repeat: Report Update
3. Executive Summary
4. Market Overview
- 4.1. Introduction
- 4.2. Rare Earth Metals Leaching Chemicals Market, by Region
5. Market Insights
- 5.1. Market Dynamics
- 5.1.1. Drivers
- 5.1.1.1. Rising utilization of rare earth metals in technology devices and electronic components
- 5.1.1.2. Government initiatives to expand mining operations of rare earth elements and metals
- 5.1.2. Restraints
- 5.1.2.1. Environmental concerns about the use of toxic leaching chemicals
- 5.1.3. Opportunities
- 5.1.3.1. Development of sustainable leaching chemical technology plants
- 5.1.3.2. Private partnerships to accelerate the extraction of rare earth metals and advancements in leaching technologies
- 5.1.4. Challenges
- 5.1.4.1. Chances of incomplete separation of metals and technical limitations of using leaching chemicals
- 5.1.1. Drivers
- 5.2. Market Segmentation Analysis
- 5.2.1. Chemical Type: Rising use of hydrochloric acid to achieve superior rare earth metal extraction
- 5.2.2. Metal Type: Growing demand for heavy rare earth metals due to the limited occurrence
5.2.3. Application:
- 5.3. Market Trend Analysis
- 5.4. Cumulative Impact of High Inflation
- 5.5. Porter's Five Forces Analysis
- 5.5.1. Threat of New Entrants
- 5.5.2. Threat of Substitutes
- 5.5.3. Bargaining Power of Customers
- 5.5.4. Bargaining Power of Suppliers
- 5.5.5. Industry Rivalry
- 5.6. Value Chain & Critical Path Analysis
- 5.7. Regulatory Framework
6. Rare Earth Metals Leaching Chemicals Market, by Chemical Type
- 6.1. Introduction
- 6.2. Acetic Acid
- 6.3. Ammonium Sulfate
- 6.4. Citric Acid
- 6.5. Hydrochloric Acid
- 6.6. Sodium Hydroxide
- 6.7. Sulfuric Acid
7. Rare Earth Metals Leaching Chemicals Market, by Metal Type
- 7.1. Introduction
- 7.2. Heavy Rare Earth Metal
- 7.3. Light Rare Earth Metal
8. Rare Earth Metals Leaching Chemicals Market, by Application
- 8.1. Introduction
- 8.2. Rare Earth Metal Extraction
- 8.3. Rare Earth Metal Recycling
9. Americas Rare Earth Metals Leaching Chemicals Market
- 9.1. Introduction
- 9.2. Argentina
- 9.3. Brazil
- 9.4. Canada
- 9.5. Mexico
- 9.6. United States
10. Asia-Pacific Rare Earth Metals Leaching Chemicals Market
- 10.1. Introduction
- 10.2. Australia
- 10.3. China
- 10.4. India
- 10.5. Indonesia
- 10.6. Japan
- 10.7. Malaysia
- 10.8. Philippines
- 10.9. Singapore
- 10.10. South Korea
- 10.11. Taiwan
- 10.12. Thailand
- 10.13. Vietnam
11. Europe, Middle East & Africa Rare Earth Metals Leaching Chemicals Market
- 11.1. Introduction
- 11.2. Denmark
- 11.3. Egypt
- 11.4. Finland
- 11.5. France
- 11.6. Germany
- 11.7. Israel
- 11.8. Italy
- 11.9. Netherlands
- 11.10. Nigeria
- 11.11. Norway
- 11.12. Poland
- 11.13. Qatar
- 11.14. Russia
- 11.15. Saudi Arabia
- 11.16. South Africa
- 11.17. Spain
- 11.18. Sweden
- 11.19. Switzerland
- 11.20. Turkey
- 11.21. United Arab Emirates
- 11.22. United Kingdom
12. Competitive Landscape
- 12.1. FPNV Positioning Matrix
- 12.2. Market Share Analysis, By Key Player
- 12.3. Competitive Scenario Analysis, By Key Player
- 12.3.1. Merger & Acquisition
- 12.3.1.1. Sumitomo Expands Sulfuric Acid Business in U.S. with Acquisition of Saconix
- 12.3.2. Investment & Funding
- 12.3.2.1. Geomega to Centralize its Activities in St Hubert, Quebec; New R&D Funding for HCl recycling for REE and Sc extraction & Demo Plant Update
- 12.3.3. Award, Recognition, & Expansion
- 12.3.3.1. Installing sustainable sulphuric acid technology for Arafura
- 12.3.1. Merger & Acquisition
13. Competitive Portfolio
- 13.1. Key Company Profiles
- 13.1.1. Advanced Engineering Materials Limited
- 13.1.2. American Elements
- 13.1.3. ANHUI FITECH MATERIALS CO., LTD.
- 13.1.4. Aurubis AG
- 13.1.5. Avalon Advanced Materials Inc.
- 13.1.6. BASF SE
- 13.1.7. CHENGDU BEYOND CHEMICAL CO., LTD.
- 13.1.8. Gujarat Alkalies and Chemical Limited
- 13.1.9. Haihang Industry Co., Ltd.
- 13.1.10. Iwatani Corporation
- 13.1.11. Lanxess AG
- 13.1.12. Luossavaara-Kiirunavaara Aktiebolag
- 13.1.13. Lynas Rare Earths Ltd
- 13.1.14. MP Materials Corporation
- 13.1.15. Nanografi Nano Technology
- 13.1.16. NIPPON YTTRIUM CO.,LTD
- 13.1.17. Olin Corporation
- 13.1.18. Otto Chemie Pvt Ltd.
- 13.1.19. Oxy Chemical Corporation
- 13.1.20. Pacific Industrial Development Corporation
- 13.1.21. Shanghai Gona Industrial Co., Ltd.
- 13.1.22. Shin-Etsu Chemical Co., Ltd.
- 13.1.23. Solvay S.A.
- 13.1.24. Stanford Materials Corporation
- 13.1.25. UBE Corporation
- 13.1.26. Xinglu Chemical
- 13.2. Key Product Portfolio
14. Appendix
- 14.1. Discussion Guide
- 14.2. License & Pricing
LIST OF FIGURES
- FIGURE 1. RARE EARTH METALS LEACHING CHEMICALS MARKET RESEARCH PROCESS
- FIGURE 2. RARE EARTH METALS LEACHING CHEMICALS MARKET SIZE, 2023 VS 2030
- FIGURE 3. RARE EARTH METALS LEACHING CHEMICALS MARKET SIZE, 2018-2030 (USD MILLION)
- FIGURE 4. RARE EARTH METALS LEACHING CHEMICALS MARKET SIZE, BY REGION, 2023 VS 2030 (%)
- FIGURE 5. RARE EARTH METALS LEACHING CHEMICALS MARKET SIZE, BY REGION, 2023 VS 2024 VS 2030 (USD MILLION)
- FIGURE 6. RARE EARTH METALS LEACHING CHEMICALS MARKET DYNAMICS
- FIGURE 7. RARE EARTH METALS LEACHING CHEMICALS MARKET SIZE, BY CHEMICAL TYPE, 2023 VS 2030 (%)
- FIGURE 8. RARE EARTH METALS LEACHING CHEMICALS MARKET SIZE, BY CHEMICAL TYPE, 2023 VS 2024 VS 2030 (USD MILLION)
- FIGURE 9. RARE EARTH METALS LEACHING CHEMICALS MARKET SIZE, BY METAL TYPE, 2023 VS 2030 (%)
- FIGURE 10. RARE EARTH METALS LEACHING CHEMICALS MARKET SIZE, BY METAL TYPE, 2023 VS 2024 VS 2030 (USD MILLION)
- FIGURE 11. RARE EARTH METALS LEACHING CHEMICALS MARKET SIZE, BY APPLICATION, 2023 VS 2030 (%)
- FIGURE 12. RARE EARTH METALS LEACHING CHEMICALS MARKET SIZE, BY APPLICATION, 2023 VS 2024 VS 2030 (USD MILLION)
- FIGURE 13. AMERICAS RARE EARTH METALS LEACHING CHEMICALS MARKET SIZE, BY COUNTRY, 2023 VS 2030 (%)
- FIGURE 14. AMERICAS RARE EARTH METALS LEACHING CHEMICALS MARKET SIZE, BY COUNTRY, 2023 VS 2024 VS 2030 (USD MILLION)
- FIGURE 15. UNITED STATES RARE EARTH METALS LEACHING CHEMICALS MARKET SIZE, BY STATE, 2023 VS 2030 (%)
- FIGURE 16. UNITED STATES RARE EARTH METALS LEACHING CHEMICALS MARKET SIZE, BY STATE, 2023 VS 2024 VS 2030 (USD MILLION)
- FIGURE 17. ASIA-PACIFIC RARE EARTH METALS LEACHING CHEMICALS MARKET SIZE, BY COUNTRY, 2023 VS 2030 (%)
- FIGURE 18. ASIA-PACIFIC RARE EARTH METALS LEACHING CHEMICALS MARKET SIZE, BY COUNTRY, 2023 VS 2024 VS 2030 (USD MILLION)
- FIGURE 19. EUROPE, MIDDLE EAST & AFRICA RARE EARTH METALS LEACHING CHEMICALS MARKET SIZE, BY COUNTRY, 2023 VS 2030 (%)
- FIGURE 20. EUROPE, MIDDLE EAST & AFRICA RARE EARTH METALS LEACHING CHEMICALS MARKET SIZE, BY COUNTRY, 2023 VS 2024 VS 2030 (USD MILLION)
- FIGURE 21. RARE EARTH METALS LEACHING CHEMICALS MARKET, FPNV POSITIONING MATRIX, 2023
- FIGURE 22. RARE EARTH METALS LEACHING CHEMICALS MARKET SHARE, BY KEY PLAYER, 2023
LIST OF TABLES
- TABLE 1. RARE EARTH METALS LEACHING CHEMICALS MARKET SEGMENTATION & COVERAGE
- TABLE 2. UNITED STATES DOLLAR EXCHANGE RATE, 2018-2023
- TABLE 3. RARE EARTH METALS LEACHING CHEMICALS MARKET SIZE, 2018-2030 (USD MILLION)
- TABLE 4. GLOBAL RARE EARTH METALS LEACHING CHEMICALS MARKET SIZE, BY REGION, 2018-2030 (USD MILLION)
- TABLE 5. RARE EARTH METALS LEACHING CHEMICALS MARKET SIZE, BY CHEMICAL TYPE, 2018-2030 (USD MILLION)
- TABLE 6. RARE EARTH METALS LEACHING CHEMICALS MARKET SIZE, BY ACETIC ACID, BY REGION, 2018-2030 (USD MILLION)
- TABLE 7. RARE EARTH METALS LEACHING CHEMICALS MARKET SIZE, BY AMMONIUM SULFATE, BY REGION, 2018-2030 (USD MILLION)
- TABLE 8. RARE EARTH METALS LEACHING CHEMICALS MARKET SIZE, BY CITRIC ACID, BY REGION, 2018-2030 (USD MILLION)
- TABLE 9. RARE EARTH METALS LEACHING CHEMICALS MARKET SIZE, BY HYDROCHLORIC ACID, BY REGION, 2018-2030 (USD MILLION)
- TABLE 10. RARE EARTH METALS LEACHING CHEMICALS MARKET SIZE, BY SODIUM HYDROXIDE, BY REGION, 2018-2030 (USD MILLION)
- TABLE 11. RARE EARTH METALS LEACHING CHEMICALS MARKET SIZE, BY SULFURIC ACID, BY REGION, 2018-2030 (USD MILLION)
- TABLE 12. RARE EARTH METALS LEACHING CHEMICALS MARKET SIZE, BY METAL TYPE, 2018-2030 (USD MILLION)
- TABLE 13. RARE EARTH METALS LEACHING CHEMICALS MARKET SIZE, BY HEAVY RARE EARTH METAL, BY REGION, 2018-2030 (USD MILLION)
- TABLE 14. RARE EARTH METALS LEACHING CHEMICALS MARKET SIZE, BY LIGHT RARE EARTH METAL, BY REGION, 2018-2030 (USD MILLION)
- TABLE 15. RARE EARTH METALS LEACHING CHEMICALS MARKET SIZE, BY APPLICATION, 2018-2030 (USD MILLION)
- TABLE 16. RARE EARTH METALS LEACHING CHEMICALS MARKET SIZE, BY RARE EARTH METAL EXTRACTION, BY REGION, 2018-2030 (USD MILLION)
- TABLE 17. RARE EARTH METALS LEACHING CHEMICALS MARKET SIZE, BY RARE EARTH METAL RECYCLING, BY REGION, 2018-2030 (USD MILLION)
- TABLE 18. AMERICAS RARE EARTH METALS LEACHING CHEMICALS MARKET SIZE, BY CHEMICAL TYPE, 2018-2030 (USD MILLION)
- TABLE 19. AMERICAS RARE EARTH METALS LEACHING CHEMICALS MARKET SIZE, BY METAL TYPE, 2018-2030 (USD MILLION)
- TABLE 20. AMERICAS RARE EARTH METALS LEACHING CHEMICALS MARKET SIZE, BY APPLICATION, 2018-2030 (USD MILLION)
- TABLE 21. AMERICAS RARE EARTH METALS LEACHING CHEMICALS MARKET SIZE, BY COUNTRY, 2018-2030 (USD MILLION)
- TABLE 22. ARGENTINA RARE EARTH METALS LEACHING CHEMICALS MARKET SIZE, BY CHEMICAL TYPE, 2018-2030 (USD MILLION)
- TABLE 23. ARGENTINA RARE EARTH METALS LEACHING CHEMICALS MARKET SIZE, BY METAL TYPE, 2018-2030 (USD MILLION)
- TABLE 24. ARGENTINA RARE EARTH METALS LEACHING CHEMICALS MARKET SIZE, BY APPLICATION, 2018-2030 (USD MILLION)
- TABLE 25. BRAZIL RARE EARTH METALS LEACHING CHEMICALS MARKET SIZE, BY CHEMICAL TYPE, 2018-2030 (USD MILLION)
- TABLE 26. BRAZIL RARE EARTH METALS LEACHING CHEMICALS MARKET SIZE, BY METAL TYPE, 2018-2030 (USD MILLION)
- TABLE 27. BRAZIL RARE EARTH METALS LEACHING CHEMICALS MARKET SIZE, BY APPLICATION, 2018-2030 (USD MILLION)
- TABLE 28. CANADA RARE EARTH METALS LEACHING CHEMICALS MARKET SIZE, BY CHEMICAL TYPE, 2018-2030 (USD MILLION)
- TABLE 29. CANADA RARE EARTH METALS LEACHING CHEMICALS MARKET SIZE, BY METAL TYPE, 2018-2030 (USD MILLION)
- TABLE 30. CANADA RARE EARTH METALS LEACHING CHEMICALS MARKET SIZE, BY APPLICATION, 2018-2030 (USD MILLION)
- TABLE 31. MEXICO RARE EARTH METALS LEACHING CHEMICALS MARKET SIZE, BY CHEMICAL TYPE, 2018-2030 (USD MILLION)
- TABLE 32. MEXICO RARE EARTH METALS LEACHING CHEMICALS MARKET SIZE, BY METAL TYPE, 2018-2030 (USD MILLION)
- TABLE 33. MEXICO RARE EARTH METALS LEACHING CHEMICALS MARKET SIZE, BY APPLICATION, 2018-2030 (USD MILLION)
- TABLE 34. UNITED STATES RARE EARTH METALS LEACHING CHEMICALS MARKET SIZE, BY CHEMICAL TYPE, 2018-2030 (USD MILLION)
- TABLE 35. UNITED STATES RARE EARTH METALS LEACHING CHEMICALS MARKET SIZE, BY METAL TYPE, 2018-2030 (USD MILLION)
- TABLE 36. UNITED STATES RARE EARTH METALS LEACHING CHEMICALS MARKET SIZE, BY APPLICATION, 2018-2030 (USD MILLION)
- TABLE 37. UNITED STATES RARE EARTH METALS LEACHING CHEMICALS MARKET SIZE, BY STATE, 2018-2030 (USD MILLION)
- TABLE 38. ASIA-PACIFIC RARE EARTH METALS LEACHING CHEMICALS MARKET SIZE, BY CHEMICAL TYPE, 2018-2030 (USD MILLION)
- TABLE 39. ASIA-PACIFIC RARE EARTH METALS LEACHING CHEMICALS MARKET SIZE, BY METAL TYPE, 2018-2030 (USD MILLION)
- TABLE 40. ASIA-PACIFIC RARE EARTH METALS LEACHING CHEMICALS MARKET SIZE, BY APPLICATION, 2018-2030 (USD MILLION)
- TABLE 41. ASIA-PACIFIC RARE EARTH METALS LEACHING CHEMICALS MARKET SIZE, BY COUNTRY, 2018-2030 (USD MILLION)
- TABLE 42. AUSTRALIA RARE EARTH METALS LEACHING CHEMICALS MARKET SIZE, BY CHEMICAL TYPE, 2018-2030 (USD MILLION)
- TABLE 43. AUSTRALIA RARE EARTH METALS LEACHING CHEMICALS MARKET SIZE, BY METAL TYPE, 2018-2030 (USD MILLION)
- TABLE 44. AUSTRALIA RARE EARTH METALS LEACHING CHEMICALS MARKET SIZE, BY APPLICATION, 2018-2030 (USD MILLION)
- TABLE 45. CHINA RARE EARTH METALS LEACHING CHEMICALS MARKET SIZE, BY CHEMICAL TYPE, 2018-2030 (USD MILLION)
- TABLE 46. CHINA RARE EARTH METALS LEACHING CHEMICALS MARKET SIZE, BY METAL TYPE, 2018-2030 (USD MILLION)
- TABLE 47. CHINA RARE EARTH METALS LEACHING CHEMICALS MARKET SIZE, BY APPLICATION, 2018-2030 (USD MILLION)
- TABLE 48. INDIA RARE EARTH METALS LEACHING CHEMICALS MARKET SIZE, BY CHEMICAL TYPE, 2018-2030 (USD MILLION)
- TABLE 49. INDIA RARE EARTH METALS LEACHING CHEMICALS MARKET SIZE, BY METAL TYPE, 2018-2030 (USD MILLION)
- TABLE 50. INDIA RARE EARTH METALS LEACHING CHEMICALS MARKET SIZE, BY APPLICATION, 2018-2030 (USD MILLION)
- TABLE 51. INDONESIA RARE EARTH METALS LEACHING CHEMICALS MARKET SIZE, BY CHEMICAL TYPE, 2018-2030 (USD MILLION)
- TABLE 52. INDONESIA RARE EARTH METALS LEACHING CHEMICALS MARKET SIZE, BY METAL TYPE, 2018-2030 (USD MILLION)
- TABLE 53. INDONESIA RARE EARTH METALS LEACHING CHEMICALS MARKET SIZE, BY APPLICATION, 2018-2030 (USD MILLION)
- TABLE 54. JAPAN RARE EARTH METALS LEACHING CHEMICALS MARKET SIZE, BY CHEMICAL TYPE, 2018-2030 (USD MILLION)
- TABLE 55. JAPAN RARE EARTH METALS LEACHING CHEMICALS MARKET SIZE, BY METAL TYPE, 2018-2030 (USD MILLION)
- TABLE 56. JAPAN RARE EARTH METALS LEACHING CHEMICALS MARKET SIZE, BY APPLICATION, 2018-2030 (USD MILLION)
- TABLE 57. MALAYSIA RARE EARTH METALS LEACHING CHEMICALS MARKET SIZE, BY CHEMICAL TYPE, 2018-2030 (USD MILLION)
- TABLE 58. MALAYSIA RARE EARTH METALS LEACHING CHEMICALS MARKET SIZE, BY METAL TYPE, 2018-2030 (USD MILLION)
- TABLE 59. MALAYSIA RARE EARTH METALS LEACHING CHEMICALS MARKET SIZE, BY APPLICATION, 2018-2030 (USD MILLION)
- TABLE 60. PHILIPPINES RARE EARTH METALS LEACHING CHEMICALS MARKET SIZE, BY CHEMICAL TYPE, 2018-2030 (USD MILLION)
- TABLE 61. PHILIPPINES RARE EARTH METALS LEACHING CHEMICALS MARKET SIZE, BY METAL TYPE, 2018-2030 (USD MILLION)
- TABLE 62. PHILIPPINES RARE EARTH METALS LEACHING CHEMICALS MARKET SIZE, BY APPLICATION, 2018-2030 (USD MILLION)
- TABLE 63. SINGAPORE RARE EARTH METALS LEACHING CHEMICALS MARKET SIZE, BY CHEMICAL TYPE, 2018-2030 (USD MILLION)
- TABLE 64. SINGAPORE RARE EARTH METALS LEACHING CHEMICALS MARKET SIZE, BY METAL TYPE, 2018-2030 (USD MILLION)
- TABLE 65. SINGAPORE RARE EARTH METALS LEACHING CHEMICALS MARKET SIZE, BY APPLICATION, 2018-2030 (USD MILLION)
- TABLE 66. SOUTH KOREA RARE EARTH METALS LEACHING CHEMICALS MARKET SIZE, BY CHEMICAL TYPE, 2018-2030 (USD MILLION)
- TABLE 67. SOUTH KOREA RARE EARTH METALS LEACHING CHEMICALS MARKET SIZE, BY METAL TYPE, 2018-2030 (USD MILLION)
- TABLE 68. SOUTH KOREA RARE EARTH METALS LEACHING CHEMICALS MARKET SIZE, BY APPLICATION, 2018-2030 (USD MILLION)
- TABLE 69. TAIWAN RARE EARTH METALS LEACHING CHEMICALS MARKET SIZE, BY CHEMICAL TYPE, 2018-2030 (USD MILLION)
- TABLE 70. TAIWAN RARE EARTH METALS LEACHING CHEMICALS MARKET SIZE, BY METAL TYPE, 2018-2030 (USD MILLION)
- TABLE 71. TAIWAN RARE EARTH METALS LEACHING CHEMICALS MARKET SIZE, BY APPLICATION, 2018-2030 (USD MILLION)
- TABLE 72. THAILAND RARE EARTH METALS LEACHING CHEMICALS MARKET SIZE, BY CHEMICAL TYPE, 2018-2030 (USD MILLION)
- TABLE 73. THAILAND RARE EARTH METALS LEACHING CHEMICALS MARKET SIZE, BY METAL TYPE, 2018-2030 (USD MILLION)
- TABLE 74. THAILAND RARE EARTH METALS LEACHING CHEMICALS MARKET SIZE, BY APPLICATION, 2018-2030 (USD MILLION)
- TABLE 75. VIETNAM RARE EARTH METALS LEACHING CHEMICALS MARKET SIZE, BY CHEMICAL TYPE, 2018-2030 (USD MILLION)
- TABLE 76. VIETNAM RARE EARTH METALS LEACHING CHEMICALS MARKET SIZE, BY METAL TYPE, 2018-2030 (USD MILLION)
- TABLE 77. VIETNAM RARE EARTH METALS LEACHING CHEMICALS MARKET SIZE, BY APPLICATION, 2018-2030 (USD MILLION)
- TABLE 78. EUROPE, MIDDLE EAST & AFRICA RARE EARTH METALS LEACHING CHEMICALS MARKET SIZE, BY CHEMICAL TYPE, 2018-2030 (USD MILLION)
- TABLE 79. EUROPE, MIDDLE EAST & AFRICA RARE EARTH METALS LEACHING CHEMICALS MARKET SIZE, BY METAL TYPE, 2018-2030 (USD MILLION)
- TABLE 80. EUROPE, MIDDLE EAST & AFRICA RARE EARTH METALS LEACHING CHEMICALS MARKET SIZE, BY APPLICATION, 2018-2030 (USD MILLION)
- TABLE 81. EUROPE, MIDDLE EAST & AFRICA RARE EARTH METALS LEACHING CHEMICALS MARKET SIZE, BY COUNTRY, 2018-2030 (USD MILLION)
- TABLE 82. DENMARK RARE EARTH METALS LEACHING CHEMICALS MARKET SIZE, BY CHEMICAL TYPE, 2018-2030 (USD MILLION)
- TABLE 83. DENMARK RARE EARTH METALS LEACHING CHEMICALS MARKET SIZE, BY METAL TYPE, 2018-2030 (USD MILLION)
- TABLE 84. DENMARK RARE EARTH METALS LEACHING CHEMICALS MARKET SIZE, BY APPLICATION, 2018-2030 (USD MILLION)
- TABLE 85. EGYPT RARE EARTH METALS LEACHING CHEMICALS MARKET SIZE, BY CHEMICAL TYPE, 2018-2030 (USD MILLION)
- TABLE 86. EGYPT RARE EARTH METALS LEACHING CHEMICALS MARKET SIZE, BY METAL TYPE, 2018-2030 (USD MILLION)
- TABLE 87. EGYPT RARE EARTH METALS LEACHING CHEMICALS MARKET SIZE, BY APPLICATION, 2018-2030 (USD MILLION)
- TABLE 88. FINLAND RARE EARTH METALS LEACHING CHEMICALS MARKET SIZE, BY CHEMICAL TYPE, 2018-2030 (USD MILLION)
- TABLE 89. FINLAND RARE EARTH METALS LEACHING CHEMICALS MARKET SIZE, BY METAL TYPE, 2018-2030 (USD MILLION)
- TABLE 90. FINLAND RARE EARTH METALS LEACHING CHEMICALS MARKET SIZE, BY APPLICATION, 2018-2030 (USD MILLION)
- TABLE 91. FRANCE RARE EARTH METALS LEACHING CHEMICALS MARKET SIZE, BY CHEMICAL TYPE, 2018-2030 (USD MILLION)
- TABLE 92. FRANCE RARE EARTH METALS LEACHING CHEMICALS MARKET SIZE, BY METAL TYPE, 2018-2030 (USD MILLION)
- TABLE 93. FRANCE RARE EARTH METALS LEACHING CHEMICALS MARKET SIZE, BY APPLICATION, 2018-2030 (USD MILLION)
- TABLE 94. GERMANY RARE EARTH METALS LEACHING CHEMICALS MARKET SIZE, BY CHEMICAL TYPE, 2018-2030 (USD MILLION)
- TABLE 95. GERMANY RARE EARTH METALS LEACHING CHEMICALS MARKET SIZE, BY METAL TYPE, 2018-2030 (USD MILLION)
- TABLE 96. GERMANY RARE EARTH METALS LEACHING CHEMICALS MARKET SIZE, BY APPLICATION, 2018-2030 (USD MILLION)
- TABLE 97. ISRAEL RARE EARTH METALS LEACHING CHEMICALS MARKET SIZE, BY CHEMICAL TYPE, 2018-2030 (USD MILLION)
- TABLE 98. ISRAEL RARE EARTH METALS LEACHING CHEMICALS MARKET SIZE, BY METAL TYPE, 2018-2030 (USD MILLION)
- TABLE 99. ISRAEL RARE EARTH METALS LEACHING CHEMICALS MARKET SIZE, BY APPLICATION, 2018-2030 (USD MILLION)
- TABLE 100. ITALY RARE EARTH METALS LEACHING CHEMICALS MARKET SIZE, BY CHEMICAL TYPE, 2018-2030 (USD MILLION)
- TABLE 101. ITALY RARE EARTH METALS LEACHING CHEMICALS MARKET SIZE, BY METAL TYPE, 2018-2030 (USD MILLION)
- TABLE 102. ITALY RARE EARTH METALS LEACHING CHEMICALS MARKET SIZE, BY APPLICATION, 2018-2030 (USD MILLION)
- TABLE 103. NETHERLANDS RARE EARTH METALS LEACHING CHEMICALS MARKET SIZE, BY CHEMICAL TYPE, 2018-2030 (USD MILLION)
- TABLE 104. NETHERLANDS RARE EARTH METALS LEACHING CHEMICALS MARKET SIZE, BY METAL TYPE, 2018-2030 (USD MILLION)
- TABLE 105. NETHERLANDS RARE EARTH METALS LEACHING CHEMICALS MARKET SIZE, BY APPLICATION, 2018-2030 (USD MILLION)
- TABLE 106. NIGERIA RARE EARTH METALS LEACHING CHEMICALS MARKET SIZE, BY CHEMICAL TYPE, 2018-2030 (USD MILLION)
- TABLE 107. NIGERIA RARE EARTH METALS LEACHING CHEMICALS MARKET SIZE, BY METAL TYPE, 2018-2030 (USD MILLION)
- TABLE 108. NIGERIA RARE EARTH METALS LEACHING CHEMICALS MARKET SIZE, BY APPLICATION, 2018-2030 (USD MILLION)
- TABLE 109. NORWAY RARE EARTH METALS LEACHING CHEMICALS MARKET SIZE, BY CHEMICAL TYPE, 2018-2030 (USD MILLION)
- TABLE 110. NORWAY RARE EARTH METALS LEACHING CHEMICALS MARKET SIZE, BY METAL TYPE, 2018-2030 (USD MILLION)
- TABLE 111. NORWAY RARE EARTH METALS LEACHING CHEMICALS MARKET SIZE, BY APPLICATION, 2018-2030 (USD MILLION)
- TABLE 112. POLAND RARE EARTH METALS LEACHING CHEMICALS MARKET SIZE, BY CHEMICAL TYPE, 2018-2030 (USD MILLION)
- TABLE 113. POLAND RARE EARTH METALS LEACHING CHEMICALS MARKET SIZE, BY METAL TYPE, 2018-2030 (USD MILLION)
- TABLE 114. POLAND RARE EARTH METALS LEACHING CHEMICALS MARKET SIZE, BY APPLICATION, 2018-2030 (USD MILLION)
- TABLE 115. QATAR RARE EARTH METALS LEACHING CHEMICALS MARKET SIZE, BY CHEMICAL TYPE, 2018-2030 (USD MILLION)
- TABLE 116. QATAR RARE EARTH METALS LEACHING CHEMICALS MARKET SIZE, BY METAL TYPE, 2018-2030 (USD MILLION)
- TABLE 117. QATAR RARE EARTH METALS LEACHING CHEMICALS MARKET SIZE, BY APPLICATION, 2018-2030 (USD MILLION)
- TABLE 118. RUSSIA RARE EARTH METALS LEACHING CHEMICALS MARKET SIZE, BY CHEMICAL TYPE, 2018-2030 (USD MILLION)
- TABLE 119. RUSSIA RARE EARTH METALS LEACHING CHEMICALS MARKET SIZE, BY METAL TYPE, 2018-2030 (USD MILLION)
- TABLE 120. RUSSIA RARE EARTH METALS LEACHING CHEMICALS MARKET SIZE, BY APPLICATION, 2018-2030 (USD MILLION)
- TABLE 121. SAUDI ARABIA RARE EARTH METALS LEACHING CHEMICALS MARKET SIZE, BY CHEMICAL TYPE, 2018-2030 (USD MILLION)
- TABLE 122. SAUDI ARABIA RARE EARTH METALS LEACHING CHEMICALS MARKET SIZE, BY METAL TYPE, 2018-2030 (USD MILLION)
- TABLE 123. SAUDI ARABIA RARE EARTH METALS LEACHING CHEMICALS MARKET SIZE, BY APPLICATION, 2018-2030 (USD MILLION)
- TABLE 124. SOUTH AFRICA RARE EARTH METALS LEACHING CHEMICALS MARKET SIZE, BY CHEMICAL TYPE, 2018-2030 (USD MILLION)
- TABLE 125. SOUTH AFRICA RARE EARTH METALS LEACHING CHEMICALS MARKET SIZE, BY METAL TYPE, 2018-2030 (USD MILLION)
- TABLE 126. SOUTH AFRICA RARE EARTH METALS LEACHING CHEMICALS MARKET SIZE, BY APPLICATION, 2018-2030 (USD MILLION)
- TABLE 127. SPAIN RARE EARTH METALS LEACHING CHEMICALS MARKET SIZE, BY CHEMICAL TYPE, 2018-2030 (USD MILLION)
- TABLE 128. SPAIN RARE EARTH METALS LEACHING CHEMICALS MARKET SIZE, BY METAL TYPE, 2018-2030 (USD MILLION)
- TABLE 129. SPAIN RARE EARTH METALS LEACHING CHEMICALS MARKET SIZE, BY APPLICATION, 2018-2030 (USD MILLION)
- TABLE 130. SWEDEN RARE EARTH METALS LEACHING CHEMICALS MARKET SIZE, BY CHEMICAL TYPE, 2018-2030 (USD MILLION)
- TABLE 131. SWEDEN RARE EARTH METALS LEACHING CHEMICALS MARKET SIZE, BY METAL TYPE, 2018-2030 (USD MILLION)
- TABLE 132. SWEDEN RARE EARTH METALS LEACHING CHEMICALS MARKET SIZE, BY APPLICATION, 2018-2030 (USD MILLION)
- TABLE 133. SWITZERLAND RARE EARTH METALS LEACHING CHEMICALS MARKET SIZE, BY CHEMICAL TYPE, 2018-2030 (USD MILLION)
- TABLE 134. SWITZERLAND RARE EARTH METALS LEACHING CHEMICALS MARKET SIZE, BY METAL TYPE, 2018-2030 (USD MILLION)
- TABLE 135. SWITZERLAND RARE EARTH METALS LEACHING CHEMICALS MARKET SIZE, BY APPLICATION, 2018-2030 (USD MILLION)
- TABLE 136. TURKEY RARE EARTH METALS LEACHING CHEMICALS MARKET SIZE, BY CHEMICAL TYPE, 2018-2030 (USD MILLION)
- TABLE 137. TURKEY RARE EARTH METALS LEACHING CHEMICALS MARKET SIZE, BY METAL TYPE, 2018-2030 (USD MILLION)
- TABLE 138. TURKEY RARE EARTH METALS LEACHING CHEMICALS MARKET SIZE, BY APPLICATION, 2018-2030 (USD MILLION)
- TABLE 139. UNITED ARAB EMIRATES RARE EARTH METALS LEACHING CHEMICALS MARKET SIZE, BY CHEMICAL TYPE, 2018-2030 (USD MILLION)
- TABLE 140. UNITED ARAB EMIRATES RARE EARTH METALS LEACHING CHEMICALS MARKET SIZE, BY METAL TYPE, 2018-2030 (USD MILLION)
- TABLE 141. UNITED ARAB EMIRATES RARE EARTH METALS LEACHING CHEMICALS MARKET SIZE, BY APPLICATION, 2018-2030 (USD MILLION)
- TABLE 142. UNITED KINGDOM RARE EARTH METALS LEACHING CHEMICALS MARKET SIZE, BY CHEMICAL TYPE, 2018-2030 (USD MILLION)
- TABLE 143. UNITED KINGDOM RARE EARTH METALS LEACHING CHEMICALS MARKET SIZE, BY METAL TYPE, 2018-2030 (USD MILLION)
- TABLE 144. UNITED KINGDOM RARE EARTH METALS LEACHING CHEMICALS MARKET SIZE, BY APPLICATION, 2018-2030 (USD MILLION)
- TABLE 145. RARE EARTH METALS LEACHING CHEMICALS MARKET, FPNV POSITIONING MATRIX, 2023
- TABLE 146. RARE EARTH METALS LEACHING CHEMICALS MARKET SHARE, BY KEY PLAYER, 2023
- TABLE 147. RARE EARTH METALS LEACHING CHEMICALS MARKET LICENSE & PRICING
 全球稀土金属市场:按类型、应用、地区划分 - 2029 年预测
 稀土金属市场:按类型、应用分类 - 2024-2030 年全球预测
 全球稀土金属市场:市场规模和份额分析 - 趋势、驱动因素、竞争格局、未来预测(2024-2030)
 全球稀土金属市场规模、份额、成长分析、按产品(铈、镝)、按应用(磁铁、催化剂)- 2024-2031 年产业预测
 2024 年稀土金属全球市场报告
 稀土金属回收市场:依技术、来源、应用分类 - 2024-2030 年全球预测
 全球稀土市场预测(至2030年)
 稀土金属浸出化学品的全球市场:按类型(氯化氢、硫酸、硝酸、硫酸铵、柠檬酸)、按地区(北美、欧洲、亚太地区、中东和非洲、南美洲)-预测2027年
 稀土金属的全球市场 - 市场规模,占有率,趋势,分析:各产品,各用途,各地区,市场区隔预测(2023年~2030年)
 稀土金属市场规模、市场份额、应用分析、区域展望、增长趋势、主要参与者、竞争战略、预测,2023-2031 年