


 |
市场调查报告书
商品编码
1415360
专属式门户市场:按产品、最终用户划分 - 2024-2030 年全球预测Captive Portal Market by Offering (Platform, Services), End-Use (Coworking Spaces, Entertainment, Hospitality & Leisure) - Global Forecast 2024-2030 |
||||||
※ 本网页内容可能与最新版本有所差异。详细情况请与我们联繫。
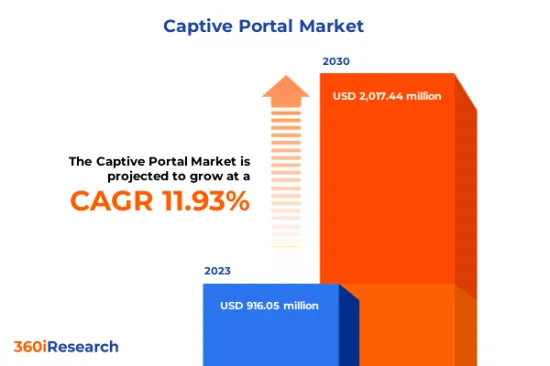
预计2023年专属式 Portal市场规模为9.1605亿美元,预计2024年将达到10.1545亿美元,2030年将达到20.1744亿美元,复合年增长率为11.93%。
全球专属式门户市场
| 主要市场统计 | |
|---|---|
| 基准年[2023] | 91605万美元 |
| 预测年份 [2024] | 1,015,450,000 美元 |
| 预测年份 [2030] | 201744万美元 |
| 复合年增长率(%) | 11.93% |
专属式门户是使用者的网页或网路网关,要求使用者在被授予存取网际网路或其他网路资源的权限之前完成验证程序。该功能将在酒店、机场和咖啡馆等公共Wi-Fi 网路中实施,以规范使用并确保安全。智慧型手机使用量的快速增长以及支援 Wi-Fi 的装置的普及增加了对安全可靠的公共网路存取点的需求。然而,糟糕的网路连线或低频宽可能会对使用者体验产生负面影响,并限制企业中专属式网站的有效性。然而,云端运算技术的进步预计将为透过软体即服务 (SaaS) 模式寻求经济高效的专属式门户解决方案的企业创造新的前景。
区域洞察
由于专属式门户市场在酒店、零售、教育和公司办公室等各个领域的广泛采用,美洲的强制门户市场正在不断发展。美国公司依靠专属式门户进行资料分析和针对性的行销宣传活动。在欧盟国家,对遵守隐私法规的无缝连接的需求日益增长。中东地区的网路普及正在迅速提高,这增加了对高效 Wi-Fi 管理系统(包括专属式入口网站)的需求。在非洲,智慧型手机使用的增加和网路存取的便利性导致使用专属式门户的无线热点部署的增加。由于快速的数位创新和进一步开发 5G 基础设施的外国投资,推动了对专属式门户的需求,亚太地区的专属式门户市场正在成长。此外,世界各地对智慧城市倡议的投资增加创造了独特的机会,可以提供适合当地偏好的专属式网站解决方案,同时确保资料隐私和安全。
FPNV定位矩阵
FPNV 定位矩阵对于评估专属式门户市场至关重要。我们检视与业务策略和产品满意度相关的关键指标,以对供应商进行全面评估。这种深入的分析使用户能够根据自己的要求做出明智的决策。根据评估,供应商被分为四个成功程度不同的像限:前沿(F)、探路者(P)、利基(N)和重要(V)。
市场占有率分析
市场占有率分析是一种综合工具,可以对专属式门户市场中供应商的现状进行深入而深入的研究。透过仔细比较和分析供应商在整体收入、客户群和其他关键指标方面的贡献,让企业更深入地了解供应商收益以及他们在争夺市场占有率时面临的挑战。此外,该分析也为该产业的竞争特征提供了宝贵的见解,包括在研究基准年观察到的累积、分散优势和合併特征等因素。这种扩展的详细程度使供应商能够做出更明智的决策并制定有效的策略,以获得市场竞争优势。
该报告对以下几个方面提供了宝贵的见解:
1-市场渗透率:提供有关主要企业所服务的市场的全面资讯。
2- 市场开拓:我们深入研究利润丰厚的新兴市场,并分析它们在成熟细分市场中的渗透率。
3- 市场多元化:提供有关新产品发布、开拓地区、最新发展和投资的详细资讯。
4-竞争评估与资讯:对主要企业的市场占有率、策略、产品、认证、监管核准、专利状况和製造能力进行全面评估。
5- 产品开发与创新:提供对未来技术、研发活动和突破性产品开发的见解。
本报告解决了以下关键问题:
1-专属式门户市场的市场规模和预测是多少?
2-在专属式 Portal 市场的预测期间内,需要考虑投资哪些产品、细分市场、应用程式和领域?
3-专属式门户市场的技术趋势和法律规范是什么?
4- 专属式 Portal 市场主要供应商的市场占有率是多少?
5-进入专属式门户市场的适当型态或策略手段是什么?
目录
第一章 前言
第二章调查方法
第三章执行摘要
第四章市场概况
第五章市场洞察
- 市场动态
- 促进因素
- 随着智慧型手机在全球的普及不断提高,公共 WiFi 热点的数量也不断增加。
- 透过个人化内容传送增强客户参与
- 更多地使用社交媒体平台来实现轻鬆的登入流程和有针对性的行销工作
- 抑制因素
- 使用未经许可的频谱的监管限制影响了某些地区 WiFi 网路的可用性
- 机会
- 无线通讯技术的进步
- 与人工智慧分析等新兴技术集成
- 任务
- 由于诈欺的追踪或滥用个人资讯而导致用户的资料隐私问题
- 促进因素
- 市场区隔分析
- 我们提供什么:增加使用专属式门户服务来满足组织的特定需求
- 最终用途:专属式门户的采用率在购物中心和零售店中迅速增加
- 市场趋势分析
- 高通膨的累积效应
- 波特五力分析
- 价值炼和关键路径分析
- 法律规范
第六章专属式门户市场:透过提供
- 平台
- 服务
第七章专属式门户市场:依最终用途
- 共同工作空间
- 娱乐
- 款待和休閒
- 购物中心和零售店
- 旅行和交流
第 8 章美洲专属式门户市场
- 阿根廷
- 巴西
- 加拿大
- 墨西哥
- 美国
第九章亚太地区专属式门户市场
- 澳洲
- 中国
- 印度
- 印尼
- 日本
- 马来西亚
- 菲律宾
- 新加坡
- 韩国
- 台湾
- 泰国
- 越南
第10章欧洲、中东和非洲的专属式门户市场
- 丹麦
- 埃及
- 芬兰
- 法国
- 德国
- 以色列
- 义大利
- 荷兰
- 奈及利亚
- 挪威
- 波兰
- 卡达
- 俄罗斯
- 沙乌地阿拉伯
- 南非
- 西班牙
- 瑞典
- 瑞士
- 土耳其
- 阿拉伯聯合大公国
- 英国
第十一章竞争形势
- FPNV定位矩阵
- 市场占有率分析:主要企业
- 主要企业竞争情境分析
- 新产品发布和功能增强
第12章竞争产品组合
- 主要公司简介
- Arista Networks, Inc.
- Cisco Systems Inc.,
- Cloud4Wi
- GoZone WiFi LLC.
- Grandstream Networks, Inc.
- Juniper Networks, Inc.
- Juniper Systems Inc.
- Kalungi, Inc.
- Keenetic Limited
- NETGEAR, Inc.
- Network Solutions LLC
- Nibblecomm, Inc.
- ONE BCG
- Palo Alto Networks, Inc.
- Performance Network
- Purple Wifi Ltd.
- Robustel
- Satcom Direct, Inc.
- Skyfii Limited
- WatchGuard Technologies, Inc.
- 主要产品系列
第十三章附录
- 讨论指南
- 关于许可证和定价
[194 Pages Report] The Captive Portal Market size was estimated at USD 916.05 million in 2023 and expected to reach USD 1,015.45 million in 2024, at a CAGR 11.93% to reach USD 2,017.44 million by 2030.
Global Captive Portal Market
| KEY MARKET STATISTICS | |
|---|---|
| Base Year [2023] | USD 916.05 million |
| Estimated Year [2024] | USD 1,015.45 million |
| Forecast Year [2030] | USD 2,017.44 million |
| CAGR (%) | 11.93% |
A captive portal is a user-facing web page or network gateway that requires users to complete an authentication process before they are granted access to the internet or other network resources. This functionality is implemented in public Wi-Fi networks, such as hotels, airports, and cafes, to regulate usage and ensure security. The rapid increase in smartphone usage and pervasive adoption of Wi-Fi-enabled devices has created a demand for secure and reliable public internet access points. However, inadequate internet connectivity or low bandwidth can impact the user experience adversely, limiting the effectiveness of captive portals for businesses. Nevertheless, advancements in cloud computing technologies are expected to create new prospects for businesses seeking cost-effective captive portal solutions through software-as-a-service (SaaS) models.
Regional Insights
The captive portal market is evolving in the Americas due to its extensive adoption in various sectors, such as hospitality, retail, education, and corporate offices. American businesses are leveraging captive portals for data analytics and targeted marketing campaigns. EU countries have witnessed an increasing need for seamless connectivity with strict adherence to privacy regulations. The Middle East region represents rapid growth in internet penetration rates, pushing demand for efficient Wi-Fi management systems, including captive portals. In Africa, there has been a rise in smartphone usage and internet accessibility, which has led to increased adoption of wireless hotspots utilizing captive portals. The APAC region's captive portal market is growing with rapid digital innovation and foreign investments to further develop the 5G infrastructure, raising demand for captive portals. Besides, increasing investments in smart city initiatives worldwide creates the immense opportunity to provide tailored captive portal solutions that cater to regional preferences while ensuring data privacy and security.
FPNV Positioning Matrix
The FPNV Positioning Matrix is pivotal in evaluating the Captive Portal Market. It offers a comprehensive assessment of vendors, examining key metrics related to Business Strategy and Product Satisfaction. This in-depth analysis empowers users to make well-informed decisions aligned with their requirements. Based on the evaluation, the vendors are then categorized into four distinct quadrants representing varying levels of success: Forefront (F), Pathfinder (P), Niche (N), or Vital (V).
Market Share Analysis
The Market Share Analysis is a comprehensive tool that provides an insightful and in-depth examination of the current state of vendors in the Captive Portal Market. By meticulously comparing and analyzing vendor contributions in terms of overall revenue, customer base, and other key metrics, we can offer companies a greater understanding of their performance and the challenges they face when competing for market share. Additionally, this analysis provides valuable insights into the competitive nature of the sector, including factors such as accumulation, fragmentation dominance, and amalgamation traits observed over the base year period studied. With this expanded level of detail, vendors can make more informed decisions and devise effective strategies to gain a competitive edge in the market.
Key Company Profiles
The report delves into recent significant developments in the Captive Portal Market, highlighting leading vendors and their innovative profiles. These include Arista Networks, Inc., Cisco Systems Inc.,, Cloud4Wi, GoZone WiFi LLC., Grandstream Networks, Inc., Juniper Networks, Inc., Juniper Systems Inc., Kalungi, Inc., Keenetic Limited, NETGEAR, Inc., Network Solutions LLC, Nibblecomm, Inc., ONE BCG, Palo Alto Networks, Inc., Performance Network, Purple Wifi Ltd., Robustel, Satcom Direct, Inc., Skyfii Limited, and WatchGuard Technologies, Inc..
Market Segmentation & Coverage
This research report categorizes the Captive Portal Market to forecast the revenues and analyze trends in each of the following sub-markets:
- Offering
- Platform
- Services
- End-Use
- Coworking Spaces
- Entertainment
- Hospitality & Leisure
- Shopping Malls & Retail Outlets
- Travel & Transportation
- Region
- Americas
- Argentina
- Brazil
- Canada
- Mexico
- United States
- California
- Florida
- Illinois
- New York
- Ohio
- Pennsylvania
- Texas
- Asia-Pacific
- Australia
- China
- India
- Indonesia
- Japan
- Malaysia
- Philippines
- Singapore
- South Korea
- Taiwan
- Thailand
- Vietnam
- Europe, Middle East & Africa
- Denmark
- Egypt
- Finland
- France
- Germany
- Israel
- Italy
- Netherlands
- Nigeria
- Norway
- Poland
- Qatar
- Russia
- Saudi Arabia
- South Africa
- Spain
- Sweden
- Switzerland
- Turkey
- United Arab Emirates
- United Kingdom
- Americas
The report offers valuable insights on the following aspects:
1. Market Penetration: It presents comprehensive information on the market provided by key players.
2. Market Development: It delves deep into lucrative emerging markets and analyzes the penetration across mature market segments.
3. Market Diversification: It provides detailed information on new product launches, untapped geographic regions, recent developments, and investments.
4. Competitive Assessment & Intelligence: It conducts an exhaustive assessment of market shares, strategies, products, certifications, regulatory approvals, patent landscape, and manufacturing capabilities of the leading players.
5. Product Development & Innovation: It offers intelligent insights on future technologies, R&D activities, and breakthrough product developments.
The report addresses key questions such as:
1. What is the market size and forecast of the Captive Portal Market?
2. Which products, segments, applications, and areas should one consider investing in over the forecast period in the Captive Portal Market?
3. What are the technology trends and regulatory frameworks in the Captive Portal Market?
4. What is the market share of the leading vendors in the Captive Portal Market?
5. Which modes and strategic moves are suitable for entering the Captive Portal Market?
Table of Contents
1. Preface
- 1.1. Objectives of the Study
- 1.2. Market Segmentation & Coverage
- 1.3. Years Considered for the Study
- 1.4. Currency & Pricing
- 1.5. Language
- 1.6. Limitations
- 1.7. Assumptions
- 1.8. Stakeholders
2. Research Methodology
- 2.1. Define: Research Objective
- 2.2. Determine: Research Design
- 2.3. Prepare: Research Instrument
- 2.4. Collect: Data Source
- 2.5. Analyze: Data Interpretation
- 2.6. Formulate: Data Verification
- 2.7. Publish: Research Report
- 2.8. Repeat: Report Update
3. Executive Summary
4. Market Overview
- 4.1. Introduction
- 4.2. Captive Portal Market, by Region
5. Market Insights
- 5.1. Market Dynamics
- 5.1.1. Drivers
- 5.1.1.1. Growing number of public WiFi hotspots owing to increasing smartphone penetration worldwide
- 5.1.1.2. Enhanced customer engagement through personalized content delivery
- 5.1.1.3. Increasing use of social media platforms for easy sign-in process and targeted marketing efforts
- 5.1.2. Restraints
- 5.1.2.1. Regulatory restrictions on unlicensed spectrum usage impacting WiFi network availability in certain geographies
- 5.1.3. Opportunities
- 5.1.3.1. Advances in wireless communication technology
- 5.1.3.2. Integration with emerging technologies such as AI-powered analytics
- 5.1.4. Challenges
- 5.1.4.1. Data privacy concerns among users due to unauthorized tracking or misuse of personal information
- 5.1.1. Drivers
- 5.2. Market Segmentation Analysis
- 5.2.1. Offerings: Increasing use of captive portal services for addressing specific needs of organizations
- 5.2.2. End-Use: Burgeoning adoption of captive portals in shopping malls & retail outlets
- 5.3. Market Trend Analysis
- 5.4. Cumulative Impact of High Inflation
- 5.5. Porter's Five Forces Analysis
- 5.5.1. Threat of New Entrants
- 5.5.2. Threat of Substitutes
- 5.5.3. Bargaining Power of Customers
- 5.5.4. Bargaining Power of Suppliers
- 5.5.5. Industry Rivalry
- 5.6. Value Chain & Critical Path Analysis
- 5.7. Regulatory Framework
6. Captive Portal Market, by Offering
- 6.1. Introduction
- 6.2. Platform
- 6.3. Services
7. Captive Portal Market, by End-Use
- 7.1. Introduction
- 7.2. Coworking Spaces
- 7.3. Entertainment
- 7.4. Hospitality & Leisure
- 7.5. Shopping Malls & Retail Outlets
- 7.6. Travel & Transportation
8. Americas Captive Portal Market
- 8.1. Introduction
- 8.2. Argentina
- 8.3. Brazil
- 8.4. Canada
- 8.5. Mexico
- 8.6. United States
9. Asia-Pacific Captive Portal Market
- 9.1. Introduction
- 9.2. Australia
- 9.3. China
- 9.4. India
- 9.5. Indonesia
- 9.6. Japan
- 9.7. Malaysia
- 9.8. Philippines
- 9.9. Singapore
- 9.10. South Korea
- 9.11. Taiwan
- 9.12. Thailand
- 9.13. Vietnam
10. Europe, Middle East & Africa Captive Portal Market
- 10.1. Introduction
- 10.2. Denmark
- 10.3. Egypt
- 10.4. Finland
- 10.5. France
- 10.6. Germany
- 10.7. Israel
- 10.8. Italy
- 10.9. Netherlands
- 10.10. Nigeria
- 10.11. Norway
- 10.12. Poland
- 10.13. Qatar
- 10.14. Russia
- 10.15. Saudi Arabia
- 10.16. South Africa
- 10.17. Spain
- 10.18. Sweden
- 10.19. Switzerland
- 10.20. Turkey
- 10.21. United Arab Emirates
- 10.22. United Kingdom
11. Competitive Landscape
- 11.1. FPNV Positioning Matrix
- 11.2. Market Share Analysis, By Key Player
- 11.3. Competitive Scenario Analysis, By Key Player
- 11.3.1. New Product Launch & Enhancement
- 11.3.1.1. Carrier-Grade Wi-Fi Service Delivery In Minutes Now Possible With Launch Of New Cloud Wi-Fi Platform By Globalreach Technology
- 11.3.1.2. 3i Infotech in partnership with RailTel bring NuRe Bharat Network for WiFi Monetizing Project
- 11.3.1.3. GoZone WiFi Launches First Enterprise-Grade Application Suite for Telecom Infra Project (TIP) OpenWiFi; First Advanced Captive Portal/Analytics Company to Work with TIP
- 11.3.1. New Product Launch & Enhancement
12. Competitive Portfolio
- 12.1. Key Company Profiles
- 12.1.1. Arista Networks, Inc.
- 12.1.2. Cisco Systems Inc.,
- 12.1.3. Cloud4Wi
- 12.1.4. GoZone WiFi LLC.
- 12.1.5. Grandstream Networks, Inc.
- 12.1.6. Juniper Networks, Inc.
- 12.1.7. Juniper Systems Inc.
- 12.1.8. Kalungi, Inc.
- 12.1.9. Keenetic Limited
- 12.1.10. NETGEAR, Inc.
- 12.1.11. Network Solutions LLC
- 12.1.12. Nibblecomm, Inc.
- 12.1.13. ONE BCG
- 12.1.14. Palo Alto Networks, Inc.
- 12.1.15. Performance Network
- 12.1.16. Purple Wifi Ltd.
- 12.1.17. Robustel
- 12.1.18. Satcom Direct, Inc.
- 12.1.19. Skyfii Limited
- 12.1.20. WatchGuard Technologies, Inc.
- 12.2. Key Product Portfolio
13. Appendix
- 13.1. Discussion Guide
- 13.2. License & Pricing
LIST OF FIGURES
- FIGURE 1. CAPTIVE PORTAL MARKET RESEARCH PROCESS
- FIGURE 2. CAPTIVE PORTAL MARKET SIZE, 2023 VS 2030
- FIGURE 3. CAPTIVE PORTAL MARKET SIZE, 2018-2030 (USD MILLION)
- FIGURE 4. CAPTIVE PORTAL MARKET SIZE, BY REGION, 2023 VS 2030 (%)
- FIGURE 5. CAPTIVE PORTAL MARKET SIZE, BY REGION, 2023 VS 2024 VS 2030 (USD MILLION)
- FIGURE 6. CAPTIVE PORTAL MARKET DYNAMICS
- FIGURE 7. CAPTIVE PORTAL MARKET SIZE, BY OFFERING, 2023 VS 2030 (%)
- FIGURE 8. CAPTIVE PORTAL MARKET SIZE, BY OFFERING, 2023 VS 2024 VS 2030 (USD MILLION)
- FIGURE 9. CAPTIVE PORTAL MARKET SIZE, BY END-USE, 2023 VS 2030 (%)
- FIGURE 10. CAPTIVE PORTAL MARKET SIZE, BY END-USE, 2023 VS 2024 VS 2030 (USD MILLION)
- FIGURE 11. AMERICAS CAPTIVE PORTAL MARKET SIZE, BY COUNTRY, 2023 VS 2030 (%)
- FIGURE 12. AMERICAS CAPTIVE PORTAL MARKET SIZE, BY COUNTRY, 2023 VS 2024 VS 2030 (USD MILLION)
- FIGURE 13. UNITED STATES CAPTIVE PORTAL MARKET SIZE, BY STATE, 2023 VS 2030 (%)
- FIGURE 14. UNITED STATES CAPTIVE PORTAL MARKET SIZE, BY STATE, 2023 VS 2024 VS 2030 (USD MILLION)
- FIGURE 15. ASIA-PACIFIC CAPTIVE PORTAL MARKET SIZE, BY COUNTRY, 2023 VS 2030 (%)
- FIGURE 16. ASIA-PACIFIC CAPTIVE PORTAL MARKET SIZE, BY COUNTRY, 2023 VS 2024 VS 2030 (USD MILLION)
- FIGURE 17. EUROPE, MIDDLE EAST & AFRICA CAPTIVE PORTAL MARKET SIZE, BY COUNTRY, 2023 VS 2030 (%)
- FIGURE 18. EUROPE, MIDDLE EAST & AFRICA CAPTIVE PORTAL MARKET SIZE, BY COUNTRY, 2023 VS 2024 VS 2030 (USD MILLION)
- FIGURE 19. CAPTIVE PORTAL MARKET, FPNV POSITIONING MATRIX, 2023
- FIGURE 20. CAPTIVE PORTAL MARKET SHARE, BY KEY PLAYER, 2023
LIST OF TABLES
- TABLE 1. CAPTIVE PORTAL MARKET SEGMENTATION & COVERAGE
- TABLE 2. UNITED STATES DOLLAR EXCHANGE RATE, 2018-2023
- TABLE 3. CAPTIVE PORTAL MARKET SIZE, 2018-2030 (USD MILLION)
- TABLE 4. GLOBAL CAPTIVE PORTAL MARKET SIZE, BY REGION, 2018-2030 (USD MILLION)
- TABLE 5. CAPTIVE PORTAL MARKET SIZE, BY OFFERING, 2018-2030 (USD MILLION)
- TABLE 6. CAPTIVE PORTAL MARKET SIZE, BY PLATFORM, BY REGION, 2018-2030 (USD MILLION)
- TABLE 7. CAPTIVE PORTAL MARKET SIZE, BY SERVICES, BY REGION, 2018-2030 (USD MILLION)
- TABLE 8. CAPTIVE PORTAL MARKET SIZE, BY END-USE, 2018-2030 (USD MILLION)
- TABLE 9. CAPTIVE PORTAL MARKET SIZE, BY COWORKING SPACES, BY REGION, 2018-2030 (USD MILLION)
- TABLE 10. CAPTIVE PORTAL MARKET SIZE, BY ENTERTAINMENT, BY REGION, 2018-2030 (USD MILLION)
- TABLE 11. CAPTIVE PORTAL MARKET SIZE, BY HOSPITALITY & LEISURE, BY REGION, 2018-2030 (USD MILLION)
- TABLE 12. CAPTIVE PORTAL MARKET SIZE, BY SHOPPING MALLS & RETAIL OUTLETS, BY REGION, 2018-2030 (USD MILLION)
- TABLE 13. CAPTIVE PORTAL MARKET SIZE, BY TRAVEL & TRANSPORTATION, BY REGION, 2018-2030 (USD MILLION)
- TABLE 14. AMERICAS CAPTIVE PORTAL MARKET SIZE, BY OFFERING, 2018-2030 (USD MILLION)
- TABLE 15. AMERICAS CAPTIVE PORTAL MARKET SIZE, BY END-USE, 2018-2030 (USD MILLION)
- TABLE 16. AMERICAS CAPTIVE PORTAL MARKET SIZE, BY COUNTRY, 2018-2030 (USD MILLION)
- TABLE 17. ARGENTINA CAPTIVE PORTAL MARKET SIZE, BY OFFERING, 2018-2030 (USD MILLION)
- TABLE 18. ARGENTINA CAPTIVE PORTAL MARKET SIZE, BY END-USE, 2018-2030 (USD MILLION)
- TABLE 19. BRAZIL CAPTIVE PORTAL MARKET SIZE, BY OFFERING, 2018-2030 (USD MILLION)
- TABLE 20. BRAZIL CAPTIVE PORTAL MARKET SIZE, BY END-USE, 2018-2030 (USD MILLION)
- TABLE 21. CANADA CAPTIVE PORTAL MARKET SIZE, BY OFFERING, 2018-2030 (USD MILLION)
- TABLE 22. CANADA CAPTIVE PORTAL MARKET SIZE, BY END-USE, 2018-2030 (USD MILLION)
- TABLE 23. MEXICO CAPTIVE PORTAL MARKET SIZE, BY OFFERING, 2018-2030 (USD MILLION)
- TABLE 24. MEXICO CAPTIVE PORTAL MARKET SIZE, BY END-USE, 2018-2030 (USD MILLION)
- TABLE 25. UNITED STATES CAPTIVE PORTAL MARKET SIZE, BY OFFERING, 2018-2030 (USD MILLION)
- TABLE 26. UNITED STATES CAPTIVE PORTAL MARKET SIZE, BY END-USE, 2018-2030 (USD MILLION)
- TABLE 27. UNITED STATES CAPTIVE PORTAL MARKET SIZE, BY STATE, 2018-2030 (USD MILLION)
- TABLE 28. ASIA-PACIFIC CAPTIVE PORTAL MARKET SIZE, BY OFFERING, 2018-2030 (USD MILLION)
- TABLE 29. ASIA-PACIFIC CAPTIVE PORTAL MARKET SIZE, BY END-USE, 2018-2030 (USD MILLION)
- TABLE 30. ASIA-PACIFIC CAPTIVE PORTAL MARKET SIZE, BY COUNTRY, 2018-2030 (USD MILLION)
- TABLE 31. AUSTRALIA CAPTIVE PORTAL MARKET SIZE, BY OFFERING, 2018-2030 (USD MILLION)
- TABLE 32. AUSTRALIA CAPTIVE PORTAL MARKET SIZE, BY END-USE, 2018-2030 (USD MILLION)
- TABLE 33. CHINA CAPTIVE PORTAL MARKET SIZE, BY OFFERING, 2018-2030 (USD MILLION)
- TABLE 34. CHINA CAPTIVE PORTAL MARKET SIZE, BY END-USE, 2018-2030 (USD MILLION)
- TABLE 35. INDIA CAPTIVE PORTAL MARKET SIZE, BY OFFERING, 2018-2030 (USD MILLION)
- TABLE 36. INDIA CAPTIVE PORTAL MARKET SIZE, BY END-USE, 2018-2030 (USD MILLION)
- TABLE 37. INDONESIA CAPTIVE PORTAL MARKET SIZE, BY OFFERING, 2018-2030 (USD MILLION)
- TABLE 38. INDONESIA CAPTIVE PORTAL MARKET SIZE, BY END-USE, 2018-2030 (USD MILLION)
- TABLE 39. JAPAN CAPTIVE PORTAL MARKET SIZE, BY OFFERING, 2018-2030 (USD MILLION)
- TABLE 40. JAPAN CAPTIVE PORTAL MARKET SIZE, BY END-USE, 2018-2030 (USD MILLION)
- TABLE 41. MALAYSIA CAPTIVE PORTAL MARKET SIZE, BY OFFERING, 2018-2030 (USD MILLION)
- TABLE 42. MALAYSIA CAPTIVE PORTAL MARKET SIZE, BY END-USE, 2018-2030 (USD MILLION)
- TABLE 43. PHILIPPINES CAPTIVE PORTAL MARKET SIZE, BY OFFERING, 2018-2030 (USD MILLION)
- TABLE 44. PHILIPPINES CAPTIVE PORTAL MARKET SIZE, BY END-USE, 2018-2030 (USD MILLION)
- TABLE 45. SINGAPORE CAPTIVE PORTAL MARKET SIZE, BY OFFERING, 2018-2030 (USD MILLION)
- TABLE 46. SINGAPORE CAPTIVE PORTAL MARKET SIZE, BY END-USE, 2018-2030 (USD MILLION)
- TABLE 47. SOUTH KOREA CAPTIVE PORTAL MARKET SIZE, BY OFFERING, 2018-2030 (USD MILLION)
- TABLE 48. SOUTH KOREA CAPTIVE PORTAL MARKET SIZE, BY END-USE, 2018-2030 (USD MILLION)
- TABLE 49. TAIWAN CAPTIVE PORTAL MARKET SIZE, BY OFFERING, 2018-2030 (USD MILLION)
- TABLE 50. TAIWAN CAPTIVE PORTAL MARKET SIZE, BY END-USE, 2018-2030 (USD MILLION)
- TABLE 51. THAILAND CAPTIVE PORTAL MARKET SIZE, BY OFFERING, 2018-2030 (USD MILLION)
- TABLE 52. THAILAND CAPTIVE PORTAL MARKET SIZE, BY END-USE, 2018-2030 (USD MILLION)
- TABLE 53. VIETNAM CAPTIVE PORTAL MARKET SIZE, BY OFFERING, 2018-2030 (USD MILLION)
- TABLE 54. VIETNAM CAPTIVE PORTAL MARKET SIZE, BY END-USE, 2018-2030 (USD MILLION)
- TABLE 55. EUROPE, MIDDLE EAST & AFRICA CAPTIVE PORTAL MARKET SIZE, BY OFFERING, 2018-2030 (USD MILLION)
- TABLE 56. EUROPE, MIDDLE EAST & AFRICA CAPTIVE PORTAL MARKET SIZE, BY END-USE, 2018-2030 (USD MILLION)
- TABLE 57. EUROPE, MIDDLE EAST & AFRICA CAPTIVE PORTAL MARKET SIZE, BY COUNTRY, 2018-2030 (USD MILLION)
- TABLE 58. DENMARK CAPTIVE PORTAL MARKET SIZE, BY OFFERING, 2018-2030 (USD MILLION)
- TABLE 59. DENMARK CAPTIVE PORTAL MARKET SIZE, BY END-USE, 2018-2030 (USD MILLION)
- TABLE 60. EGYPT CAPTIVE PORTAL MARKET SIZE, BY OFFERING, 2018-2030 (USD MILLION)
- TABLE 61. EGYPT CAPTIVE PORTAL MARKET SIZE, BY END-USE, 2018-2030 (USD MILLION)
- TABLE 62. FINLAND CAPTIVE PORTAL MARKET SIZE, BY OFFERING, 2018-2030 (USD MILLION)
- TABLE 63. FINLAND CAPTIVE PORTAL MARKET SIZE, BY END-USE, 2018-2030 (USD MILLION)
- TABLE 64. FRANCE CAPTIVE PORTAL MARKET SIZE, BY OFFERING, 2018-2030 (USD MILLION)
- TABLE 65. FRANCE CAPTIVE PORTAL MARKET SIZE, BY END-USE, 2018-2030 (USD MILLION)
- TABLE 66. GERMANY CAPTIVE PORTAL MARKET SIZE, BY OFFERING, 2018-2030 (USD MILLION)
- TABLE 67. GERMANY CAPTIVE PORTAL MARKET SIZE, BY END-USE, 2018-2030 (USD MILLION)
- TABLE 68. ISRAEL CAPTIVE PORTAL MARKET SIZE, BY OFFERING, 2018-2030 (USD MILLION)
- TABLE 69. ISRAEL CAPTIVE PORTAL MARKET SIZE, BY END-USE, 2018-2030 (USD MILLION)
- TABLE 70. ITALY CAPTIVE PORTAL MARKET SIZE, BY OFFERING, 2018-2030 (USD MILLION)
- TABLE 71. ITALY CAPTIVE PORTAL MARKET SIZE, BY END-USE, 2018-2030 (USD MILLION)
- TABLE 72. NETHERLANDS CAPTIVE PORTAL MARKET SIZE, BY OFFERING, 2018-2030 (USD MILLION)
- TABLE 73. NETHERLANDS CAPTIVE PORTAL MARKET SIZE, BY END-USE, 2018-2030 (USD MILLION)
- TABLE 74. NIGERIA CAPTIVE PORTAL MARKET SIZE, BY OFFERING, 2018-2030 (USD MILLION)
- TABLE 75. NIGERIA CAPTIVE PORTAL MARKET SIZE, BY END-USE, 2018-2030 (USD MILLION)
- TABLE 76. NORWAY CAPTIVE PORTAL MARKET SIZE, BY OFFERING, 2018-2030 (USD MILLION)
- TABLE 77. NORWAY CAPTIVE PORTAL MARKET SIZE, BY END-USE, 2018-2030 (USD MILLION)
- TABLE 78. POLAND CAPTIVE PORTAL MARKET SIZE, BY OFFERING, 2018-2030 (USD MILLION)
- TABLE 79. POLAND CAPTIVE PORTAL MARKET SIZE, BY END-USE, 2018-2030 (USD MILLION)
- TABLE 80. QATAR CAPTIVE PORTAL MARKET SIZE, BY OFFERING, 2018-2030 (USD MILLION)
- TABLE 81. QATAR CAPTIVE PORTAL MARKET SIZE, BY END-USE, 2018-2030 (USD MILLION)
- TABLE 82. RUSSIA CAPTIVE PORTAL MARKET SIZE, BY OFFERING, 2018-2030 (USD MILLION)
- TABLE 83. RUSSIA CAPTIVE PORTAL MARKET SIZE, BY END-USE, 2018-2030 (USD MILLION)
- TABLE 84. SAUDI ARABIA CAPTIVE PORTAL MARKET SIZE, BY OFFERING, 2018-2030 (USD MILLION)
- TABLE 85. SAUDI ARABIA CAPTIVE PORTAL MARKET SIZE, BY END-USE, 2018-2030 (USD MILLION)
- TABLE 86. SOUTH AFRICA CAPTIVE PORTAL MARKET SIZE, BY OFFERING, 2018-2030 (USD MILLION)
- TABLE 87. SOUTH AFRICA CAPTIVE PORTAL MARKET SIZE, BY END-USE, 2018-2030 (USD MILLION)
- TABLE 88. SPAIN CAPTIVE PORTAL MARKET SIZE, BY OFFERING, 2018-2030 (USD MILLION)
- TABLE 89. SPAIN CAPTIVE PORTAL MARKET SIZE, BY END-USE, 2018-2030 (USD MILLION)
- TABLE 90. SWEDEN CAPTIVE PORTAL MARKET SIZE, BY OFFERING, 2018-2030 (USD MILLION)
- TABLE 91. SWEDEN CAPTIVE PORTAL MARKET SIZE, BY END-USE, 2018-2030 (USD MILLION)
- TABLE 92. SWITZERLAND CAPTIVE PORTAL MARKET SIZE, BY OFFERING, 2018-2030 (USD MILLION)
- TABLE 93. SWITZERLAND CAPTIVE PORTAL MARKET SIZE, BY END-USE, 2018-2030 (USD MILLION)
- TABLE 94. TURKEY CAPTIVE PORTAL MARKET SIZE, BY OFFERING, 2018-2030 (USD MILLION)
- TABLE 95. TURKEY CAPTIVE PORTAL MARKET SIZE, BY END-USE, 2018-2030 (USD MILLION)
- TABLE 96. UNITED ARAB EMIRATES CAPTIVE PORTAL MARKET SIZE, BY OFFERING, 2018-2030 (USD MILLION)
- TABLE 97. UNITED ARAB EMIRATES CAPTIVE PORTAL MARKET SIZE, BY END-USE, 2018-2030 (USD MILLION)
- TABLE 98. UNITED KINGDOM CAPTIVE PORTAL MARKET SIZE, BY OFFERING, 2018-2030 (USD MILLION)
- TABLE 99. UNITED KINGDOM CAPTIVE PORTAL MARKET SIZE, BY END-USE, 2018-2030 (USD MILLION)
- TABLE 100. CAPTIVE PORTAL MARKET, FPNV POSITIONING MATRIX, 2023
- TABLE 101. CAPTIVE PORTAL MARKET SHARE, BY KEY PLAYER, 2023
- TABLE 102. CAPTIVE PORTAL MARKET LICENSE & PRICING
 2024 年保全服务边缘全球市场报告
 2024 年专属式 Portal 全球市场报告
 2024 年网路安全软体全球市场报告
 2024 年网路安全策略管理 (NPSM) 软体全球市场报告
 到 2030 年保全服务边缘 (SSE) 市场预测:按组件、组织规模、最终用户和地区进行的全球分析
 2024-2032 年按组件、部署模式、组织规模、垂直产业和地区分類的网路安全市场报告
 2024 年防毒软体世界市场报告
 保全服务边缘市场:按提供的服务、公司规模和行业划分 - 2024 年至 2030 年全球预测
 全球网路安全市场 2023-2030
 安全服务边缘市场- 按组件(解决方案、服务)、按组织规模(大型组织、中小企业)、最终用户(BFSI、IT 和电信、零售和电子商务、医疗保健、政府、製造业),预测, 2024 年- 2032