


 |
市场调查报告书
商品编码
1415397
工程服务外包市场:依服务、地点、应用分类 - 2024-2030 年全球预测Engineering Services Outsourcing Market by Service (Designing, Prototyping, System Integration), Location (Off-Shore, On-Shore), Application - Global Forecast 2024-2030 |
||||||
※ 本网页内容可能与最新版本有所差异。详细情况请与我们联繫。
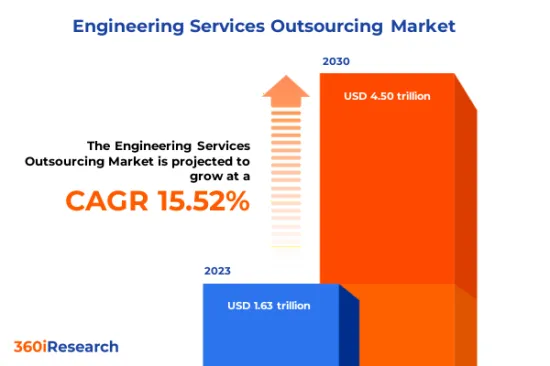
预计2023年工程服务外包市场规模为1.63兆美元,预计2024年将达1.88兆美元,2030年将达4.5兆美元,复合年增长率为15.52%。
全球工程服务外包市场
| 主要市场统计 | |
|---|---|
| 基准年[2023] | 1.63兆美元 |
| 预测年份 [2024] | 1.88兆美元 |
| 预测年份 [2030] | 4.5兆美元 |
| 复合年增长率(%) | 15.52% |
工程服务外包(ESO)是一种企业将各种工程功能和任务外包给外部服务供应商的业务实务。这些服务提供者通常位于不同的地区或国家,提供工程服务和专业知识来支援公司的设计、开发和工程流程。 ESO 在航太、汽车、电子和製造等工程关键产业特别普及。对成本效益和高效业务的需求不断增长、对产品创新和开发的需求不断增长、技术的快速进步以及不断变化的全球监管环境正在推动市场成长。然而,沟通差距和管理离岸合约的复杂性构成了影响市场成长的挑战。工业 4.0 的兴起强调自动化、机器学习和资料交换,为 ESO 供应商提供了建立利基专业化、加速数位转型和外包许多工程需求的潜力,从而扩大了 ESO 市场的范围。扩大。
区域洞察
由于航太和国防领域的进步对精密工程服务的需求不断增长,美洲在工程服务外包(ESO)中占据着重要地位。对自动化的日益关注、工业4.0趋势、绿色能源计划的激增、该领域对专业工程服务的需求、高研发费用和政府奖励正在显着推动市场需求。汽车产业在欧盟国家中发挥着至关重要的作用,电动车的需求正在推动主要需要专业工程技能的创新设计,进一步推动市场形势的发展,因此产业形势的需求不断增加。亚太国家正处于发展过程中,各行业尤其是製造业和电子业对高品质工程服务的持续需求。由于技术进步和对研究的大量投资,各国保持了对工程服务的持续需求。
FPNV定位矩阵
FPNV定位矩阵对于评估工程服务外包市场至关重要。我们检视与业务策略和产品满意度相关的关键指标,以对供应商进行全面评估。这种深入的分析使用户能够根据自己的要求做出明智的决策。根据评估,供应商被分为四个成功程度不同的像限:前沿(F)、探路者(P)、利基(N)和重要(V)。
市场占有率分析
市场占有率分析是一个综合工具,可以对工程服务外包市场中供应商的现状进行深入而深入的研究。全面比较和分析供应商在整体收益、基本客群和其他关键指标方面的贡献,以便更好地了解公司的绩效及其在争夺市场占有率时面临的挑战。此外,该分析还提供了对该行业竞争特征的宝贵考察,包括在研究基准年观察到的累积、分散主导地位和合併特征等因素。这种详细程度的提高使供应商能够做出更明智的决策并制定有效的策略,从而在市场上获得竞争优势。
该报告对以下几个方面提供了宝贵的见解:
1-市场渗透率:提供有关主要企业所服务的市场的全面资讯。
2-市场开拓:我们深入研究利润丰厚的新兴市场,并分析它们在成熟细分市场中的渗透率。
3- 市场多元化:提供有关新产品发布、开拓地区、最新发展和投资的详细资讯。
4-竞争力评估与资讯:对主要企业的市场占有率、策略、产品、认证、监管状况、专利状况、製造能力等进行全面评估。
5- 产品开发与创新:提供对未来技术、研发活动和突破性产品开发的见解。
本报告解决了以下关键问题:
1-工程服务外包市场的市场规模与预测是多少?
2-在工程服务外包市场的预测期间内,有哪些产品、细分市场、应用程式和领域需要考虑投资?
3-工程服务外包市场的技术趋势和法律规范是什么?
4-工程服务外包市场主要供应商的市场占有率是多少?
5-进入工程服务外包市场的适当型态和策略手段是什么?
目录
第一章 前言
第二章调查方法
第三章执行摘要
第四章市场概况
第五章市场洞察
- 市场动态
- 促进因素
- 先进的 IT 解决方案越来越普及
- 继续实施工业 4.0,并更多地采用自动化和整合解决方案
- 对具有成本效益和高效营运的需求日益增长
- 抑制因素
- 管理工程服务外包的熟练专业人员有限
- 机会
- 尖端外包产品的引进与开发
- 工程服务外包在医疗保健和工业领域的渗透
- 任务
- 工程服务外包的资料和网路安全问题
- 促进因素
- 市场区隔分析
- 服务:渗透系统整合服务,同步多个子系统
- 地点:离岸采用率较高的工程服务外包
- 应用:在通讯应用中使用桿套来提供网路设计和最佳化
- 市场趋势分析
- 高通膨的累积效应
- 波特五力分析
- 价值炼和关键路径分析
- 法律规范
第六章 工程服务外包市场:依服务分类
- 设计
- 原型製作
- 系统整合
- 测试
第七章工程服务外包市场:依地点
- 离岸
- 陆上
第八章工程服务外包市场:依应用分类
- 航太
- 车
- 家用电器
- 卫生保健
- 工业的
- 半导体
- 电讯
第九章美洲工程服务外包市场
- 阿根廷
- 巴西
- 加拿大
- 墨西哥
- 美国
第十章亚太工程服务外包市场
- 澳洲
- 中国
- 印度
- 印尼
- 日本
- 马来西亚
- 菲律宾
- 新加坡
- 韩国
- 台湾
- 泰国
- 越南
第十一章 欧洲、中东和非洲工程服务外包市场
- 丹麦
- 埃及
- 芬兰
- 法国
- 德国
- 以色列
- 义大利
- 荷兰
- 奈及利亚
- 挪威
- 波兰
- 卡达
- 俄罗斯
- 沙乌地阿拉伯
- 南非
- 西班牙
- 瑞典
- 瑞士
- 土耳其
- 阿拉伯聯合大公国
- 英国
第十二章竞争形势
- FPNV定位矩阵
- 市场占有率分析:主要企业
- 主要企业竞争情境分析
- 併购
- 新产品发布和功能增强
- 奖项/奖励/扩展
第13章竞争产品组合
- 主要公司简介
- Accenture plc
- AFRY AB
- Airbus SE
- Akkodis Group AG
- Alten Group
- Barton Malow Holdings LLC
- Bechtel Corporation
- Brasfield & Gorrie, LLC
- Capgemini Engineering
- Detroit Engineered Products
- Entelect Software(Pty)Ltd.
- EPAM Systems, Inc.
- Globallogic Inc.
- HCL Technologies Limited
- Infosys Limited
- International Business Machines Corporation
- Kiewit Corporation
- KPIT Technologies Limited
- New York Engineers
- Quest Global Services Pte. Ltd.
- RLE International Inc.
- Strabag SE
- Tata Consultancy Services Limited
- Tech Mahindra Limited
- Wipro Limited
- WPG Consulting LLC
- 主要产品系列
第十四章附录
- 讨论指南
- 关于许可证和定价
[183 Pages Report] The Engineering Services Outsourcing Market size was estimated at USD 1.63 trillion in 2023 and expected to reach USD 1.88 trillion in 2024, at a CAGR 15.52% to reach USD 4.50 trillion by 2030.
Global Engineering Services Outsourcing Market
| KEY MARKET STATISTICS | |
|---|---|
| Base Year [2023] | USD 1.63 trillion |
| Estimated Year [2024] | USD 1.88 trillion |
| Forecast Year [2030] | USD 4.50 trillion |
| CAGR (%) | 15.52% |
Engineering services outsourcing (ESO) is a business practice where companies subcontract various engineering functions and tasks to external service providers. These service providers, often in different geographic regions or countries, offer engineering services and expertise to support a company's design, development, and engineering processes. ESO is particularly prevalent in industries where engineering is crucial, such as aerospace, automotive, electronics, and manufacturing. The heightened need for cost-effective and efficient operations, increased demand for product innovation and development, rapid technological advancements, and the evolving global regulatory landscape drive market growth. However, communication gaps and the complexities of managing offshore engagements pose challenging factors impacting market growth. The rise of Industry 4.0, emphasizing automation, machine learning, and data exchange, offers possibilities for ESO providers to establish niche areas of expertise and accelerate digital transformation to outsource more of their engineering needs, thus broadening the market scope for ESO.
Regional Insights
The Americas has a significant landscape in engineering services outsourcing (ESO) owing to increased demand for precision engineering services underpinned by advancements in the aerospace and defense sectors. The increasing focus on automation, the advent of Industry 4.0 trends, the surge in green energy projects, propelling the need for specialized engineering services in this sector, and high R&D spending and government incentives significantly fueled the market demand. In the European Union (EU) countries, the automotive industry plays a pivotal role, driving the need for engineering services outsourcing as the demand for electric vehicles has mainly sparked innovative designs requiring specialized engineering skills, which further enhanced the market landscape in the region. Asia Pacific nations showcase developing landscapes due to the constant need for high-quality engineering services across various sectors, prominently manufacturing and electronics. Countries sustain a continuous demand for engineering services due to technological advancement and significant investments in research.
FPNV Positioning Matrix
The FPNV Positioning Matrix is pivotal in evaluating the Engineering Services Outsourcing Market. It offers a comprehensive assessment of vendors, examining key metrics related to Business Strategy and Product Satisfaction. This in-depth analysis empowers users to make well-informed decisions aligned with their requirements. Based on the evaluation, the vendors are then categorized into four distinct quadrants representing varying levels of success: Forefront (F), Pathfinder (P), Niche (N), or Vital (V).
Market Share Analysis
The Market Share Analysis is a comprehensive tool that provides an insightful and in-depth examination of the current state of vendors in the Engineering Services Outsourcing Market. By meticulously comparing and analyzing vendor contributions in terms of overall revenue, customer base, and other key metrics, we can offer companies a greater understanding of their performance and the challenges they face when competing for market share. Additionally, this analysis provides valuable insights into the competitive nature of the sector, including factors such as accumulation, fragmentation dominance, and amalgamation traits observed over the base year period studied. With this expanded level of detail, vendors can make more informed decisions and devise effective strategies to gain a competitive edge in the market.
Key Company Profiles
The report delves into recent significant developments in the Engineering Services Outsourcing Market, highlighting leading vendors and their innovative profiles. These include Accenture plc, AFRY AB, Airbus SE, Akkodis Group AG, Alten Group, Barton Malow Holdings LLC, Bechtel Corporation, Brasfield & Gorrie, LLC, Capgemini Engineering, Detroit Engineered Products, Entelect Software (Pty) Ltd., EPAM Systems, Inc., Globallogic Inc., HCL Technologies Limited, Infosys Limited, International Business Machines Corporation, Kiewit Corporation, KPIT Technologies Limited, New York Engineers, Quest Global Services Pte. Ltd., RLE International Inc., Strabag SE, Tata Consultancy Services Limited, Tech Mahindra Limited, Wipro Limited, and WPG Consulting LLC.
Market Segmentation & Coverage
This research report categorizes the Engineering Services Outsourcing Market to forecast the revenues and analyze trends in each of the following sub-markets:
- Service
- Designing
- Prototyping
- System Integration
- Testing
- Location
- Off-Shore
- On-Shore
- Application
- Aerospace
- Automotive
- Consumer Electronics
- Healthcare
- Industrial
- Semiconductors
- Telecom
- Region
- Americas
- Argentina
- Brazil
- Canada
- Mexico
- United States
- California
- Florida
- Illinois
- New York
- Ohio
- Pennsylvania
- Texas
- Asia-Pacific
- Australia
- China
- India
- Indonesia
- Japan
- Malaysia
- Philippines
- Singapore
- South Korea
- Taiwan
- Thailand
- Vietnam
- Europe, Middle East & Africa
- Denmark
- Egypt
- Finland
- France
- Germany
- Israel
- Italy
- Netherlands
- Nigeria
- Norway
- Poland
- Qatar
- Russia
- Saudi Arabia
- South Africa
- Spain
- Sweden
- Switzerland
- Turkey
- United Arab Emirates
- United Kingdom
- Americas
The report offers valuable insights on the following aspects:
1. Market Penetration: It presents comprehensive information on the market provided by key players.
2. Market Development: It delves deep into lucrative emerging markets and analyzes the penetration across mature market segments.
3. Market Diversification: It provides detailed information on new product launches, untapped geographic regions, recent developments, and investments.
4. Competitive Assessment & Intelligence: It conducts an exhaustive assessment of market shares, strategies, products, certifications, regulatory approvals, patent landscape, and manufacturing capabilities of the leading players.
5. Product Development & Innovation: It offers intelligent insights on future technologies, R&D activities, and breakthrough product developments.
The report addresses key questions such as:
1. What is the market size and forecast of the Engineering Services Outsourcing Market?
2. Which products, segments, applications, and areas should one consider investing in over the forecast period in the Engineering Services Outsourcing Market?
3. What are the technology trends and regulatory frameworks in the Engineering Services Outsourcing Market?
4. What is the market share of the leading vendors in the Engineering Services Outsourcing Market?
5. Which modes and strategic moves are suitable for entering the Engineering Services Outsourcing Market?
Table of Contents
1. Preface
- 1.1. Objectives of the Study
- 1.2. Market Segmentation & Coverage
- 1.3. Years Considered for the Study
- 1.4. Currency & Pricing
- 1.5. Language
- 1.6. Limitations
- 1.7. Assumptions
- 1.8. Stakeholders
2. Research Methodology
- 2.1. Define: Research Objective
- 2.2. Determine: Research Design
- 2.3. Prepare: Research Instrument
- 2.4. Collect: Data Source
- 2.5. Analyze: Data Interpretation
- 2.6. Formulate: Data Verification
- 2.7. Publish: Research Report
- 2.8. Repeat: Report Update
3. Executive Summary
4. Market Overview
- 4.1. Introduction
- 4.2. Engineering Services Outsourcing Market, by Region
5. Market Insights
- 5.1. Market Dynamics
- 5.1.1. Drivers
- 5.1.1.1. Increasing prevalence of advanced IT solutions
- 5.1.1.2. Ongoing execution of Industry 4.0 coupled with rising adoption of automated and integrated solutions
- 5.1.1.3. Heightened need for cost-effective and efficient operations
- 5.1.2. Restraints
- 5.1.2.1. Limited skilled professionals to manage engineering service outsourcing
- 5.1.3. Opportunities
- 5.1.3.1. Introduction and development of technologically advanced outsourcing products
- 5.1.3.2. Penetration of engineering services outsourcing in the healthcare and industrial sector
- 5.1.4. Challenges
- 5.1.4.1. Data and cybersecurity issues with engineering services outsourcing
- 5.1.1. Drivers
- 5.2. Market Segmentation Analysis
- 5.2.1. Service: Penetration of system integration services to synchronize multiple subsystems
- 5.2.2. Location: High adoption of offshore engineering services outsourcing
- 5.2.3. Application: Poleferating use in telecom applications providing net design and optimization
- 5.3. Market Trend Analysis
- 5.4. Cumulative Impact of High Inflation
- 5.5. Porter's Five Forces Analysis
- 5.5.1. Threat of New Entrants
- 5.5.2. Threat of Substitutes
- 5.5.3. Bargaining Power of Customers
- 5.5.4. Bargaining Power of Suppliers
- 5.5.5. Industry Rivalry
- 5.6. Value Chain & Critical Path Analysis
- 5.7. Regulatory Framework
6. Engineering Services Outsourcing Market, by Service
- 6.1. Introduction
- 6.2. Designing
- 6.3. Prototyping
- 6.4. System Integration
- 6.5. Testing
7. Engineering Services Outsourcing Market, by Location
- 7.1. Introduction
- 7.2. Off-Shore
- 7.3. On-Shore
8. Engineering Services Outsourcing Market, by Application
- 8.1. Introduction
- 8.2. Aerospace
- 8.3. Automotive
- 8.4. Consumer Electronics
- 8.5. Healthcare
- 8.6. Industrial
- 8.7. Semiconductors
- 8.8. Telecom
9. Americas Engineering Services Outsourcing Market
- 9.1. Introduction
- 9.2. Argentina
- 9.3. Brazil
- 9.4. Canada
- 9.5. Mexico
- 9.6. United States
10. Asia-Pacific Engineering Services Outsourcing Market
- 10.1. Introduction
- 10.2. Australia
- 10.3. China
- 10.4. India
- 10.5. Indonesia
- 10.6. Japan
- 10.7. Malaysia
- 10.8. Philippines
- 10.9. Singapore
- 10.10. South Korea
- 10.11. Taiwan
- 10.12. Thailand
- 10.13. Vietnam
11. Europe, Middle East & Africa Engineering Services Outsourcing Market
- 11.1. Introduction
- 11.2. Denmark
- 11.3. Egypt
- 11.4. Finland
- 11.5. France
- 11.6. Germany
- 11.7. Israel
- 11.8. Italy
- 11.9. Netherlands
- 11.10. Nigeria
- 11.11. Norway
- 11.12. Poland
- 11.13. Qatar
- 11.14. Russia
- 11.15. Saudi Arabia
- 11.16. South Africa
- 11.17. Spain
- 11.18. Sweden
- 11.19. Switzerland
- 11.20. Turkey
- 11.21. United Arab Emirates
- 11.22. United Kingdom
12. Competitive Landscape
- 12.1. FPNV Positioning Matrix
- 12.2. Market Share Analysis, By Key Player
- 12.3. Competitive Scenario Analysis, By Key Player
- 12.3.1. Merger & Acquisition
- 12.3.1.1. AFRY Acquires KSH - a Canadian Engineering Company Focused On The Process Industries Sector
- 12.3.2. New Product Launch & Enhancement
- 12.3.2.1. Introducing DEP MeshWorks 2023: Unleashing the Future of Engineering Simulation
- 12.3.3. Award, Recognition, & Expansion
- 12.3.3.1. Detroit Engineered Products to Expand R&D in Chennai, India
- 12.3.1. Merger & Acquisition
13. Competitive Portfolio
- 13.1. Key Company Profiles
- 13.1.1. Accenture plc
- 13.1.2. AFRY AB
- 13.1.3. Airbus SE
- 13.1.4. Akkodis Group AG
- 13.1.5. Alten Group
- 13.1.6. Barton Malow Holdings LLC
- 13.1.7. Bechtel Corporation
- 13.1.8. Brasfield & Gorrie, LLC
- 13.1.9. Capgemini Engineering
- 13.1.10. Detroit Engineered Products
- 13.1.11. Entelect Software (Pty) Ltd.
- 13.1.12. EPAM Systems, Inc.
- 13.1.13. Globallogic Inc.
- 13.1.14. HCL Technologies Limited
- 13.1.15. Infosys Limited
- 13.1.16. International Business Machines Corporation
- 13.1.17. Kiewit Corporation
- 13.1.18. KPIT Technologies Limited
- 13.1.19. New York Engineers
- 13.1.20. Quest Global Services Pte. Ltd.
- 13.1.21. RLE International Inc.
- 13.1.22. Strabag SE
- 13.1.23. Tata Consultancy Services Limited
- 13.1.24. Tech Mahindra Limited
- 13.1.25. Wipro Limited
- 13.1.26. WPG Consulting LLC
- 13.2. Key Product Portfolio
14. Appendix
- 14.1. Discussion Guide
- 14.2. License & Pricing
LIST OF FIGURES
- FIGURE 1. ENGINEERING SERVICES OUTSOURCING MARKET RESEARCH PROCESS
- FIGURE 2. ENGINEERING SERVICES OUTSOURCING MARKET SIZE, 2023 VS 2030
- FIGURE 3. ENGINEERING SERVICES OUTSOURCING MARKET SIZE, 2018-2030 (USD MILLION)
- FIGURE 4. ENGINEERING SERVICES OUTSOURCING MARKET SIZE, BY REGION, 2023 VS 2030 (%)
- FIGURE 5. ENGINEERING SERVICES OUTSOURCING MARKET SIZE, BY REGION, 2023 VS 2024 VS 2030 (USD MILLION)
- FIGURE 6. ENGINEERING SERVICES OUTSOURCING MARKET DYNAMICS
- FIGURE 7. ENGINEERING SERVICES OUTSOURCING MARKET SIZE, BY SERVICE, 2023 VS 2030 (%)
- FIGURE 8. ENGINEERING SERVICES OUTSOURCING MARKET SIZE, BY SERVICE, 2023 VS 2024 VS 2030 (USD MILLION)
- FIGURE 9. ENGINEERING SERVICES OUTSOURCING MARKET SIZE, BY LOCATION, 2023 VS 2030 (%)
- FIGURE 10. ENGINEERING SERVICES OUTSOURCING MARKET SIZE, BY LOCATION, 2023 VS 2024 VS 2030 (USD MILLION)
- FIGURE 11. ENGINEERING SERVICES OUTSOURCING MARKET SIZE, BY APPLICATION, 2023 VS 2030 (%)
- FIGURE 12. ENGINEERING SERVICES OUTSOURCING MARKET SIZE, BY APPLICATION, 2023 VS 2024 VS 2030 (USD MILLION)
- FIGURE 13. AMERICAS ENGINEERING SERVICES OUTSOURCING MARKET SIZE, BY COUNTRY, 2023 VS 2030 (%)
- FIGURE 14. AMERICAS ENGINEERING SERVICES OUTSOURCING MARKET SIZE, BY COUNTRY, 2023 VS 2024 VS 2030 (USD MILLION)
- FIGURE 15. UNITED STATES ENGINEERING SERVICES OUTSOURCING MARKET SIZE, BY STATE, 2023 VS 2030 (%)
- FIGURE 16. UNITED STATES ENGINEERING SERVICES OUTSOURCING MARKET SIZE, BY STATE, 2023 VS 2024 VS 2030 (USD MILLION)
- FIGURE 17. ASIA-PACIFIC ENGINEERING SERVICES OUTSOURCING MARKET SIZE, BY COUNTRY, 2023 VS 2030 (%)
- FIGURE 18. ASIA-PACIFIC ENGINEERING SERVICES OUTSOURCING MARKET SIZE, BY COUNTRY, 2023 VS 2024 VS 2030 (USD MILLION)
- FIGURE 19. EUROPE, MIDDLE EAST & AFRICA ENGINEERING SERVICES OUTSOURCING MARKET SIZE, BY COUNTRY, 2023 VS 2030 (%)
- FIGURE 20. EUROPE, MIDDLE EAST & AFRICA ENGINEERING SERVICES OUTSOURCING MARKET SIZE, BY COUNTRY, 2023 VS 2024 VS 2030 (USD MILLION)
- FIGURE 21. ENGINEERING SERVICES OUTSOURCING MARKET, FPNV POSITIONING MATRIX, 2023
- FIGURE 22. ENGINEERING SERVICES OUTSOURCING MARKET SHARE, BY KEY PLAYER, 2023
LIST OF TABLES
- TABLE 1. ENGINEERING SERVICES OUTSOURCING MARKET SEGMENTATION & COVERAGE
- TABLE 2. UNITED STATES DOLLAR EXCHANGE RATE, 2018-2023
- TABLE 3. ENGINEERING SERVICES OUTSOURCING MARKET SIZE, 2018-2030 (USD MILLION)
- TABLE 4. GLOBAL ENGINEERING SERVICES OUTSOURCING MARKET SIZE, BY REGION, 2018-2030 (USD MILLION)
- TABLE 5. ENGINEERING SERVICES OUTSOURCING MARKET SIZE, BY SERVICE, 2018-2030 (USD MILLION)
- TABLE 6. ENGINEERING SERVICES OUTSOURCING MARKET SIZE, BY DESIGNING, BY REGION, 2018-2030 (USD MILLION)
- TABLE 7. ENGINEERING SERVICES OUTSOURCING MARKET SIZE, BY PROTOTYPING, BY REGION, 2018-2030 (USD MILLION)
- TABLE 8. ENGINEERING SERVICES OUTSOURCING MARKET SIZE, BY SYSTEM INTEGRATION, BY REGION, 2018-2030 (USD MILLION)
- TABLE 9. ENGINEERING SERVICES OUTSOURCING MARKET SIZE, BY TESTING, BY REGION, 2018-2030 (USD MILLION)
- TABLE 10. ENGINEERING SERVICES OUTSOURCING MARKET SIZE, BY LOCATION, 2018-2030 (USD MILLION)
- TABLE 11. ENGINEERING SERVICES OUTSOURCING MARKET SIZE, BY OFF-SHORE, BY REGION, 2018-2030 (USD MILLION)
- TABLE 12. ENGINEERING SERVICES OUTSOURCING MARKET SIZE, BY ON-SHORE, BY REGION, 2018-2030 (USD MILLION)
- TABLE 13. ENGINEERING SERVICES OUTSOURCING MARKET SIZE, BY APPLICATION, 2018-2030 (USD MILLION)
- TABLE 14. ENGINEERING SERVICES OUTSOURCING MARKET SIZE, BY AEROSPACE, BY REGION, 2018-2030 (USD MILLION)
- TABLE 15. ENGINEERING SERVICES OUTSOURCING MARKET SIZE, BY AUTOMOTIVE, BY REGION, 2018-2030 (USD MILLION)
- TABLE 16. ENGINEERING SERVICES OUTSOURCING MARKET SIZE, BY CONSUMER ELECTRONICS, BY REGION, 2018-2030 (USD MILLION)
- TABLE 17. ENGINEERING SERVICES OUTSOURCING MARKET SIZE, BY HEALTHCARE, BY REGION, 2018-2030 (USD MILLION)
- TABLE 18. ENGINEERING SERVICES OUTSOURCING MARKET SIZE, BY INDUSTRIAL, BY REGION, 2018-2030 (USD MILLION)
- TABLE 19. ENGINEERING SERVICES OUTSOURCING MARKET SIZE, BY SEMICONDUCTORS, BY REGION, 2018-2030 (USD MILLION)
- TABLE 20. ENGINEERING SERVICES OUTSOURCING MARKET SIZE, BY TELECOM, BY REGION, 2018-2030 (USD MILLION)
- TABLE 21. AMERICAS ENGINEERING SERVICES OUTSOURCING MARKET SIZE, BY SERVICE, 2018-2030 (USD MILLION)
- TABLE 22. AMERICAS ENGINEERING SERVICES OUTSOURCING MARKET SIZE, BY LOCATION, 2018-2030 (USD MILLION)
- TABLE 23. AMERICAS ENGINEERING SERVICES OUTSOURCING MARKET SIZE, BY APPLICATION, 2018-2030 (USD MILLION)
- TABLE 24. AMERICAS ENGINEERING SERVICES OUTSOURCING MARKET SIZE, BY COUNTRY, 2018-2030 (USD MILLION)
- TABLE 25. ARGENTINA ENGINEERING SERVICES OUTSOURCING MARKET SIZE, BY SERVICE, 2018-2030 (USD MILLION)
- TABLE 26. ARGENTINA ENGINEERING SERVICES OUTSOURCING MARKET SIZE, BY LOCATION, 2018-2030 (USD MILLION)
- TABLE 27. ARGENTINA ENGINEERING SERVICES OUTSOURCING MARKET SIZE, BY APPLICATION, 2018-2030 (USD MILLION)
- TABLE 28. BRAZIL ENGINEERING SERVICES OUTSOURCING MARKET SIZE, BY SERVICE, 2018-2030 (USD MILLION)
- TABLE 29. BRAZIL ENGINEERING SERVICES OUTSOURCING MARKET SIZE, BY LOCATION, 2018-2030 (USD MILLION)
- TABLE 30. BRAZIL ENGINEERING SERVICES OUTSOURCING MARKET SIZE, BY APPLICATION, 2018-2030 (USD MILLION)
- TABLE 31. CANADA ENGINEERING SERVICES OUTSOURCING MARKET SIZE, BY SERVICE, 2018-2030 (USD MILLION)
- TABLE 32. CANADA ENGINEERING SERVICES OUTSOURCING MARKET SIZE, BY LOCATION, 2018-2030 (USD MILLION)
- TABLE 33. CANADA ENGINEERING SERVICES OUTSOURCING MARKET SIZE, BY APPLICATION, 2018-2030 (USD MILLION)
- TABLE 34. MEXICO ENGINEERING SERVICES OUTSOURCING MARKET SIZE, BY SERVICE, 2018-2030 (USD MILLION)
- TABLE 35. MEXICO ENGINEERING SERVICES OUTSOURCING MARKET SIZE, BY LOCATION, 2018-2030 (USD MILLION)
- TABLE 36. MEXICO ENGINEERING SERVICES OUTSOURCING MARKET SIZE, BY APPLICATION, 2018-2030 (USD MILLION)
- TABLE 37. UNITED STATES ENGINEERING SERVICES OUTSOURCING MARKET SIZE, BY SERVICE, 2018-2030 (USD MILLION)
- TABLE 38. UNITED STATES ENGINEERING SERVICES OUTSOURCING MARKET SIZE, BY LOCATION, 2018-2030 (USD MILLION)
- TABLE 39. UNITED STATES ENGINEERING SERVICES OUTSOURCING MARKET SIZE, BY APPLICATION, 2018-2030 (USD MILLION)
- TABLE 40. UNITED STATES ENGINEERING SERVICES OUTSOURCING MARKET SIZE, BY STATE, 2018-2030 (USD MILLION)
- TABLE 41. ASIA-PACIFIC ENGINEERING SERVICES OUTSOURCING MARKET SIZE, BY SERVICE, 2018-2030 (USD MILLION)
- TABLE 42. ASIA-PACIFIC ENGINEERING SERVICES OUTSOURCING MARKET SIZE, BY LOCATION, 2018-2030 (USD MILLION)
- TABLE 43. ASIA-PACIFIC ENGINEERING SERVICES OUTSOURCING MARKET SIZE, BY APPLICATION, 2018-2030 (USD MILLION)
- TABLE 44. ASIA-PACIFIC ENGINEERING SERVICES OUTSOURCING MARKET SIZE, BY COUNTRY, 2018-2030 (USD MILLION)
- TABLE 45. AUSTRALIA ENGINEERING SERVICES OUTSOURCING MARKET SIZE, BY SERVICE, 2018-2030 (USD MILLION)
- TABLE 46. AUSTRALIA ENGINEERING SERVICES OUTSOURCING MARKET SIZE, BY LOCATION, 2018-2030 (USD MILLION)
- TABLE 47. AUSTRALIA ENGINEERING SERVICES OUTSOURCING MARKET SIZE, BY APPLICATION, 2018-2030 (USD MILLION)
- TABLE 48. CHINA ENGINEERING SERVICES OUTSOURCING MARKET SIZE, BY SERVICE, 2018-2030 (USD MILLION)
- TABLE 49. CHINA ENGINEERING SERVICES OUTSOURCING MARKET SIZE, BY LOCATION, 2018-2030 (USD MILLION)
- TABLE 50. CHINA ENGINEERING SERVICES OUTSOURCING MARKET SIZE, BY APPLICATION, 2018-2030 (USD MILLION)
- TABLE 51. INDIA ENGINEERING SERVICES OUTSOURCING MARKET SIZE, BY SERVICE, 2018-2030 (USD MILLION)
- TABLE 52. INDIA ENGINEERING SERVICES OUTSOURCING MARKET SIZE, BY LOCATION, 2018-2030 (USD MILLION)
- TABLE 53. INDIA ENGINEERING SERVICES OUTSOURCING MARKET SIZE, BY APPLICATION, 2018-2030 (USD MILLION)
- TABLE 54. INDONESIA ENGINEERING SERVICES OUTSOURCING MARKET SIZE, BY SERVICE, 2018-2030 (USD MILLION)
- TABLE 55. INDONESIA ENGINEERING SERVICES OUTSOURCING MARKET SIZE, BY LOCATION, 2018-2030 (USD MILLION)
- TABLE 56. INDONESIA ENGINEERING SERVICES OUTSOURCING MARKET SIZE, BY APPLICATION, 2018-2030 (USD MILLION)
- TABLE 57. JAPAN ENGINEERING SERVICES OUTSOURCING MARKET SIZE, BY SERVICE, 2018-2030 (USD MILLION)
- TABLE 58. JAPAN ENGINEERING SERVICES OUTSOURCING MARKET SIZE, BY LOCATION, 2018-2030 (USD MILLION)
- TABLE 59. JAPAN ENGINEERING SERVICES OUTSOURCING MARKET SIZE, BY APPLICATION, 2018-2030 (USD MILLION)
- TABLE 60. MALAYSIA ENGINEERING SERVICES OUTSOURCING MARKET SIZE, BY SERVICE, 2018-2030 (USD MILLION)
- TABLE 61. MALAYSIA ENGINEERING SERVICES OUTSOURCING MARKET SIZE, BY LOCATION, 2018-2030 (USD MILLION)
- TABLE 62. MALAYSIA ENGINEERING SERVICES OUTSOURCING MARKET SIZE, BY APPLICATION, 2018-2030 (USD MILLION)
- TABLE 63. PHILIPPINES ENGINEERING SERVICES OUTSOURCING MARKET SIZE, BY SERVICE, 2018-2030 (USD MILLION)
- TABLE 64. PHILIPPINES ENGINEERING SERVICES OUTSOURCING MARKET SIZE, BY LOCATION, 2018-2030 (USD MILLION)
- TABLE 65. PHILIPPINES ENGINEERING SERVICES OUTSOURCING MARKET SIZE, BY APPLICATION, 2018-2030 (USD MILLION)
- TABLE 66. SINGAPORE ENGINEERING SERVICES OUTSOURCING MARKET SIZE, BY SERVICE, 2018-2030 (USD MILLION)
- TABLE 67. SINGAPORE ENGINEERING SERVICES OUTSOURCING MARKET SIZE, BY LOCATION, 2018-2030 (USD MILLION)
- TABLE 68. SINGAPORE ENGINEERING SERVICES OUTSOURCING MARKET SIZE, BY APPLICATION, 2018-2030 (USD MILLION)
- TABLE 69. SOUTH KOREA ENGINEERING SERVICES OUTSOURCING MARKET SIZE, BY SERVICE, 2018-2030 (USD MILLION)
- TABLE 70. SOUTH KOREA ENGINEERING SERVICES OUTSOURCING MARKET SIZE, BY LOCATION, 2018-2030 (USD MILLION)
- TABLE 71. SOUTH KOREA ENGINEERING SERVICES OUTSOURCING MARKET SIZE, BY APPLICATION, 2018-2030 (USD MILLION)
- TABLE 72. TAIWAN ENGINEERING SERVICES OUTSOURCING MARKET SIZE, BY SERVICE, 2018-2030 (USD MILLION)
- TABLE 73. TAIWAN ENGINEERING SERVICES OUTSOURCING MARKET SIZE, BY LOCATION, 2018-2030 (USD MILLION)
- TABLE 74. TAIWAN ENGINEERING SERVICES OUTSOURCING MARKET SIZE, BY APPLICATION, 2018-2030 (USD MILLION)
- TABLE 75. THAILAND ENGINEERING SERVICES OUTSOURCING MARKET SIZE, BY SERVICE, 2018-2030 (USD MILLION)
- TABLE 76. THAILAND ENGINEERING SERVICES OUTSOURCING MARKET SIZE, BY LOCATION, 2018-2030 (USD MILLION)
- TABLE 77. THAILAND ENGINEERING SERVICES OUTSOURCING MARKET SIZE, BY APPLICATION, 2018-2030 (USD MILLION)
- TABLE 78. VIETNAM ENGINEERING SERVICES OUTSOURCING MARKET SIZE, BY SERVICE, 2018-2030 (USD MILLION)
- TABLE 79. VIETNAM ENGINEERING SERVICES OUTSOURCING MARKET SIZE, BY LOCATION, 2018-2030 (USD MILLION)
- TABLE 80. VIETNAM ENGINEERING SERVICES OUTSOURCING MARKET SIZE, BY APPLICATION, 2018-2030 (USD MILLION)
- TABLE 81. EUROPE, MIDDLE EAST & AFRICA ENGINEERING SERVICES OUTSOURCING MARKET SIZE, BY SERVICE, 2018-2030 (USD MILLION)
- TABLE 82. EUROPE, MIDDLE EAST & AFRICA ENGINEERING SERVICES OUTSOURCING MARKET SIZE, BY LOCATION, 2018-2030 (USD MILLION)
- TABLE 83. EUROPE, MIDDLE EAST & AFRICA ENGINEERING SERVICES OUTSOURCING MARKET SIZE, BY APPLICATION, 2018-2030 (USD MILLION)
- TABLE 84. EUROPE, MIDDLE EAST & AFRICA ENGINEERING SERVICES OUTSOURCING MARKET SIZE, BY COUNTRY, 2018-2030 (USD MILLION)
- TABLE 85. DENMARK ENGINEERING SERVICES OUTSOURCING MARKET SIZE, BY SERVICE, 2018-2030 (USD MILLION)
- TABLE 86. DENMARK ENGINEERING SERVICES OUTSOURCING MARKET SIZE, BY LOCATION, 2018-2030 (USD MILLION)
- TABLE 87. DENMARK ENGINEERING SERVICES OUTSOURCING MARKET SIZE, BY APPLICATION, 2018-2030 (USD MILLION)
- TABLE 88. EGYPT ENGINEERING SERVICES OUTSOURCING MARKET SIZE, BY SERVICE, 2018-2030 (USD MILLION)
- TABLE 89. EGYPT ENGINEERING SERVICES OUTSOURCING MARKET SIZE, BY LOCATION, 2018-2030 (USD MILLION)
- TABLE 90. EGYPT ENGINEERING SERVICES OUTSOURCING MARKET SIZE, BY APPLICATION, 2018-2030 (USD MILLION)
- TABLE 91. FINLAND ENGINEERING SERVICES OUTSOURCING MARKET SIZE, BY SERVICE, 2018-2030 (USD MILLION)
- TABLE 92. FINLAND ENGINEERING SERVICES OUTSOURCING MARKET SIZE, BY LOCATION, 2018-2030 (USD MILLION)
- TABLE 93. FINLAND ENGINEERING SERVICES OUTSOURCING MARKET SIZE, BY APPLICATION, 2018-2030 (USD MILLION)
- TABLE 94. FRANCE ENGINEERING SERVICES OUTSOURCING MARKET SIZE, BY SERVICE, 2018-2030 (USD MILLION)
- TABLE 95. FRANCE ENGINEERING SERVICES OUTSOURCING MARKET SIZE, BY LOCATION, 2018-2030 (USD MILLION)
- TABLE 96. FRANCE ENGINEERING SERVICES OUTSOURCING MARKET SIZE, BY APPLICATION, 2018-2030 (USD MILLION)
- TABLE 97. GERMANY ENGINEERING SERVICES OUTSOURCING MARKET SIZE, BY SERVICE, 2018-2030 (USD MILLION)
- TABLE 98. GERMANY ENGINEERING SERVICES OUTSOURCING MARKET SIZE, BY LOCATION, 2018-2030 (USD MILLION)
- TABLE 99. GERMANY ENGINEERING SERVICES OUTSOURCING MARKET SIZE, BY APPLICATION, 2018-2030 (USD MILLION)
- TABLE 100. ISRAEL ENGINEERING SERVICES OUTSOURCING MARKET SIZE, BY SERVICE, 2018-2030 (USD MILLION)
- TABLE 101. ISRAEL ENGINEERING SERVICES OUTSOURCING MARKET SIZE, BY LOCATION, 2018-2030 (USD MILLION)
- TABLE 102. ISRAEL ENGINEERING SERVICES OUTSOURCING MARKET SIZE, BY APPLICATION, 2018-2030 (USD MILLION)
- TABLE 103. ITALY ENGINEERING SERVICES OUTSOURCING MARKET SIZE, BY SERVICE, 2018-2030 (USD MILLION)
- TABLE 104. ITALY ENGINEERING SERVICES OUTSOURCING MARKET SIZE, BY LOCATION, 2018-2030 (USD MILLION)
- TABLE 105. ITALY ENGINEERING SERVICES OUTSOURCING MARKET SIZE, BY APPLICATION, 2018-2030 (USD MILLION)
- TABLE 106. NETHERLANDS ENGINEERING SERVICES OUTSOURCING MARKET SIZE, BY SERVICE, 2018-2030 (USD MILLION)
- TABLE 107. NETHERLANDS ENGINEERING SERVICES OUTSOURCING MARKET SIZE, BY LOCATION, 2018-2030 (USD MILLION)
- TABLE 108. NETHERLANDS ENGINEERING SERVICES OUTSOURCING MARKET SIZE, BY APPLICATION, 2018-2030 (USD MILLION)
- TABLE 109. NIGERIA ENGINEERING SERVICES OUTSOURCING MARKET SIZE, BY SERVICE, 2018-2030 (USD MILLION)
- TABLE 110. NIGERIA ENGINEERING SERVICES OUTSOURCING MARKET SIZE, BY LOCATION, 2018-2030 (USD MILLION)
- TABLE 111. NIGERIA ENGINEERING SERVICES OUTSOURCING MARKET SIZE, BY APPLICATION, 2018-2030 (USD MILLION)
- TABLE 112. NORWAY ENGINEERING SERVICES OUTSOURCING MARKET SIZE, BY SERVICE, 2018-2030 (USD MILLION)
- TABLE 113. NORWAY ENGINEERING SERVICES OUTSOURCING MARKET SIZE, BY LOCATION, 2018-2030 (USD MILLION)
- TABLE 114. NORWAY ENGINEERING SERVICES OUTSOURCING MARKET SIZE, BY APPLICATION, 2018-2030 (USD MILLION)
- TABLE 115. POLAND ENGINEERING SERVICES OUTSOURCING MARKET SIZE, BY SERVICE, 2018-2030 (USD MILLION)
- TABLE 116. POLAND ENGINEERING SERVICES OUTSOURCING MARKET SIZE, BY LOCATION, 2018-2030 (USD MILLION)
- TABLE 117. POLAND ENGINEERING SERVICES OUTSOURCING MARKET SIZE, BY APPLICATION, 2018-2030 (USD MILLION)
- TABLE 118. QATAR ENGINEERING SERVICES OUTSOURCING MARKET SIZE, BY SERVICE, 2018-2030 (USD MILLION)
- TABLE 119. QATAR ENGINEERING SERVICES OUTSOURCING MARKET SIZE, BY LOCATION, 2018-2030 (USD MILLION)
- TABLE 120. QATAR ENGINEERING SERVICES OUTSOURCING MARKET SIZE, BY APPLICATION, 2018-2030 (USD MILLION)
- TABLE 121. RUSSIA ENGINEERING SERVICES OUTSOURCING MARKET SIZE, BY SERVICE, 2018-2030 (USD MILLION)
- TABLE 122. RUSSIA ENGINEERING SERVICES OUTSOURCING MARKET SIZE, BY LOCATION, 2018-2030 (USD MILLION)
- TABLE 123. RUSSIA ENGINEERING SERVICES OUTSOURCING MARKET SIZE, BY APPLICATION, 2018-2030 (USD MILLION)
- TABLE 124. SAUDI ARABIA ENGINEERING SERVICES OUTSOURCING MARKET SIZE, BY SERVICE, 2018-2030 (USD MILLION)
- TABLE 125. SAUDI ARABIA ENGINEERING SERVICES OUTSOURCING MARKET SIZE, BY LOCATION, 2018-2030 (USD MILLION)
- TABLE 126. SAUDI ARABIA ENGINEERING SERVICES OUTSOURCING MARKET SIZE, BY APPLICATION, 2018-2030 (USD MILLION)
- TABLE 127. SOUTH AFRICA ENGINEERING SERVICES OUTSOURCING MARKET SIZE, BY SERVICE, 2018-2030 (USD MILLION)
- TABLE 128. SOUTH AFRICA ENGINEERING SERVICES OUTSOURCING MARKET SIZE, BY LOCATION, 2018-2030 (USD MILLION)
- TABLE 129. SOUTH AFRICA ENGINEERING SERVICES OUTSOURCING MARKET SIZE, BY APPLICATION, 2018-2030 (USD MILLION)
- TABLE 130. SPAIN ENGINEERING SERVICES OUTSOURCING MARKET SIZE, BY SERVICE, 2018-2030 (USD MILLION)
- TABLE 131. SPAIN ENGINEERING SERVICES OUTSOURCING MARKET SIZE, BY LOCATION, 2018-2030 (USD MILLION)
- TABLE 132. SPAIN ENGINEERING SERVICES OUTSOURCING MARKET SIZE, BY APPLICATION, 2018-2030 (USD MILLION)
- TABLE 133. SWEDEN ENGINEERING SERVICES OUTSOURCING MARKET SIZE, BY SERVICE, 2018-2030 (USD MILLION)
- TABLE 134. SWEDEN ENGINEERING SERVICES OUTSOURCING MARKET SIZE, BY LOCATION, 2018-2030 (USD MILLION)
- TABLE 135. SWEDEN ENGINEERING SERVICES OUTSOURCING MARKET SIZE, BY APPLICATION, 2018-2030 (USD MILLION)
- TABLE 136. SWITZERLAND ENGINEERING SERVICES OUTSOURCING MARKET SIZE, BY SERVICE, 2018-2030 (USD MILLION)
- TABLE 137. SWITZERLAND ENGINEERING SERVICES OUTSOURCING MARKET SIZE, BY LOCATION, 2018-2030 (USD MILLION)
- TABLE 138. SWITZERLAND ENGINEERING SERVICES OUTSOURCING MARKET SIZE, BY APPLICATION, 2018-2030 (USD MILLION)
- TABLE 139. TURKEY ENGINEERING SERVICES OUTSOURCING MARKET SIZE, BY SERVICE, 2018-2030 (USD MILLION)
- TABLE 140. TURKEY ENGINEERING SERVICES OUTSOURCING MARKET SIZE, BY LOCATION, 2018-2030 (USD MILLION)
- TABLE 141. TURKEY ENGINEERING SERVICES OUTSOURCING MARKET SIZE, BY APPLICATION, 2018-2030 (USD MILLION)
- TABLE 142. UNITED ARAB EMIRATES ENGINEERING SERVICES OUTSOURCING MARKET SIZE, BY SERVICE, 2018-2030 (USD MILLION)
- TABLE 143. UNITED ARAB EMIRATES ENGINEERING SERVICES OUTSOURCING MARKET SIZE, BY LOCATION, 2018-2030 (USD MILLION)
- TABLE 144. UNITED ARAB EMIRATES ENGINEERING SERVICES OUTSOURCING MARKET SIZE, BY APPLICATION, 2018-2030 (USD MILLION)
- TABLE 145. UNITED KINGDOM ENGINEERING SERVICES OUTSOURCING MARKET SIZE, BY SERVICE, 2018-2030 (USD MILLION)
- TABLE 146. UNITED KINGDOM ENGINEERING SERVICES OUTSOURCING MARKET SIZE, BY LOCATION, 2018-2030 (USD MILLION)
- TABLE 147. UNITED KINGDOM ENGINEERING SERVICES OUTSOURCING MARKET SIZE, BY APPLICATION, 2018-2030 (USD MILLION)
- TABLE 148. ENGINEERING SERVICES OUTSOURCING MARKET, FPNV POSITIONING MATRIX, 2023
- TABLE 149. ENGINEERING SERVICES OUTSOURCING MARKET SHARE, BY KEY PLAYER, 2023
- TABLE 150. ENGINEERING SERVICES OUTSOURCING MARKET LICENSE & PRICING
 全球工程服务外包:市场占有率分析、产业趋势与统计、成长预测(2024-2029)
 工程服务外包市场报告:2030年趋势、预测与竞争分析
 工程服务外包 (ESO) 市场、份额、规模、趋势、产业分析报告:按应用程式、地点、地区、细分市场预测,2024-2032 年
 2024 年全球研发外包服务市场报告
 2024-2028年全球研发外包服务市场
 工程服务外包市场:2023-2028 年全球产业趋势、份额、规模、成长、机会与预测
 全球工程服务外包市场
 工程服务外包的全球市场 2023-2027
 工程研发服务外包市场(地点:在岸和离岸;以及服务:设计、原型制作、系统集成、测试和其他) - 2023-2031年全球行业分析、规模、份额、增长、趋势和预测
 工程服务外包的全球市场 - 市场规模,占有率,成长分析:各类服务,各场所类型,各业界,产业预测(2022年~2028年)