


 |
市场调查报告书
商品编码
1415399
勃起功能障碍设备市场:按类型、年龄层、最终用户划分 - 全球预测 2024-2030Erectile Dysfunction Devices Market by Type (Penile Implants, Shockwave Therapy, Vacuum Constriction Devices), Age Group (40-60 years, Less than 40 years, More than 60 years), End User - Global Forecast 2024-2030 |
||||||
※ 本网页内容可能与最新版本有所差异。详细情况请与我们联繫。
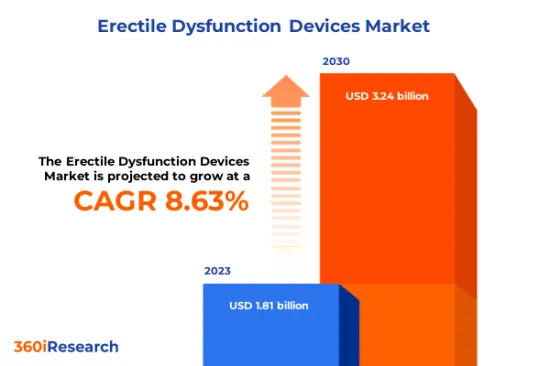
预计2023年勃起功能障碍器材市场规模为18.1亿美元,预计2024年将达19.6亿美元,2030年将达32.4亿美元,复合年增长率为8.63%。
勃起功能障碍设备的全球市场
| 主要市场统计 | |
|---|---|
| 基准年[2023] | 18.1亿美元 |
| 预测年份 [2024] | 19.6亿美元 |
| 预测年份 [2030] | 32.4亿美元 |
| 复合年增长率(%) | 8.63% |
勃起功能障碍装置是一种医疗装置或装置,旨在帮助男性管理和治疗勃起功能障碍的症状。这些设备为患有勃起功能障碍的男性提供了一种非侵入性、安全且有效的药物和手术治疗方法。勃起功能障碍装置的主要目的是透过各种机制改善阴茎的血流量,让男性能够进行正常的性行为。勃起功能障碍设备的全球市场包括各种旨在解决成年男性勃起功能障碍的症状和原因的医疗设备。近年来,随着糖尿病和心血管疾病等老龄化相关疾病导致勃起功能障碍病例的增加,勃起功能障碍设备的需求也增加。然而,一些限制和挑战阻碍了市场的成长,例如与先进的勃起功能障碍设备相关的高成本、某些治疗方法的潜在副作用阻碍了采用,以及新兴市场对勃起功能障碍的误解。除了这些挑战之外,公司还致力于开发具有成本效益的解决方案,同时不影响品质或安全性,以增加勃起功能障碍设备的普及。此外,对减少副作用的研究投资和开发新的非侵入性勃起功能障碍治疗方法预计将为全球勃起功能障碍设备市场创造有利的空间。
区域洞察
在美洲,美国在勃起功能障碍设备的市场成长中处于领先地位。造成此现象的因素包括导致勃起功能障碍的糖尿病和高血压等与文明病增加、性健康意识增强以及人均医疗费用增加。此外,医疗技术的进步导致了更有效的非侵入性勃起功能障碍治疗方法的开发,这些治疗方法在喜欢非药理学的处置方法的患者中越来越受欢迎。在欧洲、中东和非洲地区,容易出现勃起功能障碍的老化人口正在增加,推动了市场的成长。此外,旨在意识提升的政府措施正在促进可用治疗方案的教育。此外,改善的医疗基础设施和增加分配给医学研究的资金也有助于勃起功能障碍设备在欧洲、中东和非洲地区的普及。由于中国和印度等新兴经济体的人口成长,亚太地区的勃起功能障碍治疗设备製造商呈现出充满活力的形势。糖尿病、高血压和其他文明病的高盛行率导致勃起功能障碍的发生率较高,这些因素正在推动该地区的成长。
FPNV定位矩阵
FPNV定位矩阵对于评估勃起功能障碍设备市场至关重要。我们检视与业务策略和产品满意度相关的关键指标,以对供应商进行全面评估。这种深入的分析使用户能够根据自己的要求做出明智的决策。根据评估,供应商被分为四个成功程度不同的像限:前沿(F)、探路者(P)、利基(N)和重要(V)。
市场占有率分析
市场占有率分析是一种综合工具,可以对勃起功能障碍设备市场供应商的现状进行深入而详细的研究。全面比较和分析供应商在整体收益、基本客群和其他关键指标方面的贡献,以便更好地了解公司的绩效及其在争夺市场占有率时面临的挑战。此外,该分析还提供了对该行业竞争特征的宝贵考察,包括在研究基准年观察到的累积、分散主导地位和合併特征等因素。这种详细程度的提高使供应商能够做出更明智的决策并制定有效的策略,从而在市场上获得竞争优势。
该报告对以下几个方面提供了宝贵的见解:
1-市场渗透率:提供有关主要企业所服务的市场的全面资讯。
2-市场开拓:我们深入研究利润丰厚的新兴市场,并分析它们在成熟细分市场中的渗透率。
3- 市场多元化:提供有关新产品发布、开拓地区、最新发展和投资的详细资讯。
4-竞争力评估与资讯:对主要企业的市场占有率、策略、产品、认证、监管状况、专利状况、製造能力等进行全面评估。
5- 产品开发与创新:提供对未来技术、研发活动和突破性产品开发的见解。
本报告解决了以下关键问题:
1-勃起功能障碍设备市场的市场规模和预测是多少?
2-在勃起功能障碍器材市场的预测期内,需要考虑投资哪些产品、细分市场、应用和领域?
3-勃起功能障碍设备市场的技术趋势和法律规范是什么?
4-勃起功能障碍设备市场主要供应商的市场占有率是多少?
5-进入勃起功能障碍器材市场的适当型态和策略手段是什么?
目录
第一章 前言
第二章调查方法
第三章执行摘要
第四章市场概况
第五章市场洞察
- 市场动态
- 促进因素
- 全球前列腺癌发生率上升
- 吸烟率增加
- 勃起功能障碍设备的研究投资激增
- 抑制因素
- 与勃起功能障碍装置相关的高成本
- 机会
- 勃起功能障碍装置製造的技术进步
- 对个人化治疗方案的偏好日益增加
- 任务
- 对与勃起功能障碍相关的社会耻辱的担忧
- 促进因素
- 市场区隔分析
- 类型:非侵入性衝击波治疗设备优先
- 年龄层:60 岁以上的老年男性更多采用低风险解决方案
- 最终使用者:勃起功能障碍治疗诊所对易于使用的非侵入性设备的需求不断增加
- 市场趋势分析
- 高通膨的累积效应
- 波特五力分析
- 价值炼和关键路径分析
- 法律规范
第六章 勃起功能障碍设备市场:依类型
- 阴茎植入
- 衝击波疗法
- 真空收缩装置
第七章 勃起功能障碍设备市场:依年龄组
- 40-60岁
- 不到40年
- 超过 60 年
第八章 勃起功能障碍设备市场:依最终使用者分类
- 诊所
- 医院
第九章美洲勃起功能障碍设备市场
- 阿根廷
- 巴西
- 加拿大
- 墨西哥
- 美国
第十章亚太地区勃起功能障碍设备市场
- 澳洲
- 中国
- 印度
- 印尼
- 日本
- 马来西亚
- 菲律宾
- 新加坡
- 韩国
- 台湾
- 泰国
- 越南
第十一章欧洲、中东和非洲的勃起功能障碍装置市场
- 丹麦
- 埃及
- 芬兰
- 法国
- 德国
- 以色列
- 义大利
- 荷兰
- 奈及利亚
- 挪威
- 波兰
- 卡达
- 俄罗斯
- 沙乌地阿拉伯
- 南非
- 西班牙
- 瑞典
- 瑞士
- 土耳其
- 阿拉伯聯合大公国
- 英国
第十二章竞争形势
- FPNV定位矩阵
- 市场占有率分析:按主要企业划分
- 主要企业竞争情境分析
- 併购
- 新产品发布和功能增强
第13章竞争产品组合
- 主要公司简介
- Advin Health Care
- Alma Lasers Ltd.
- Augusta Medical Systems LLC
- Boston Scientific Corporation
- Coloplast A/S
- Comphya SA
- DirexGroup
- Futura Medical Developments Limited
- G.SURGIWEAR LTD.
- Implantica Management AG
- Medispec Ltd.
- OHHMED Medical Ltd.
- Owen Mumford Limited
- PROMEDON GmbH
- Rigicon, Inc.
- STORZ MEDICAL AG
- TE Inc.
- TIMM Medical
- Vacurect
- Zimmer MedizinSysteme GmbH
- ZSI Surgical Implants SRL
- 主要产品系列
第十四章附录
- 讨论指南
- 关于许可证和定价
[184 Pages Report] The Erectile Dysfunction Devices Market size was estimated at USD 1.81 billion in 2023 and expected to reach USD 1.96 billion in 2024, at a CAGR 8.63% to reach USD 3.24 billion by 2030.
Global Erectile Dysfunction Devices Market
| KEY MARKET STATISTICS | |
|---|---|
| Base Year [2023] | USD 1.81 billion |
| Estimated Year [2024] | USD 1.96 billion |
| Forecast Year [2030] | USD 3.24 billion |
| CAGR (%) | 8.63% |
Erectile dysfunction devices are medical tools and apparatuses designed to help men manage and treat the symptoms of erectile dysfunction, a condition characterized by the inability to maintain or achieve an erection firm enough for satisfactory sexual intercourse. These devices offer a non-invasive, safe, and effective alternative to medications or surgical interventions for individuals with erectile dysfunction. The primary aim of erectile dysfunction devices is to improve blood flow to the penis by employing various mechanisms, enabling men to engage in normal sexual activity. The global erectile dysfunction devices market encompasses a variety of medical devices designed to address erectile dysfunction symptoms and causes in adult males. In recent years, there has been a growing demand for erectile dysfunction devices attributed to the rising cases of erectile dysfunction owing to age-related conditions such as diabetes and cardiovascular diseases. However, several limitations and challenges affect the market growth, which includes high costs associated with advanced erectile dysfunction devices, possible side effects from some treatment procedures deterring adoption, and misconceptions surrounding erectile dysfunction in emerging markets. Besides these challenges, companies are focusing on developing cost-effective solutions without compromising quality or safety to raise the adoption of erectile dysfunction devices. Moreover, investing in research to minimize adverse effects or create new non-invasive erectile dysfunction therapies is expected to create a lucrative scope for the global erectile dysfunction devices market.
Regional Insights
In the Americas, the United States is driving the market growth for erectile dysfunction devices, which is attributed to factors such as the increased prevalence of lifestyle-related diseases, including diabetes and hypertension, that contribute to erectile dysfunction, growing awareness about sexual health, and higher per capita healthcare expenditure. Additionally, advancements in medical technologies have led to more effective non-invasive erectile dysfunction treatments, which are gaining popularity among patients who prefer a non-pharmacological approach. In EMEA, rising geriatric populations who are more susceptible to developing erectile dysfunction are propelling market growth. Furthermore, government initiatives aimed at creating awareness about sexual health issues are fostering education about available treatment options. Moreover, improvements in healthcare infrastructure and increased funding allocated towards medical research have been contributing to the widespread adoption of erectile dysfunction devices across the EMEA. The APAC region presents a dynamic landscape for erectile dysfunction device manufacturers owing to the increasing population across emerging economies, including China and India. Factors such as a large patient pool suffering from diabetes, hypertension, and other lifestyle diseases, leading to erectile dysfunction incidence rates, are propelling growth in the region.
FPNV Positioning Matrix
The FPNV Positioning Matrix is pivotal in evaluating the Erectile Dysfunction Devices Market. It offers a comprehensive assessment of vendors, examining key metrics related to Business Strategy and Product Satisfaction. This in-depth analysis empowers users to make well-informed decisions aligned with their requirements. Based on the evaluation, the vendors are then categorized into four distinct quadrants representing varying levels of success: Forefront (F), Pathfinder (P), Niche (N), or Vital (V).
Market Share Analysis
The Market Share Analysis is a comprehensive tool that provides an insightful and in-depth examination of the current state of vendors in the Erectile Dysfunction Devices Market. By meticulously comparing and analyzing vendor contributions in terms of overall revenue, customer base, and other key metrics, we can offer companies a greater understanding of their performance and the challenges they face when competing for market share. Additionally, this analysis provides valuable insights into the competitive nature of the sector, including factors such as accumulation, fragmentation dominance, and amalgamation traits observed over the base year period studied. With this expanded level of detail, vendors can make more informed decisions and devise effective strategies to gain a competitive edge in the market.
Key Company Profiles
The report delves into recent significant developments in the Erectile Dysfunction Devices Market, highlighting leading vendors and their innovative profiles. These include Advin Health Care, Alma Lasers Ltd., Augusta Medical Systems LLC, Boston Scientific Corporation, Coloplast A/S, Comphya SA, DirexGroup, Futura Medical Developments Limited, G.SURGIWEAR LTD., Implantica Management AG, Medispec Ltd., OHHMED Medical Ltd., Owen Mumford Limited, PROMEDON GmbH, Rigicon, Inc., STORZ MEDICAL AG, T.E. Inc., TIMM Medical, Vacurect, Zimmer MedizinSysteme GmbH, and ZSI Surgical Implants S.R.L..
Market Segmentation & Coverage
This research report categorizes the Erectile Dysfunction Devices Market to forecast the revenues and analyze trends in each of the following sub-markets:
- Type
- Penile Implants
- Shockwave Therapy
- Vacuum Constriction Devices
- Age Group
- 40-60 years
- Less than 40 years
- More than 60 years
- End User
- Clinics
- Hospitals
- Region
- Americas
- Argentina
- Brazil
- Canada
- Mexico
- United States
- California
- Florida
- Illinois
- New York
- Ohio
- Pennsylvania
- Texas
- Asia-Pacific
- Australia
- China
- India
- Indonesia
- Japan
- Malaysia
- Philippines
- Singapore
- South Korea
- Taiwan
- Thailand
- Vietnam
- Europe, Middle East & Africa
- Denmark
- Egypt
- Finland
- France
- Germany
- Israel
- Italy
- Netherlands
- Nigeria
- Norway
- Poland
- Qatar
- Russia
- Saudi Arabia
- South Africa
- Spain
- Sweden
- Switzerland
- Turkey
- United Arab Emirates
- United Kingdom
- Americas
The report offers valuable insights on the following aspects:
1. Market Penetration: It presents comprehensive information on the market provided by key players.
2. Market Development: It delves deep into lucrative emerging markets and analyzes the penetration across mature market segments.
3. Market Diversification: It provides detailed information on new product launches, untapped geographic regions, recent developments, and investments.
4. Competitive Assessment & Intelligence: It conducts an exhaustive assessment of market shares, strategies, products, certifications, regulatory approvals, patent landscape, and manufacturing capabilities of the leading players.
5. Product Development & Innovation: It offers intelligent insights on future technologies, R&D activities, and breakthrough product developments.
The report addresses key questions such as:
1. What is the market size and forecast of the Erectile Dysfunction Devices Market?
2. Which products, segments, applications, and areas should one consider investing in over the forecast period in the Erectile Dysfunction Devices Market?
3. What are the technology trends and regulatory frameworks in the Erectile Dysfunction Devices Market?
4. What is the market share of the leading vendors in the Erectile Dysfunction Devices Market?
5. Which modes and strategic moves are suitable for entering the Erectile Dysfunction Devices Market?
Table of Contents
1. Preface
- 1.1. Objectives of the Study
- 1.2. Market Segmentation & Coverage
- 1.3. Years Considered for the Study
- 1.4. Currency & Pricing
- 1.5. Language
- 1.6. Limitations
- 1.7. Assumptions
- 1.8. Stakeholders
2. Research Methodology
- 2.1. Define: Research Objective
- 2.2. Determine: Research Design
- 2.3. Prepare: Research Instrument
- 2.4. Collect: Data Source
- 2.5. Analyze: Data Interpretation
- 2.6. Formulate: Data Verification
- 2.7. Publish: Research Report
- 2.8. Repeat: Report Update
3. Executive Summary
4. Market Overview
- 4.1. Introduction
- 4.2. Erectile Dysfunction Devices Market, by Region
5. Market Insights
- 5.1. Market Dynamics
- 5.1.1. Drivers
- 5.1.1.1. Increasing incidences of prostate cancer across the world
- 5.1.1.2. Growing prevalence of tobacco smoking
- 5.1.1.3. Surge in research investment in erectile dysfunction devices
- 5.1.2. Restraints
- 5.1.2.1. High cost associated with erectile dysfunction devices
- 5.1.3. Opportunities
- 5.1.3.1. Technological advancement in the manufacturing of erectile dysfunction devices
- 5.1.3.2. Increasing preference for personalized treatment options
- 5.1.4. Challenges
- 5.1.4.1. Concerns associated with social stigma associated with erectile dysfunction
- 5.1.1. Drivers
- 5.2. Market Segmentation Analysis
- 5.2.1. Type: Higher preferences for non-invasive shockwave therapy devices
- 5.2.2. Age Group: Growing adoption of low-risk solutions by elderly men aged over 60 years
- 5.2.3. End User: Growing demand for easy-to-use, non-invasive devices from erectile dysfunction treatment clinics
- 5.3. Market Trend Analysis
- 5.4. Cumulative Impact of High Inflation
- 5.5. Porter's Five Forces Analysis
- 5.5.1. Threat of New Entrants
- 5.5.2. Threat of Substitutes
- 5.5.3. Bargaining Power of Customers
- 5.5.4. Bargaining Power of Suppliers
- 5.5.5. Industry Rivalry
- 5.6. Value Chain & Critical Path Analysis
- 5.7. Regulatory Framework
6. Erectile Dysfunction Devices Market, by Type
- 6.1. Introduction
- 6.2. Penile Implants
- 6.3. Shockwave Therapy
- 6.4. Vacuum Constriction Devices
7. Erectile Dysfunction Devices Market, by Age Group
- 7.1. Introduction
- 7.2. 40-60 years
- 7.3. Less than 40 years
- 7.4. More than 60 years
8. Erectile Dysfunction Devices Market, by End User
- 8.1. Introduction
- 8.2. Clinics
- 8.3. Hospitals
9. Americas Erectile Dysfunction Devices Market
- 9.1. Introduction
- 9.2. Argentina
- 9.3. Brazil
- 9.4. Canada
- 9.5. Mexico
- 9.6. United States
10. Asia-Pacific Erectile Dysfunction Devices Market
- 10.1. Introduction
- 10.2. Australia
- 10.3. China
- 10.4. India
- 10.5. Indonesia
- 10.6. Japan
- 10.7. Malaysia
- 10.8. Philippines
- 10.9. Singapore
- 10.10. South Korea
- 10.11. Taiwan
- 10.12. Thailand
- 10.13. Vietnam
11. Europe, Middle East & Africa Erectile Dysfunction Devices Market
- 11.1. Introduction
- 11.2. Denmark
- 11.3. Egypt
- 11.4. Finland
- 11.5. France
- 11.6. Germany
- 11.7. Israel
- 11.8. Italy
- 11.9. Netherlands
- 11.10. Nigeria
- 11.11. Norway
- 11.12. Poland
- 11.13. Qatar
- 11.14. Russia
- 11.15. Saudi Arabia
- 11.16. South Africa
- 11.17. Spain
- 11.18. Sweden
- 11.19. Switzerland
- 11.20. Turkey
- 11.21. United Arab Emirates
- 11.22. United Kingdom
12. Competitive Landscape
- 12.1. FPNV Positioning Matrix
- 12.2. Market Share Analysis, By Key Player
- 12.3. Competitive Scenario Analysis, By Key Player
- 12.3.1. Merger & Acquisition
- 12.3.1.1. Advanced MedTech Acquires China's Market-Leader in Urology
- 12.3.2. New Product Launch & Enhancement
- 12.3.2.1. Ohh-Med Medical Launches Ohh-Med UK to Expand the Worldwide Reach of Vertica, the Company's Home-Use Device for Treating Erectile Dysfunction
- 12.3.1. Merger & Acquisition
13. Competitive Portfolio
- 13.1. Key Company Profiles
- 13.1.1. Advin Health Care
- 13.1.2. Alma Lasers Ltd.
- 13.1.3. Augusta Medical Systems LLC
- 13.1.4. Boston Scientific Corporation
- 13.1.5. Coloplast A/S
- 13.1.6. Comphya SA
- 13.1.7. DirexGroup
- 13.1.8. Futura Medical Developments Limited
- 13.1.9. G.SURGIWEAR LTD.
- 13.1.10. Implantica Management AG
- 13.1.11. Medispec Ltd.
- 13.1.12. OHHMED Medical Ltd.
- 13.1.13. Owen Mumford Limited
- 13.1.14. PROMEDON GmbH
- 13.1.15. Rigicon, Inc.
- 13.1.16. STORZ MEDICAL AG
- 13.1.17. T.E. Inc.
- 13.1.18. TIMM Medical
- 13.1.19. Vacurect
- 13.1.20. Zimmer MedizinSysteme GmbH
- 13.1.21. ZSI Surgical Implants S.R.L.
- 13.2. Key Product Portfolio
14. Appendix
- 14.1. Discussion Guide
- 14.2. License & Pricing
LIST OF FIGURES
- FIGURE 1. ERECTILE DYSFUNCTION DEVICES MARKET RESEARCH PROCESS
- FIGURE 2. ERECTILE DYSFUNCTION DEVICES MARKET SIZE, 2023 VS 2030
- FIGURE 3. ERECTILE DYSFUNCTION DEVICES MARKET SIZE, 2018-2030 (USD MILLION)
- FIGURE 4. ERECTILE DYSFUNCTION DEVICES MARKET SIZE, BY REGION, 2023 VS 2030 (%)
- FIGURE 5. ERECTILE DYSFUNCTION DEVICES MARKET SIZE, BY REGION, 2023 VS 2024 VS 2030 (USD MILLION)
- FIGURE 6. ERECTILE DYSFUNCTION DEVICES MARKET DYNAMICS
- FIGURE 7. ERECTILE DYSFUNCTION DEVICES MARKET SIZE, BY TYPE, 2023 VS 2030 (%)
- FIGURE 8. ERECTILE DYSFUNCTION DEVICES MARKET SIZE, BY TYPE, 2023 VS 2024 VS 2030 (USD MILLION)
- FIGURE 9. ERECTILE DYSFUNCTION DEVICES MARKET SIZE, BY AGE GROUP, 2023 VS 2030 (%)
- FIGURE 10. ERECTILE DYSFUNCTION DEVICES MARKET SIZE, BY AGE GROUP, 2023 VS 2024 VS 2030 (USD MILLION)
- FIGURE 11. ERECTILE DYSFUNCTION DEVICES MARKET SIZE, BY END USER, 2023 VS 2030 (%)
- FIGURE 12. ERECTILE DYSFUNCTION DEVICES MARKET SIZE, BY END USER, 2023 VS 2024 VS 2030 (USD MILLION)
- FIGURE 13. AMERICAS ERECTILE DYSFUNCTION DEVICES MARKET SIZE, BY COUNTRY, 2023 VS 2030 (%)
- FIGURE 14. AMERICAS ERECTILE DYSFUNCTION DEVICES MARKET SIZE, BY COUNTRY, 2023 VS 2024 VS 2030 (USD MILLION)
- FIGURE 15. UNITED STATES ERECTILE DYSFUNCTION DEVICES MARKET SIZE, BY STATE, 2023 VS 2030 (%)
- FIGURE 16. UNITED STATES ERECTILE DYSFUNCTION DEVICES MARKET SIZE, BY STATE, 2023 VS 2024 VS 2030 (USD MILLION)
- FIGURE 17. ASIA-PACIFIC ERECTILE DYSFUNCTION DEVICES MARKET SIZE, BY COUNTRY, 2023 VS 2030 (%)
- FIGURE 18. ASIA-PACIFIC ERECTILE DYSFUNCTION DEVICES MARKET SIZE, BY COUNTRY, 2023 VS 2024 VS 2030 (USD MILLION)
- FIGURE 19. EUROPE, MIDDLE EAST & AFRICA ERECTILE DYSFUNCTION DEVICES MARKET SIZE, BY COUNTRY, 2023 VS 2030 (%)
- FIGURE 20. EUROPE, MIDDLE EAST & AFRICA ERECTILE DYSFUNCTION DEVICES MARKET SIZE, BY COUNTRY, 2023 VS 2024 VS 2030 (USD MILLION)
- FIGURE 21. ERECTILE DYSFUNCTION DEVICES MARKET, FPNV POSITIONING MATRIX, 2023
- FIGURE 22. ERECTILE DYSFUNCTION DEVICES MARKET SHARE, BY KEY PLAYER, 2023
LIST OF TABLES
- TABLE 1. ERECTILE DYSFUNCTION DEVICES MARKET SEGMENTATION & COVERAGE
- TABLE 2. UNITED STATES DOLLAR EXCHANGE RATE, 2018-2023
- TABLE 3. ERECTILE DYSFUNCTION DEVICES MARKET SIZE, 2018-2030 (USD MILLION)
- TABLE 4. GLOBAL ERECTILE DYSFUNCTION DEVICES MARKET SIZE, BY REGION, 2018-2030 (USD MILLION)
- TABLE 5. ERECTILE DYSFUNCTION DEVICES MARKET SIZE, BY TYPE, 2018-2030 (USD MILLION)
- TABLE 6. ERECTILE DYSFUNCTION DEVICES MARKET SIZE, BY PENILE IMPLANTS, BY REGION, 2018-2030 (USD MILLION)
- TABLE 7. ERECTILE DYSFUNCTION DEVICES MARKET SIZE, BY SHOCKWAVE THERAPY, BY REGION, 2018-2030 (USD MILLION)
- TABLE 8. ERECTILE DYSFUNCTION DEVICES MARKET SIZE, BY VACUUM CONSTRICTION DEVICES, BY REGION, 2018-2030 (USD MILLION)
- TABLE 9. ERECTILE DYSFUNCTION DEVICES MARKET SIZE, BY AGE GROUP, 2018-2030 (USD MILLION)
- TABLE 10. ERECTILE DYSFUNCTION DEVICES MARKET SIZE, BY 40-60 YEARS, BY REGION, 2018-2030 (USD MILLION)
- TABLE 11. ERECTILE DYSFUNCTION DEVICES MARKET SIZE, BY LESS THAN 40 YEARS, BY REGION, 2018-2030 (USD MILLION)
- TABLE 12. ERECTILE DYSFUNCTION DEVICES MARKET SIZE, BY MORE THAN 60 YEARS, BY REGION, 2018-2030 (USD MILLION)
- TABLE 13. ERECTILE DYSFUNCTION DEVICES MARKET SIZE, BY END USER, 2018-2030 (USD MILLION)
- TABLE 14. ERECTILE DYSFUNCTION DEVICES MARKET SIZE, BY CLINICS, BY REGION, 2018-2030 (USD MILLION)
- TABLE 15. ERECTILE DYSFUNCTION DEVICES MARKET SIZE, BY HOSPITALS, BY REGION, 2018-2030 (USD MILLION)
- TABLE 16. AMERICAS ERECTILE DYSFUNCTION DEVICES MARKET SIZE, BY TYPE, 2018-2030 (USD MILLION)
- TABLE 17. AMERICAS ERECTILE DYSFUNCTION DEVICES MARKET SIZE, BY AGE GROUP, 2018-2030 (USD MILLION)
- TABLE 18. AMERICAS ERECTILE DYSFUNCTION DEVICES MARKET SIZE, BY END USER, 2018-2030 (USD MILLION)
- TABLE 19. AMERICAS ERECTILE DYSFUNCTION DEVICES MARKET SIZE, BY COUNTRY, 2018-2030 (USD MILLION)
- TABLE 20. ARGENTINA ERECTILE DYSFUNCTION DEVICES MARKET SIZE, BY TYPE, 2018-2030 (USD MILLION)
- TABLE 21. ARGENTINA ERECTILE DYSFUNCTION DEVICES MARKET SIZE, BY AGE GROUP, 2018-2030 (USD MILLION)
- TABLE 22. ARGENTINA ERECTILE DYSFUNCTION DEVICES MARKET SIZE, BY END USER, 2018-2030 (USD MILLION)
- TABLE 23. BRAZIL ERECTILE DYSFUNCTION DEVICES MARKET SIZE, BY TYPE, 2018-2030 (USD MILLION)
- TABLE 24. BRAZIL ERECTILE DYSFUNCTION DEVICES MARKET SIZE, BY AGE GROUP, 2018-2030 (USD MILLION)
- TABLE 25. BRAZIL ERECTILE DYSFUNCTION DEVICES MARKET SIZE, BY END USER, 2018-2030 (USD MILLION)
- TABLE 26. CANADA ERECTILE DYSFUNCTION DEVICES MARKET SIZE, BY TYPE, 2018-2030 (USD MILLION)
- TABLE 27. CANADA ERECTILE DYSFUNCTION DEVICES MARKET SIZE, BY AGE GROUP, 2018-2030 (USD MILLION)
- TABLE 28. CANADA ERECTILE DYSFUNCTION DEVICES MARKET SIZE, BY END USER, 2018-2030 (USD MILLION)
- TABLE 29. MEXICO ERECTILE DYSFUNCTION DEVICES MARKET SIZE, BY TYPE, 2018-2030 (USD MILLION)
- TABLE 30. MEXICO ERECTILE DYSFUNCTION DEVICES MARKET SIZE, BY AGE GROUP, 2018-2030 (USD MILLION)
- TABLE 31. MEXICO ERECTILE DYSFUNCTION DEVICES MARKET SIZE, BY END USER, 2018-2030 (USD MILLION)
- TABLE 32. UNITED STATES ERECTILE DYSFUNCTION DEVICES MARKET SIZE, BY TYPE, 2018-2030 (USD MILLION)
- TABLE 33. UNITED STATES ERECTILE DYSFUNCTION DEVICES MARKET SIZE, BY AGE GROUP, 2018-2030 (USD MILLION)
- TABLE 34. UNITED STATES ERECTILE DYSFUNCTION DEVICES MARKET SIZE, BY END USER, 2018-2030 (USD MILLION)
- TABLE 35. UNITED STATES ERECTILE DYSFUNCTION DEVICES MARKET SIZE, BY STATE, 2018-2030 (USD MILLION)
- TABLE 36. ASIA-PACIFIC ERECTILE DYSFUNCTION DEVICES MARKET SIZE, BY TYPE, 2018-2030 (USD MILLION)
- TABLE 37. ASIA-PACIFIC ERECTILE DYSFUNCTION DEVICES MARKET SIZE, BY AGE GROUP, 2018-2030 (USD MILLION)
- TABLE 38. ASIA-PACIFIC ERECTILE DYSFUNCTION DEVICES MARKET SIZE, BY END USER, 2018-2030 (USD MILLION)
- TABLE 39. ASIA-PACIFIC ERECTILE DYSFUNCTION DEVICES MARKET SIZE, BY COUNTRY, 2018-2030 (USD MILLION)
- TABLE 40. AUSTRALIA ERECTILE DYSFUNCTION DEVICES MARKET SIZE, BY TYPE, 2018-2030 (USD MILLION)
- TABLE 41. AUSTRALIA ERECTILE DYSFUNCTION DEVICES MARKET SIZE, BY AGE GROUP, 2018-2030 (USD MILLION)
- TABLE 42. AUSTRALIA ERECTILE DYSFUNCTION DEVICES MARKET SIZE, BY END USER, 2018-2030 (USD MILLION)
- TABLE 43. CHINA ERECTILE DYSFUNCTION DEVICES MARKET SIZE, BY TYPE, 2018-2030 (USD MILLION)
- TABLE 44. CHINA ERECTILE DYSFUNCTION DEVICES MARKET SIZE, BY AGE GROUP, 2018-2030 (USD MILLION)
- TABLE 45. CHINA ERECTILE DYSFUNCTION DEVICES MARKET SIZE, BY END USER, 2018-2030 (USD MILLION)
- TABLE 46. INDIA ERECTILE DYSFUNCTION DEVICES MARKET SIZE, BY TYPE, 2018-2030 (USD MILLION)
- TABLE 47. INDIA ERECTILE DYSFUNCTION DEVICES MARKET SIZE, BY AGE GROUP, 2018-2030 (USD MILLION)
- TABLE 48. INDIA ERECTILE DYSFUNCTION DEVICES MARKET SIZE, BY END USER, 2018-2030 (USD MILLION)
- TABLE 49. INDONESIA ERECTILE DYSFUNCTION DEVICES MARKET SIZE, BY TYPE, 2018-2030 (USD MILLION)
- TABLE 50. INDONESIA ERECTILE DYSFUNCTION DEVICES MARKET SIZE, BY AGE GROUP, 2018-2030 (USD MILLION)
- TABLE 51. INDONESIA ERECTILE DYSFUNCTION DEVICES MARKET SIZE, BY END USER, 2018-2030 (USD MILLION)
- TABLE 52. JAPAN ERECTILE DYSFUNCTION DEVICES MARKET SIZE, BY TYPE, 2018-2030 (USD MILLION)
- TABLE 53. JAPAN ERECTILE DYSFUNCTION DEVICES MARKET SIZE, BY AGE GROUP, 2018-2030 (USD MILLION)
- TABLE 54. JAPAN ERECTILE DYSFUNCTION DEVICES MARKET SIZE, BY END USER, 2018-2030 (USD MILLION)
- TABLE 55. MALAYSIA ERECTILE DYSFUNCTION DEVICES MARKET SIZE, BY TYPE, 2018-2030 (USD MILLION)
- TABLE 56. MALAYSIA ERECTILE DYSFUNCTION DEVICES MARKET SIZE, BY AGE GROUP, 2018-2030 (USD MILLION)
- TABLE 57. MALAYSIA ERECTILE DYSFUNCTION DEVICES MARKET SIZE, BY END USER, 2018-2030 (USD MILLION)
- TABLE 58. PHILIPPINES ERECTILE DYSFUNCTION DEVICES MARKET SIZE, BY TYPE, 2018-2030 (USD MILLION)
- TABLE 59. PHILIPPINES ERECTILE DYSFUNCTION DEVICES MARKET SIZE, BY AGE GROUP, 2018-2030 (USD MILLION)
- TABLE 60. PHILIPPINES ERECTILE DYSFUNCTION DEVICES MARKET SIZE, BY END USER, 2018-2030 (USD MILLION)
- TABLE 61. SINGAPORE ERECTILE DYSFUNCTION DEVICES MARKET SIZE, BY TYPE, 2018-2030 (USD MILLION)
- TABLE 62. SINGAPORE ERECTILE DYSFUNCTION DEVICES MARKET SIZE, BY AGE GROUP, 2018-2030 (USD MILLION)
- TABLE 63. SINGAPORE ERECTILE DYSFUNCTION DEVICES MARKET SIZE, BY END USER, 2018-2030 (USD MILLION)
- TABLE 64. SOUTH KOREA ERECTILE DYSFUNCTION DEVICES MARKET SIZE, BY TYPE, 2018-2030 (USD MILLION)
- TABLE 65. SOUTH KOREA ERECTILE DYSFUNCTION DEVICES MARKET SIZE, BY AGE GROUP, 2018-2030 (USD MILLION)
- TABLE 66. SOUTH KOREA ERECTILE DYSFUNCTION DEVICES MARKET SIZE, BY END USER, 2018-2030 (USD MILLION)
- TABLE 67. TAIWAN ERECTILE DYSFUNCTION DEVICES MARKET SIZE, BY TYPE, 2018-2030 (USD MILLION)
- TABLE 68. TAIWAN ERECTILE DYSFUNCTION DEVICES MARKET SIZE, BY AGE GROUP, 2018-2030 (USD MILLION)
- TABLE 69. TAIWAN ERECTILE DYSFUNCTION DEVICES MARKET SIZE, BY END USER, 2018-2030 (USD MILLION)
- TABLE 70. THAILAND ERECTILE DYSFUNCTION DEVICES MARKET SIZE, BY TYPE, 2018-2030 (USD MILLION)
- TABLE 71. THAILAND ERECTILE DYSFUNCTION DEVICES MARKET SIZE, BY AGE GROUP, 2018-2030 (USD MILLION)
- TABLE 72. THAILAND ERECTILE DYSFUNCTION DEVICES MARKET SIZE, BY END USER, 2018-2030 (USD MILLION)
- TABLE 73. VIETNAM ERECTILE DYSFUNCTION DEVICES MARKET SIZE, BY TYPE, 2018-2030 (USD MILLION)
- TABLE 74. VIETNAM ERECTILE DYSFUNCTION DEVICES MARKET SIZE, BY AGE GROUP, 2018-2030 (USD MILLION)
- TABLE 75. VIETNAM ERECTILE DYSFUNCTION DEVICES MARKET SIZE, BY END USER, 2018-2030 (USD MILLION)
- TABLE 76. EUROPE, MIDDLE EAST & AFRICA ERECTILE DYSFUNCTION DEVICES MARKET SIZE, BY TYPE, 2018-2030 (USD MILLION)
- TABLE 77. EUROPE, MIDDLE EAST & AFRICA ERECTILE DYSFUNCTION DEVICES MARKET SIZE, BY AGE GROUP, 2018-2030 (USD MILLION)
- TABLE 78. EUROPE, MIDDLE EAST & AFRICA ERECTILE DYSFUNCTION DEVICES MARKET SIZE, BY END USER, 2018-2030 (USD MILLION)
- TABLE 79. EUROPE, MIDDLE EAST & AFRICA ERECTILE DYSFUNCTION DEVICES MARKET SIZE, BY COUNTRY, 2018-2030 (USD MILLION)
- TABLE 80. DENMARK ERECTILE DYSFUNCTION DEVICES MARKET SIZE, BY TYPE, 2018-2030 (USD MILLION)
- TABLE 81. DENMARK ERECTILE DYSFUNCTION DEVICES MARKET SIZE, BY AGE GROUP, 2018-2030 (USD MILLION)
- TABLE 82. DENMARK ERECTILE DYSFUNCTION DEVICES MARKET SIZE, BY END USER, 2018-2030 (USD MILLION)
- TABLE 83. EGYPT ERECTILE DYSFUNCTION DEVICES MARKET SIZE, BY TYPE, 2018-2030 (USD MILLION)
- TABLE 84. EGYPT ERECTILE DYSFUNCTION DEVICES MARKET SIZE, BY AGE GROUP, 2018-2030 (USD MILLION)
- TABLE 85. EGYPT ERECTILE DYSFUNCTION DEVICES MARKET SIZE, BY END USER, 2018-2030 (USD MILLION)
- TABLE 86. FINLAND ERECTILE DYSFUNCTION DEVICES MARKET SIZE, BY TYPE, 2018-2030 (USD MILLION)
- TABLE 87. FINLAND ERECTILE DYSFUNCTION DEVICES MARKET SIZE, BY AGE GROUP, 2018-2030 (USD MILLION)
- TABLE 88. FINLAND ERECTILE DYSFUNCTION DEVICES MARKET SIZE, BY END USER, 2018-2030 (USD MILLION)
- TABLE 89. FRANCE ERECTILE DYSFUNCTION DEVICES MARKET SIZE, BY TYPE, 2018-2030 (USD MILLION)
- TABLE 90. FRANCE ERECTILE DYSFUNCTION DEVICES MARKET SIZE, BY AGE GROUP, 2018-2030 (USD MILLION)
- TABLE 91. FRANCE ERECTILE DYSFUNCTION DEVICES MARKET SIZE, BY END USER, 2018-2030 (USD MILLION)
- TABLE 92. GERMANY ERECTILE DYSFUNCTION DEVICES MARKET SIZE, BY TYPE, 2018-2030 (USD MILLION)
- TABLE 93. GERMANY ERECTILE DYSFUNCTION DEVICES MARKET SIZE, BY AGE GROUP, 2018-2030 (USD MILLION)
- TABLE 94. GERMANY ERECTILE DYSFUNCTION DEVICES MARKET SIZE, BY END USER, 2018-2030 (USD MILLION)
- TABLE 95. ISRAEL ERECTILE DYSFUNCTION DEVICES MARKET SIZE, BY TYPE, 2018-2030 (USD MILLION)
- TABLE 96. ISRAEL ERECTILE DYSFUNCTION DEVICES MARKET SIZE, BY AGE GROUP, 2018-2030 (USD MILLION)
- TABLE 97. ISRAEL ERECTILE DYSFUNCTION DEVICES MARKET SIZE, BY END USER, 2018-2030 (USD MILLION)
- TABLE 98. ITALY ERECTILE DYSFUNCTION DEVICES MARKET SIZE, BY TYPE, 2018-2030 (USD MILLION)
- TABLE 99. ITALY ERECTILE DYSFUNCTION DEVICES MARKET SIZE, BY AGE GROUP, 2018-2030 (USD MILLION)
- TABLE 100. ITALY ERECTILE DYSFUNCTION DEVICES MARKET SIZE, BY END USER, 2018-2030 (USD MILLION)
- TABLE 101. NETHERLANDS ERECTILE DYSFUNCTION DEVICES MARKET SIZE, BY TYPE, 2018-2030 (USD MILLION)
- TABLE 102. NETHERLANDS ERECTILE DYSFUNCTION DEVICES MARKET SIZE, BY AGE GROUP, 2018-2030 (USD MILLION)
- TABLE 103. NETHERLANDS ERECTILE DYSFUNCTION DEVICES MARKET SIZE, BY END USER, 2018-2030 (USD MILLION)
- TABLE 104. NIGERIA ERECTILE DYSFUNCTION DEVICES MARKET SIZE, BY TYPE, 2018-2030 (USD MILLION)
- TABLE 105. NIGERIA ERECTILE DYSFUNCTION DEVICES MARKET SIZE, BY AGE GROUP, 2018-2030 (USD MILLION)
- TABLE 106. NIGERIA ERECTILE DYSFUNCTION DEVICES MARKET SIZE, BY END USER, 2018-2030 (USD MILLION)
- TABLE 107. NORWAY ERECTILE DYSFUNCTION DEVICES MARKET SIZE, BY TYPE, 2018-2030 (USD MILLION)
- TABLE 108. NORWAY ERECTILE DYSFUNCTION DEVICES MARKET SIZE, BY AGE GROUP, 2018-2030 (USD MILLION)
- TABLE 109. NORWAY ERECTILE DYSFUNCTION DEVICES MARKET SIZE, BY END USER, 2018-2030 (USD MILLION)
- TABLE 110. POLAND ERECTILE DYSFUNCTION DEVICES MARKET SIZE, BY TYPE, 2018-2030 (USD MILLION)
- TABLE 111. POLAND ERECTILE DYSFUNCTION DEVICES MARKET SIZE, BY AGE GROUP, 2018-2030 (USD MILLION)
- TABLE 112. POLAND ERECTILE DYSFUNCTION DEVICES MARKET SIZE, BY END USER, 2018-2030 (USD MILLION)
- TABLE 113. QATAR ERECTILE DYSFUNCTION DEVICES MARKET SIZE, BY TYPE, 2018-2030 (USD MILLION)
- TABLE 114. QATAR ERECTILE DYSFUNCTION DEVICES MARKET SIZE, BY AGE GROUP, 2018-2030 (USD MILLION)
- TABLE 115. QATAR ERECTILE DYSFUNCTION DEVICES MARKET SIZE, BY END USER, 2018-2030 (USD MILLION)
- TABLE 116. RUSSIA ERECTILE DYSFUNCTION DEVICES MARKET SIZE, BY TYPE, 2018-2030 (USD MILLION)
- TABLE 117. RUSSIA ERECTILE DYSFUNCTION DEVICES MARKET SIZE, BY AGE GROUP, 2018-2030 (USD MILLION)
- TABLE 118. RUSSIA ERECTILE DYSFUNCTION DEVICES MARKET SIZE, BY END USER, 2018-2030 (USD MILLION)
- TABLE 119. SAUDI ARABIA ERECTILE DYSFUNCTION DEVICES MARKET SIZE, BY TYPE, 2018-2030 (USD MILLION)
- TABLE 120. SAUDI ARABIA ERECTILE DYSFUNCTION DEVICES MARKET SIZE, BY AGE GROUP, 2018-2030 (USD MILLION)
- TABLE 121. SAUDI ARABIA ERECTILE DYSFUNCTION DEVICES MARKET SIZE, BY END USER, 2018-2030 (USD MILLION)
- TABLE 122. SOUTH AFRICA ERECTILE DYSFUNCTION DEVICES MARKET SIZE, BY TYPE, 2018-2030 (USD MILLION)
- TABLE 123. SOUTH AFRICA ERECTILE DYSFUNCTION DEVICES MARKET SIZE, BY AGE GROUP, 2018-2030 (USD MILLION)
- TABLE 124. SOUTH AFRICA ERECTILE DYSFUNCTION DEVICES MARKET SIZE, BY END USER, 2018-2030 (USD MILLION)
- TABLE 125. SPAIN ERECTILE DYSFUNCTION DEVICES MARKET SIZE, BY TYPE, 2018-2030 (USD MILLION)
- TABLE 126. SPAIN ERECTILE DYSFUNCTION DEVICES MARKET SIZE, BY AGE GROUP, 2018-2030 (USD MILLION)
- TABLE 127. SPAIN ERECTILE DYSFUNCTION DEVICES MARKET SIZE, BY END USER, 2018-2030 (USD MILLION)
- TABLE 128. SWEDEN ERECTILE DYSFUNCTION DEVICES MARKET SIZE, BY TYPE, 2018-2030 (USD MILLION)
- TABLE 129. SWEDEN ERECTILE DYSFUNCTION DEVICES MARKET SIZE, BY AGE GROUP, 2018-2030 (USD MILLION)
- TABLE 130. SWEDEN ERECTILE DYSFUNCTION DEVICES MARKET SIZE, BY END USER, 2018-2030 (USD MILLION)
- TABLE 131. SWITZERLAND ERECTILE DYSFUNCTION DEVICES MARKET SIZE, BY TYPE, 2018-2030 (USD MILLION)
- TABLE 132. SWITZERLAND ERECTILE DYSFUNCTION DEVICES MARKET SIZE, BY AGE GROUP, 2018-2030 (USD MILLION)
- TABLE 133. SWITZERLAND ERECTILE DYSFUNCTION DEVICES MARKET SIZE, BY END USER, 2018-2030 (USD MILLION)
- TABLE 134. TURKEY ERECTILE DYSFUNCTION DEVICES MARKET SIZE, BY TYPE, 2018-2030 (USD MILLION)
- TABLE 135. TURKEY ERECTILE DYSFUNCTION DEVICES MARKET SIZE, BY AGE GROUP, 2018-2030 (USD MILLION)
- TABLE 136. TURKEY ERECTILE DYSFUNCTION DEVICES MARKET SIZE, BY END USER, 2018-2030 (USD MILLION)
- TABLE 137. UNITED ARAB EMIRATES ERECTILE DYSFUNCTION DEVICES MARKET SIZE, BY TYPE, 2018-2030 (USD MILLION)
- TABLE 138. UNITED ARAB EMIRATES ERECTILE DYSFUNCTION DEVICES MARKET SIZE, BY AGE GROUP, 2018-2030 (USD MILLION)
- TABLE 139. UNITED ARAB EMIRATES ERECTILE DYSFUNCTION DEVICES MARKET SIZE, BY END USER, 2018-2030 (USD MILLION)
- TABLE 140. UNITED KINGDOM ERECTILE DYSFUNCTION DEVICES MARKET SIZE, BY TYPE, 2018-2030 (USD MILLION)
- TABLE 141. UNITED KINGDOM ERECTILE DYSFUNCTION DEVICES MARKET SIZE, BY AGE GROUP, 2018-2030 (USD MILLION)
- TABLE 142. UNITED KINGDOM ERECTILE DYSFUNCTION DEVICES MARKET SIZE, BY END USER, 2018-2030 (USD MILLION)
- TABLE 143. ERECTILE DYSFUNCTION DEVICES MARKET, FPNV POSITIONING MATRIX, 2023
- TABLE 144. ERECTILE DYSFUNCTION DEVICES MARKET SHARE, BY KEY PLAYER, 2023
- TABLE 145. ERECTILE DYSFUNCTION DEVICES MARKET LICENSE & PRICING
 英国勃起功能障碍市场 - 产业趋势与预测(~2031 年)
 勃起功能障碍治疗的全球市场 - 热门市场(2024-2029)
 勃起功能障碍治疗设备市场 - 2018-2028 年全球产业规模、份额、趋势、机会和预测,按类型、原因、最终用户、地区和竞争细分
 勃起功能障碍治疗药物市场规模、份额、趋势分析报告:按产品、地区和细分市场分類的趋势,2023-2030 年
 勃起功能障碍 (ED) 设备市场:按设备类型、最终用户、地区
 勃起功能障碍药物市场:按药物、给药途径、配销通路和地区
 全球勃起功能障碍药物市场研究报告 - 2023 年至 2030 年产业分析、规模、份额、成长、趋势与预测
 勃起功能障碍设备市场报告:2030 年趋势、预测与竞争分析
 全球勃起功能障碍器械市场:按类型(真空收缩器、阴茎植入物)、原因(血管疾病、神经病变)、最终用户(医院、门诊手术中心)和地区(北美、欧洲、亚洲)预测到 2028 年
 勃起功能障碍设备市场:不同设备类型,各年龄层,各终端用户,各国,各地区- 产业分析,市场规模,市场占有率,2023-2030年预测