


 |
市场调查报告书
商品编码
1415400
酯市场:按类型、应用分类 - 2024-2030 年全球预测Esters Market by Type (Acrylic Esters, Allyl & Aromatic Esters, Cellulose Esters), Application (Automotive & Transportation, Food & Beverages, Packaging) - Global Forecast 2024-2030 |
||||||
※ 本网页内容可能与最新版本有所差异。详细情况请与我们联繫。
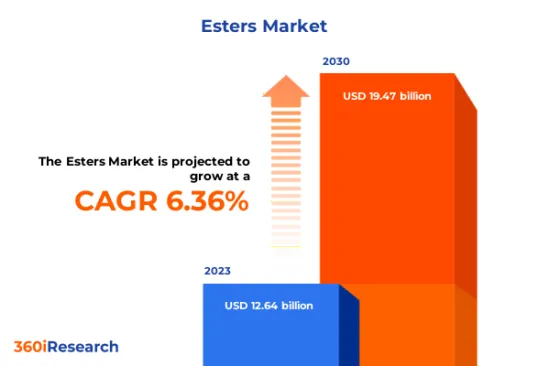
预计2023年酯类市场规模为126.4亿美元,预计2024年将达到133.8亿美元,2030年将达到194.7亿美元,复合年增长率为6.36%。
世界酯市场
| 主要市场统计 | |
|---|---|
| 基准年[2023] | 126.4亿美元 |
| 预测年份 [2024] | 133.8亿美元 |
| 预测年份 [2030] | 194.7亿美元 |
| 复合年增长率(%) | 6.36% |
酯是一类衍生自有机或无机酸的化合物,其中至少一个羟基被烷氧基取代。酯是一种用途广泛的化合物,在软塑胶塑化剂、合成机器润滑剂、油漆和涂料溶剂以及食品和香水工业中用作香料。在製药领域,酯对于各种药物和製剂至关重要。酯的独特性质,例如低极性、在有机溶剂中的溶解度以及形成氢键的能力,使它们适合许多最终用途。然而,主要原材料价格的波动或供应中断可能会对我们产品的可得性产生不利影响。此外,出于环境问题对某些酯的使用进行监管限制是其在各种最终用途行业中采用的主要障碍。然而,对环保和永续材料的需求为生物基酯的发展提供了机会。此外,使用酯开拓新应用的潜力,例如生质塑胶和可再生能源领域,特别是太阳能板製造和风力发电机,正在扩大酯市场的范围。塑胶化学回收技术的进步预计将为酯在循环经济中的应用创造新的机会。
区域洞察
在汽车、航太和製药等强劲工业部门的推动下,美洲在酯类市场中占了很大份额。该地区消费者的需求主要是品质和永续性,并且偏好生物基酯。最近整个美洲的研发投资表明,人们正在共同努力生产传统石化衍生酯的环保替代品。在欧洲,酯市场受到严格的环境和安全标准的严格监管。欧盟国家越来越注重永续性,欧盟委员会正在鼓励环保酯的开发和使用。在中东,石化公司正在投资酯类生产,以摆脱传统的石油产品。亚太地区拥有庞大的製造能力和庞大的消费群,其特点是具有竞争力的价格和高创新率,并为酯生产技术的进步申请了多项新专利。纺织和製药等行业工业活动的增加、对可负担性的关注和产品范围的多样化预计将刺激酯行业的国内生产和创新。
FPNV定位矩阵
FPNV定位矩阵对于评估酯类市场至关重要。我们检视与业务策略和产品满意度相关的关键指标,以对供应商进行全面评估。这种深入的分析使用户能够根据自己的要求做出明智的决策。根据评估,供应商被分为四个成功程度不同的像限:前沿(F)、探路者(P)、利基(N)和重要(V)。
市场占有率分析
市场占有率分析是一种综合工具,可以对酯市场供应商的现状进行深入而详细的研究。全面比较和分析供应商在整体收益、基本客群和其他关键指标方面的贡献,以便更好地了解公司的绩效及其在争夺市场占有率时面临的挑战。此外,该分析还提供了对该行业竞争特征的宝贵考察,包括在研究基准年观察到的累积、分散主导地位和合併特征等因素。这种详细程度的提高使供应商能够做出更明智的决策并制定有效的策略,从而在市场上获得竞争优势。
该报告对以下几个方面提供了宝贵的见解:
1-市场渗透率:提供有关主要企业所服务的市场的全面资讯。
2-市场开拓:我们深入研究利润丰厚的新兴市场,并分析它们在成熟细分市场中的渗透率。
3- 市场多元化:提供有关新产品发布、开拓地区、最新发展和投资的详细资讯。
4-竞争力评估与资讯:对主要企业的市场占有率、策略、产品、认证、监管状况、专利状况、製造能力等进行全面评估。
5- 产品开发与创新:提供对未来技术、研发活动和突破性产品开发的见解。
本报告解决了以下关键问题:
1-酯市场的市场规模和预测是多少?
在 2-酯市场预测期内,有哪些产品、细分市场、应用和领域需要考虑投资?
3-酯类市场的技术趋势和法律规范是什么?
4-酯市场主要厂商的市场占有率是多少?
5-进入酯类市场的合适型态或策略手段是什么?
目录
第一章 前言
第二章调查方法
第三章执行摘要
第四章市场概况
第五章市场洞察
- 市场动态
- 促进因素
- 化妆品和个人护理行业对酯的需求不断增加
- 製药和食品加工行业的采用
- 抑制因素
- 酯的生产成本较高。
- 机会
- 继续向天然和有机产品过渡
- 生物基酯的开发
- 任务
- 与酯接触相关的不良健康影响
- 促进因素
- 市场区隔分析
- 类型:在不同的最终用途领域越来越多地采用脂肪酸酯
- 应用:药品生产过程中酯类的高渗透
- 市场趋势分析
- 高通膨的累积效应
- 波特五力分析
- 价值炼和关键路径分析
- 法律规范
第六章酯类市场:依类型
- 丙烯酸酯
- 烯丙基酯和芳香酯
- 纤维素酯
- 脂肪酯
- 磷酸酯
第七章酯类市场:依应用分类
- 汽车和交通
- 食品与饮品
- 包装
- 油漆和涂料
- 个人护理
- 药品
- 界面活性剂和清洁剂
第八章 美洲酯类市场
- 阿根廷
- 巴西
- 加拿大
- 墨西哥
- 美国
第九章亚太地区酯类市场
- 澳洲
- 中国
- 印度
- 印尼
- 日本
- 马来西亚
- 菲律宾
- 新加坡
- 韩国
- 台湾
- 泰国
- 越南
第十章欧洲、中东和非洲酯类市场
- 丹麦
- 埃及
- 芬兰
- 法国
- 德国
- 以色列
- 义大利
- 荷兰
- 奈及利亚
- 挪威
- 波兰
- 卡达
- 俄罗斯
- 沙乌地阿拉伯
- 南非
- 西班牙
- 瑞典
- 瑞士
- 土耳其
- 阿拉伯聯合大公国
- 英国
第十一章竞争形势
- FPNV定位矩阵
- 市场占有率分析:主要企业
- 主要企业竞争情境分析
- 奖项/奖励/扩展
第12章竞争产品组合
- 主要公司简介
- ABITEC Corporation
- Archer-Daniels-Midland Company
- Arkema SA
- BASF SE
- Berg+Schmidt GmbH & Co. KG
- Biotage
- Cargill, Incorporated
- CEM Corporation
- Chemra GmbH
- Croda International PLC
- DuPont de Nemours, Inc.
- eChem Ltd.
- Gattefosse
- Interfat SAU
- Koninklijke DSM NV
- Lipotype GmbH
- Merck KGaA
- Solvay SA
- Stepan Company
- Subhash Chemical Industries Private Ltd.
- Sumitomo Chemical Co., Ltd.
- The Dow Chemical Company
- The Procter & Gamble Company
- Thermo Fisher Scientific Inc.
- Tokyo Chemical Industry Co., Ltd.
- 主要产品系列
第十三章附录
- 讨论指南
- 关于许可证和定价
[197 Pages Report] The Esters Market size was estimated at USD 12.64 billion in 2023 and expected to reach USD 13.38 billion in 2024, at a CAGR 6.36% to reach USD 19.47 billion by 2030.
Global Esters Market
| KEY MARKET STATISTICS | |
|---|---|
| Base Year [2023] | USD 12.64 billion |
| Estimated Year [2024] | USD 13.38 billion |
| Forecast Year [2030] | USD 19.47 billion |
| CAGR (%) | 6.36% |
Esters are a class of chemical compounds derived from an organic or inorganic acid in which an alkoxy group replaces at least one hydroxyl group. Esters are versatile compounds used as plasticizers in manufacturing flexible plastics, synthetic machinery lubricants, paints, coatings solvents, and flavoring and fragrance agents in the food and perfume industries. In the pharmaceutical sector, esters are integral to various drugs and medicinal preparations. The unique properties of esters, such as low polarity, solubility in organic solvents, and capacity to form hydrogen bonds, make them suitable for numerous end-use applications. However, volatility in primary material prices and supply disruptions can adversely affect product availability. In addition, regulatory constraints regarding using certain types of esters due to environmental concerns pose significant hurdles to adopting esters across diverse end-use industries. Nevertheless, the demand for eco-friendly and sustainable materials has led to the opportunity for the development of bio-based esters. Moreover, the potential of using esters in exploring new application areas such as bioplastics and renewable energy sectors, particularly in solar panel manufacturing and wind turbines, has expanded the scope of the esters market. Advancements in chemical recycling technologies for plastics are slated to create new opportunities for ester applications in the circular economy.
Regional Insights
The Americas holds a significant share in the esters market, driven by robust industrial sectors such as automotive, aerospace, and pharmaceuticals. Consumer needs in the region primarily revolve around quality and sustainability, with trends showing growth in the preference for bio-based esters. Recent investments in research and development across the Americas indicate a concerted effort to produce eco-friendly alternatives to traditional petrochemical-derived esters. In Europe, the esters market is highly regulated with stringent environmental and safety standards. The EU countries are progressively leaning towards sustainability, with the European Commission incentivizing developing and using environmentally friendly esters. In the Middle East, petrochemical companies are investing in the production of esters as a way to diversify from traditional petroleum products. The Asia Pacific region has significant manufacturing capacities and a large consumer base characterized by competitive pricing and a high rate of innovation, with several new patents filed for advancements in ester production technologies. Increased industrial activities in sectors such as textiles and pharmaceuticals and the focus on affordability and the diversification of the product range are expected to spur domestic production and innovation in the field of esters.
FPNV Positioning Matrix
The FPNV Positioning Matrix is pivotal in evaluating the Esters Market. It offers a comprehensive assessment of vendors, examining key metrics related to Business Strategy and Product Satisfaction. This in-depth analysis empowers users to make well-informed decisions aligned with their requirements. Based on the evaluation, the vendors are then categorized into four distinct quadrants representing varying levels of success: Forefront (F), Pathfinder (P), Niche (N), or Vital (V).
Market Share Analysis
The Market Share Analysis is a comprehensive tool that provides an insightful and in-depth examination of the current state of vendors in the Esters Market. By meticulously comparing and analyzing vendor contributions in terms of overall revenue, customer base, and other key metrics, we can offer companies a greater understanding of their performance and the challenges they face when competing for market share. Additionally, this analysis provides valuable insights into the competitive nature of the sector, including factors such as accumulation, fragmentation dominance, and amalgamation traits observed over the base year period studied. With this expanded level of detail, vendors can make more informed decisions and devise effective strategies to gain a competitive edge in the market.
Key Company Profiles
The report delves into recent significant developments in the Esters Market, highlighting leading vendors and their innovative profiles. These include ABITEC Corporation, Archer-Daniels-Midland Company, Arkema S.A., BASF SE, Berg + Schmidt GmbH & Co. KG, Biotage, Cargill, Incorporated, CEM Corporation, Chemra GmbH, Croda International PLC, DuPont de Nemours, Inc., eChem Ltd., Gattefosse, Interfat SAU, Koninklijke DSM N.V., Lipotype GmbH, Merck KGaA, Solvay S.A., Stepan Company, Subhash Chemical Industries Private Ltd., Sumitomo Chemical Co., Ltd., The Dow Chemical Company, The Procter & Gamble Company, Thermo Fisher Scientific Inc., and Tokyo Chemical Industry Co., Ltd..
Market Segmentation & Coverage
This research report categorizes the Esters Market to forecast the revenues and analyze trends in each of the following sub-markets:
- Type
- Acrylic Esters
- Allyl & Aromatic Esters
- Cellulose Esters
- Fatty Esters
- Phosphate Esters
- Application
- Automotive & Transportation
- Food & Beverages
- Packaging
- Paints & Coatings
- Personal Care
- Pharmaceuticals
- Surfactants & Detergents
- Region
- Americas
- Argentina
- Brazil
- Canada
- Mexico
- United States
- California
- Florida
- Illinois
- New York
- Ohio
- Pennsylvania
- Texas
- Asia-Pacific
- Australia
- China
- India
- Indonesia
- Japan
- Malaysia
- Philippines
- Singapore
- South Korea
- Taiwan
- Thailand
- Vietnam
- Europe, Middle East & Africa
- Denmark
- Egypt
- Finland
- France
- Germany
- Israel
- Italy
- Netherlands
- Nigeria
- Norway
- Poland
- Qatar
- Russia
- Saudi Arabia
- South Africa
- Spain
- Sweden
- Switzerland
- Turkey
- United Arab Emirates
- United Kingdom
- Americas
The report offers valuable insights on the following aspects:
1. Market Penetration: It presents comprehensive information on the market provided by key players.
2. Market Development: It delves deep into lucrative emerging markets and analyzes the penetration across mature market segments.
3. Market Diversification: It provides detailed information on new product launches, untapped geographic regions, recent developments, and investments.
4. Competitive Assessment & Intelligence: It conducts an exhaustive assessment of market shares, strategies, products, certifications, regulatory approvals, patent landscape, and manufacturing capabilities of the leading players.
5. Product Development & Innovation: It offers intelligent insights on future technologies, R&D activities, and breakthrough product developments.
The report addresses key questions such as:
1. What is the market size and forecast of the Esters Market?
2. Which products, segments, applications, and areas should one consider investing in over the forecast period in the Esters Market?
3. What are the technology trends and regulatory frameworks in the Esters Market?
4. What is the market share of the leading vendors in the Esters Market?
5. Which modes and strategic moves are suitable for entering the Esters Market?
Table of Contents
1. Preface
- 1.1. Objectives of the Study
- 1.2. Market Segmentation & Coverage
- 1.3. Years Considered for the Study
- 1.4. Currency & Pricing
- 1.5. Language
- 1.6. Limitations
- 1.7. Assumptions
- 1.8. Stakeholders
2. Research Methodology
- 2.1. Define: Research Objective
- 2.2. Determine: Research Design
- 2.3. Prepare: Research Instrument
- 2.4. Collect: Data Source
- 2.5. Analyze: Data Interpretation
- 2.6. Formulate: Data Verification
- 2.7. Publish: Research Report
- 2.8. Repeat: Report Update
3. Executive Summary
4. Market Overview
- 4.1. Introduction
- 4.2. Esters Market, by Region
5. Market Insights
- 5.1. Market Dynamics
- 5.1.1. Drivers
- 5.1.1.1. Increasing demand for esters from cosmetic and personal care industries
- 5.1.1.2. Adoption across pharmaceutical and food processing sector
- 5.1.2. Restraints
- 5.1.2.1. High cost of production of esters
- 5.1.3. Opportunities
- 5.1.3.1. Ongoing shift toward natural and organic products
- 5.1.3.2. Development of bio-based esters
- 5.1.4. Challenges
- 5.1.4.1. Adverse health effects associated with exposure of esters
- 5.1.1. Drivers
- 5.2. Market Segmentation Analysis
- 5.2.1. Type: Increasing adoption of fatty esters across diverse end-use sectors
- 5.2.2. Application: High penetration of esters in pharmaceutical manufacturing procedures
- 5.3. Market Trend Analysis
- 5.4. Cumulative Impact of High Inflation
- 5.5. Porter's Five Forces Analysis
- 5.5.1. Threat of New Entrants
- 5.5.2. Threat of Substitutes
- 5.5.3. Bargaining Power of Customers
- 5.5.4. Bargaining Power of Suppliers
- 5.5.5. Industry Rivalry
- 5.6. Value Chain & Critical Path Analysis
- 5.7. Regulatory Framework
6. Esters Market, by Type
- 6.1. Introduction
- 6.2. Acrylic Esters
- 6.3. Allyl & Aromatic Esters
- 6.4. Cellulose Esters
- 6.5. Fatty Esters
- 6.6. Phosphate Esters
7. Esters Market, by Application
- 7.1. Introduction
- 7.2. Automotive & Transportation
- 7.3. Food & Beverages
- 7.4. Packaging
- 7.5. Paints & Coatings
- 7.6. Personal Care
- 7.7. Pharmaceuticals
- 7.8. Surfactants & Detergents
8. Americas Esters Market
- 8.1. Introduction
- 8.2. Argentina
- 8.3. Brazil
- 8.4. Canada
- 8.5. Mexico
- 8.6. United States
9. Asia-Pacific Esters Market
- 9.1. Introduction
- 9.2. Australia
- 9.3. China
- 9.4. India
- 9.5. Indonesia
- 9.6. Japan
- 9.7. Malaysia
- 9.8. Philippines
- 9.9. Singapore
- 9.10. South Korea
- 9.11. Taiwan
- 9.12. Thailand
- 9.13. Vietnam
10. Europe, Middle East & Africa Esters Market
- 10.1. Introduction
- 10.2. Denmark
- 10.3. Egypt
- 10.4. Finland
- 10.5. France
- 10.6. Germany
- 10.7. Israel
- 10.8. Italy
- 10.9. Netherlands
- 10.10. Nigeria
- 10.11. Norway
- 10.12. Poland
- 10.13. Qatar
- 10.14. Russia
- 10.15. Saudi Arabia
- 10.16. South Africa
- 10.17. Spain
- 10.18. Sweden
- 10.19. Switzerland
- 10.20. Turkey
- 10.21. United Arab Emirates
- 10.22. United Kingdom
11. Competitive Landscape
- 11.1. FPNV Positioning Matrix
- 11.2. Market Share Analysis, By Key Player
- 11.3. Competitive Scenario Analysis, By Key Player
- 11.3.1. Award, Recognition, & Expansion
- 11.3.1.1. OQ Chemicals Launches New Pilot Plant for Customized Esters
- 11.3.1.2. Petron Secures Regulatory Approval for Coconut Methyl Ester Plant in Philippines
- 11.3.1.3. Ester Industries Unit Begins Production at New Polyester Film Plant in Telangana
- 11.3.1. Award, Recognition, & Expansion
12. Competitive Portfolio
- 12.1. Key Company Profiles
- 12.1.1. ABITEC Corporation
- 12.1.2. Archer-Daniels-Midland Company
- 12.1.3. Arkema S.A.
- 12.1.4. BASF SE
- 12.1.5. Berg + Schmidt GmbH & Co. KG
- 12.1.6. Biotage
- 12.1.7. Cargill, Incorporated
- 12.1.8. CEM Corporation
- 12.1.9. Chemra GmbH
- 12.1.10. Croda International PLC
- 12.1.11. DuPont de Nemours, Inc.
- 12.1.12. eChem Ltd.
- 12.1.13. Gattefosse
- 12.1.14. Interfat SAU
- 12.1.15. Koninklijke DSM N.V.
- 12.1.16. Lipotype GmbH
- 12.1.17. Merck KGaA
- 12.1.18. Solvay S.A.
- 12.1.19. Stepan Company
- 12.1.20. Subhash Chemical Industries Private Ltd.
- 12.1.21. Sumitomo Chemical Co., Ltd.
- 12.1.22. The Dow Chemical Company
- 12.1.23. The Procter & Gamble Company
- 12.1.24. Thermo Fisher Scientific Inc.
- 12.1.25. Tokyo Chemical Industry Co., Ltd.
- 12.2. Key Product Portfolio
13. Appendix
- 13.1. Discussion Guide
- 13.2. License & Pricing
LIST OF FIGURES
- FIGURE 1. ESTERS MARKET RESEARCH PROCESS
- FIGURE 2. ESTERS MARKET SIZE, 2023 VS 2030
- FIGURE 3. ESTERS MARKET SIZE, 2018-2030 (USD MILLION)
- FIGURE 4. ESTERS MARKET SIZE, BY REGION, 2023 VS 2030 (%)
- FIGURE 5. ESTERS MARKET SIZE, BY REGION, 2023 VS 2024 VS 2030 (USD MILLION)
- FIGURE 6. ESTERS MARKET DYNAMICS
- FIGURE 7. ESTERS MARKET SIZE, BY TYPE, 2023 VS 2030 (%)
- FIGURE 8. ESTERS MARKET SIZE, BY TYPE, 2023 VS 2024 VS 2030 (USD MILLION)
- FIGURE 9. ESTERS MARKET SIZE, BY APPLICATION, 2023 VS 2030 (%)
- FIGURE 10. ESTERS MARKET SIZE, BY APPLICATION, 2023 VS 2024 VS 2030 (USD MILLION)
- FIGURE 11. AMERICAS ESTERS MARKET SIZE, BY COUNTRY, 2023 VS 2030 (%)
- FIGURE 12. AMERICAS ESTERS MARKET SIZE, BY COUNTRY, 2023 VS 2024 VS 2030 (USD MILLION)
- FIGURE 13. UNITED STATES ESTERS MARKET SIZE, BY STATE, 2023 VS 2030 (%)
- FIGURE 14. UNITED STATES ESTERS MARKET SIZE, BY STATE, 2023 VS 2024 VS 2030 (USD MILLION)
- FIGURE 15. ASIA-PACIFIC ESTERS MARKET SIZE, BY COUNTRY, 2023 VS 2030 (%)
- FIGURE 16. ASIA-PACIFIC ESTERS MARKET SIZE, BY COUNTRY, 2023 VS 2024 VS 2030 (USD MILLION)
- FIGURE 17. EUROPE, MIDDLE EAST & AFRICA ESTERS MARKET SIZE, BY COUNTRY, 2023 VS 2030 (%)
- FIGURE 18. EUROPE, MIDDLE EAST & AFRICA ESTERS MARKET SIZE, BY COUNTRY, 2023 VS 2024 VS 2030 (USD MILLION)
- FIGURE 19. ESTERS MARKET, FPNV POSITIONING MATRIX, 2023
- FIGURE 20. ESTERS MARKET SHARE, BY KEY PLAYER, 2023
LIST OF TABLES
- TABLE 1. ESTERS MARKET SEGMENTATION & COVERAGE
- TABLE 2. UNITED STATES DOLLAR EXCHANGE RATE, 2018-2023
- TABLE 3. ESTERS MARKET SIZE, 2018-2030 (USD MILLION)
- TABLE 4. GLOBAL ESTERS MARKET SIZE, BY REGION, 2018-2030 (USD MILLION)
- TABLE 5. ESTERS MARKET SIZE, BY TYPE, 2018-2030 (USD MILLION)
- TABLE 6. ESTERS MARKET SIZE, BY ACRYLIC ESTERS, BY REGION, 2018-2030 (USD MILLION)
- TABLE 7. ESTERS MARKET SIZE, BY ALLYL & AROMATIC ESTERS, BY REGION, 2018-2030 (USD MILLION)
- TABLE 8. ESTERS MARKET SIZE, BY CELLULOSE ESTERS, BY REGION, 2018-2030 (USD MILLION)
- TABLE 9. ESTERS MARKET SIZE, BY FATTY ESTERS, BY REGION, 2018-2030 (USD MILLION)
- TABLE 10. ESTERS MARKET SIZE, BY PHOSPHATE ESTERS, BY REGION, 2018-2030 (USD MILLION)
- TABLE 11. ESTERS MARKET SIZE, BY APPLICATION, 2018-2030 (USD MILLION)
- TABLE 12. ESTERS MARKET SIZE, BY AUTOMOTIVE & TRANSPORTATION, BY REGION, 2018-2030 (USD MILLION)
- TABLE 13. ESTERS MARKET SIZE, BY FOOD & BEVERAGES, BY REGION, 2018-2030 (USD MILLION)
- TABLE 14. ESTERS MARKET SIZE, BY PACKAGING, BY REGION, 2018-2030 (USD MILLION)
- TABLE 15. ESTERS MARKET SIZE, BY PAINTS & COATINGS, BY REGION, 2018-2030 (USD MILLION)
- TABLE 16. ESTERS MARKET SIZE, BY PERSONAL CARE, BY REGION, 2018-2030 (USD MILLION)
- TABLE 17. ESTERS MARKET SIZE, BY PHARMACEUTICALS, BY REGION, 2018-2030 (USD MILLION)
- TABLE 18. ESTERS MARKET SIZE, BY SURFACTANTS & DETERGENTS, BY REGION, 2018-2030 (USD MILLION)
- TABLE 19. AMERICAS ESTERS MARKET SIZE, BY TYPE, 2018-2030 (USD MILLION)
- TABLE 20. AMERICAS ESTERS MARKET SIZE, BY APPLICATION, 2018-2030 (USD MILLION)
- TABLE 21. AMERICAS ESTERS MARKET SIZE, BY COUNTRY, 2018-2030 (USD MILLION)
- TABLE 22. ARGENTINA ESTERS MARKET SIZE, BY TYPE, 2018-2030 (USD MILLION)
- TABLE 23. ARGENTINA ESTERS MARKET SIZE, BY APPLICATION, 2018-2030 (USD MILLION)
- TABLE 24. BRAZIL ESTERS MARKET SIZE, BY TYPE, 2018-2030 (USD MILLION)
- TABLE 25. BRAZIL ESTERS MARKET SIZE, BY APPLICATION, 2018-2030 (USD MILLION)
- TABLE 26. CANADA ESTERS MARKET SIZE, BY TYPE, 2018-2030 (USD MILLION)
- TABLE 27. CANADA ESTERS MARKET SIZE, BY APPLICATION, 2018-2030 (USD MILLION)
- TABLE 28. MEXICO ESTERS MARKET SIZE, BY TYPE, 2018-2030 (USD MILLION)
- TABLE 29. MEXICO ESTERS MARKET SIZE, BY APPLICATION, 2018-2030 (USD MILLION)
- TABLE 30. UNITED STATES ESTERS MARKET SIZE, BY TYPE, 2018-2030 (USD MILLION)
- TABLE 31. UNITED STATES ESTERS MARKET SIZE, BY APPLICATION, 2018-2030 (USD MILLION)
- TABLE 32. UNITED STATES ESTERS MARKET SIZE, BY STATE, 2018-2030 (USD MILLION)
- TABLE 33. ASIA-PACIFIC ESTERS MARKET SIZE, BY TYPE, 2018-2030 (USD MILLION)
- TABLE 34. ASIA-PACIFIC ESTERS MARKET SIZE, BY APPLICATION, 2018-2030 (USD MILLION)
- TABLE 35. ASIA-PACIFIC ESTERS MARKET SIZE, BY COUNTRY, 2018-2030 (USD MILLION)
- TABLE 36. AUSTRALIA ESTERS MARKET SIZE, BY TYPE, 2018-2030 (USD MILLION)
- TABLE 37. AUSTRALIA ESTERS MARKET SIZE, BY APPLICATION, 2018-2030 (USD MILLION)
- TABLE 38. CHINA ESTERS MARKET SIZE, BY TYPE, 2018-2030 (USD MILLION)
- TABLE 39. CHINA ESTERS MARKET SIZE, BY APPLICATION, 2018-2030 (USD MILLION)
- TABLE 40. INDIA ESTERS MARKET SIZE, BY TYPE, 2018-2030 (USD MILLION)
- TABLE 41. INDIA ESTERS MARKET SIZE, BY APPLICATION, 2018-2030 (USD MILLION)
- TABLE 42. INDONESIA ESTERS MARKET SIZE, BY TYPE, 2018-2030 (USD MILLION)
- TABLE 43. INDONESIA ESTERS MARKET SIZE, BY APPLICATION, 2018-2030 (USD MILLION)
- TABLE 44. JAPAN ESTERS MARKET SIZE, BY TYPE, 2018-2030 (USD MILLION)
- TABLE 45. JAPAN ESTERS MARKET SIZE, BY APPLICATION, 2018-2030 (USD MILLION)
- TABLE 46. MALAYSIA ESTERS MARKET SIZE, BY TYPE, 2018-2030 (USD MILLION)
- TABLE 47. MALAYSIA ESTERS MARKET SIZE, BY APPLICATION, 2018-2030 (USD MILLION)
- TABLE 48. PHILIPPINES ESTERS MARKET SIZE, BY TYPE, 2018-2030 (USD MILLION)
- TABLE 49. PHILIPPINES ESTERS MARKET SIZE, BY APPLICATION, 2018-2030 (USD MILLION)
- TABLE 50. SINGAPORE ESTERS MARKET SIZE, BY TYPE, 2018-2030 (USD MILLION)
- TABLE 51. SINGAPORE ESTERS MARKET SIZE, BY APPLICATION, 2018-2030 (USD MILLION)
- TABLE 52. SOUTH KOREA ESTERS MARKET SIZE, BY TYPE, 2018-2030 (USD MILLION)
- TABLE 53. SOUTH KOREA ESTERS MARKET SIZE, BY APPLICATION, 2018-2030 (USD MILLION)
- TABLE 54. TAIWAN ESTERS MARKET SIZE, BY TYPE, 2018-2030 (USD MILLION)
- TABLE 55. TAIWAN ESTERS MARKET SIZE, BY APPLICATION, 2018-2030 (USD MILLION)
- TABLE 56. THAILAND ESTERS MARKET SIZE, BY TYPE, 2018-2030 (USD MILLION)
- TABLE 57. THAILAND ESTERS MARKET SIZE, BY APPLICATION, 2018-2030 (USD MILLION)
- TABLE 58. VIETNAM ESTERS MARKET SIZE, BY TYPE, 2018-2030 (USD MILLION)
- TABLE 59. VIETNAM ESTERS MARKET SIZE, BY APPLICATION, 2018-2030 (USD MILLION)
- TABLE 60. EUROPE, MIDDLE EAST & AFRICA ESTERS MARKET SIZE, BY TYPE, 2018-2030 (USD MILLION)
- TABLE 61. EUROPE, MIDDLE EAST & AFRICA ESTERS MARKET SIZE, BY APPLICATION, 2018-2030 (USD MILLION)
- TABLE 62. EUROPE, MIDDLE EAST & AFRICA ESTERS MARKET SIZE, BY COUNTRY, 2018-2030 (USD MILLION)
- TABLE 63. DENMARK ESTERS MARKET SIZE, BY TYPE, 2018-2030 (USD MILLION)
- TABLE 64. DENMARK ESTERS MARKET SIZE, BY APPLICATION, 2018-2030 (USD MILLION)
- TABLE 65. EGYPT ESTERS MARKET SIZE, BY TYPE, 2018-2030 (USD MILLION)
- TABLE 66. EGYPT ESTERS MARKET SIZE, BY APPLICATION, 2018-2030 (USD MILLION)
- TABLE 67. FINLAND ESTERS MARKET SIZE, BY TYPE, 2018-2030 (USD MILLION)
- TABLE 68. FINLAND ESTERS MARKET SIZE, BY APPLICATION, 2018-2030 (USD MILLION)
- TABLE 69. FRANCE ESTERS MARKET SIZE, BY TYPE, 2018-2030 (USD MILLION)
- TABLE 70. FRANCE ESTERS MARKET SIZE, BY APPLICATION, 2018-2030 (USD MILLION)
- TABLE 71. GERMANY ESTERS MARKET SIZE, BY TYPE, 2018-2030 (USD MILLION)
- TABLE 72. GERMANY ESTERS MARKET SIZE, BY APPLICATION, 2018-2030 (USD MILLION)
- TABLE 73. ISRAEL ESTERS MARKET SIZE, BY TYPE, 2018-2030 (USD MILLION)
- TABLE 74. ISRAEL ESTERS MARKET SIZE, BY APPLICATION, 2018-2030 (USD MILLION)
- TABLE 75. ITALY ESTERS MARKET SIZE, BY TYPE, 2018-2030 (USD MILLION)
- TABLE 76. ITALY ESTERS MARKET SIZE, BY APPLICATION, 2018-2030 (USD MILLION)
- TABLE 77. NETHERLANDS ESTERS MARKET SIZE, BY TYPE, 2018-2030 (USD MILLION)
- TABLE 78. NETHERLANDS ESTERS MARKET SIZE, BY APPLICATION, 2018-2030 (USD MILLION)
- TABLE 79. NIGERIA ESTERS MARKET SIZE, BY TYPE, 2018-2030 (USD MILLION)
- TABLE 80. NIGERIA ESTERS MARKET SIZE, BY APPLICATION, 2018-2030 (USD MILLION)
- TABLE 81. NORWAY ESTERS MARKET SIZE, BY TYPE, 2018-2030 (USD MILLION)
- TABLE 82. NORWAY ESTERS MARKET SIZE, BY APPLICATION, 2018-2030 (USD MILLION)
- TABLE 83. POLAND ESTERS MARKET SIZE, BY TYPE, 2018-2030 (USD MILLION)
- TABLE 84. POLAND ESTERS MARKET SIZE, BY APPLICATION, 2018-2030 (USD MILLION)
- TABLE 85. QATAR ESTERS MARKET SIZE, BY TYPE, 2018-2030 (USD MILLION)
- TABLE 86. QATAR ESTERS MARKET SIZE, BY APPLICATION, 2018-2030 (USD MILLION)
- TABLE 87. RUSSIA ESTERS MARKET SIZE, BY TYPE, 2018-2030 (USD MILLION)
- TABLE 88. RUSSIA ESTERS MARKET SIZE, BY APPLICATION, 2018-2030 (USD MILLION)
- TABLE 89. SAUDI ARABIA ESTERS MARKET SIZE, BY TYPE, 2018-2030 (USD MILLION)
- TABLE 90. SAUDI ARABIA ESTERS MARKET SIZE, BY APPLICATION, 2018-2030 (USD MILLION)
- TABLE 91. SOUTH AFRICA ESTERS MARKET SIZE, BY TYPE, 2018-2030 (USD MILLION)
- TABLE 92. SOUTH AFRICA ESTERS MARKET SIZE, BY APPLICATION, 2018-2030 (USD MILLION)
- TABLE 93. SPAIN ESTERS MARKET SIZE, BY TYPE, 2018-2030 (USD MILLION)
- TABLE 94. SPAIN ESTERS MARKET SIZE, BY APPLICATION, 2018-2030 (USD MILLION)
- TABLE 95. SWEDEN ESTERS MARKET SIZE, BY TYPE, 2018-2030 (USD MILLION)
- TABLE 96. SWEDEN ESTERS MARKET SIZE, BY APPLICATION, 2018-2030 (USD MILLION)
- TABLE 97. SWITZERLAND ESTERS MARKET SIZE, BY TYPE, 2018-2030 (USD MILLION)
- TABLE 98. SWITZERLAND ESTERS MARKET SIZE, BY APPLICATION, 2018-2030 (USD MILLION)
- TABLE 99. TURKEY ESTERS MARKET SIZE, BY TYPE, 2018-2030 (USD MILLION)
- TABLE 100. TURKEY ESTERS MARKET SIZE, BY APPLICATION, 2018-2030 (USD MILLION)
- TABLE 101. UNITED ARAB EMIRATES ESTERS MARKET SIZE, BY TYPE, 2018-2030 (USD MILLION)
- TABLE 102. UNITED ARAB EMIRATES ESTERS MARKET SIZE, BY APPLICATION, 2018-2030 (USD MILLION)
- TABLE 103. UNITED KINGDOM ESTERS MARKET SIZE, BY TYPE, 2018-2030 (USD MILLION)
- TABLE 104. UNITED KINGDOM ESTERS MARKET SIZE, BY APPLICATION, 2018-2030 (USD MILLION)
- TABLE 105. ESTERS MARKET, FPNV POSITIONING MATRIX, 2023
- TABLE 106. ESTERS MARKET SHARE, BY KEY PLAYER, 2023
- TABLE 107. ESTERS MARKET LICENSE & PRICING
 丙烯酸酯市场:按类型、应用分类 - 2024-2030 年全球预测
 丙烯酸酯市场:按类型、应用分类 - 2024-2030 年全球预测
 一丁基氧化锡市场报告:2030 年趋势、预测与竞争分析
 对羟基苯甲酸丙酯市场规模 - 按功能(防腐剂、乳化剂、外用药物)、最终用途(药品、化妆品和个人护理、食品、化学工业)以及全球预测,2023 - 2032 年
 全球油酸酯市场
 甲基丙烯酸缩水甘油酯市场(等级:普通级和高纯度级;纯度:97.0%、98.5% 和 99.0%)—2023-2031 年全球产业分析、规模、份额、成长、趋势和预测
 世界及美国的酯市场:2023-2029年
 油酸酯市场:副产品(油酸丁酯、油酸乙酯、油酸甲酯)、按原料(玉米、颗粒、大豆)、按用途- COVID-19、俄罗斯-乌克兰衝突、高通膨的累积影响- 2023 年世界预测-2030年
 甲基丙烯酸缩水甘油酯(GMA)的全球市场,成果与预测(2018年~2029年)
 2023-2030年全球合成酯类润滑油市场