


 |
市场调查报告书
商品编码
1415410
流量控制市场:按设备类型、应用划分 - 2024-2030 年全球预测Flow Control Market by Equipment Type (Actuators, Flow Meters, Pumps), Application (Electronics, Marine, Mining) - Global Forecast 2024-2030 |
||||||
※ 本网页内容可能与最新版本有所差异。详细情况请与我们联繫。
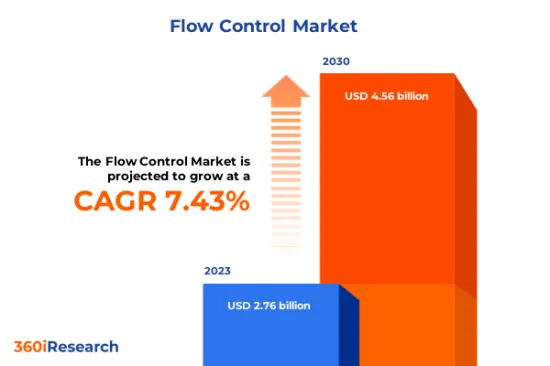
预计2023年流量控制市场规模为27.6亿美元,2024年达29.5亿美元,2030年预估达45.6亿美元,复合年增长率为7.43%。
全球流量控制市场
| 主要市场统计 | |
|---|---|
| 基准年[2023] | 27.6亿美元 |
| 预测年份 [2024] | 29.5亿美元 |
| 预测年份 [2030] | 45.6亿美元 |
| 复合年增长率(%) | 7.43% |
流量控制是指管理、调节和操纵系统或製程流体、气体和其他物质的流动。流量控制旨在确保物料传输以受控且高效的方式进行,满足指定应用的特定要求。随着材料、感测器、自动化和数位控制系统的进步,流量控制技术不断发展。严格控制流体流量的能力是许多工业製程的基础,有助于提高效率、安全性和整体系统性能。提供更好性能和整合能力的创新产品以及更严格的环境保护和工业流程标准正在推动市场成长。基础设施开拓,包括工业设施、水处理厂和能源部门的新计画和升级,以及新兴经济体的工业扩张,推动了整体市场的成长。然而,先进流量控制系统的资本成本较高,原材料价格波动影响流量控制装置的製造和定价,安装和维护的复杂性阻碍了市场的引入。对需要先进流量控制解决方案和自动化趋势的可再生能源计划的投资不断增加,正在创造对智慧阀门和智慧型流量计的需求,以实现更好的製程控制,从而创造未来的市场机会。
区域洞察
由于石油天然气和化学品等行业的成长,消费者需求不断增加,美洲在流量控制市场中占有重要地位。客户的购买行为显示他们对节能且环境永续的流量控制解决方案的偏好。高水准的研发投资正在推动持续创新,重点是流量控制系统的数位化和自动化。欧盟 (EU) 严格的环境标准需要先进且永续的流量控制技术。欧盟客户要求产品满足严格的能源效率指令和低排放气体目标。在欧洲市场,有大量旨在最小化工业过程对生态影响的研究,并且在流量控制领域获得了许多与绿色技术相关的专利。石油和天然气产业在中东的流量控制市场中占据主导地位,需要能够应对恶劣环境和高温的系统。中东客户倾向于购买符合国际安全和品质标准的高规格产品,这进一步推动了该地区的市场成长。亚太地区流量控制市场主要受到新兴经济体工业快速开拓的推动。该地区的客户需求多种多样,成熟市场青睐优质的高科技解决方案,而新兴市场则强调成本效率。区域投资受到都市化、技术采用和基础设施加强的影响。
FPNV定位矩阵
FPNV定位矩阵对于评估流量控制市场至关重要。我们检视与业务策略和产品满意度相关的关键指标,以对供应商进行全面评估。这种深入的分析使用户能够根据自己的要求做出明智的决策。根据评估,供应商被分为四个成功程度不同的像限:前沿(F)、探路者(P)、利基(N)和重要(V)。
市场占有率分析
市场占有率分析是一种综合工具,可以对流量控制市场中供应商的现状进行深入而详细的研究。全面比较和分析供应商在整体收益、基本客群和其他关键指标方面的贡献,以便更好地了解公司的绩效及其在争夺市场占有率时面临的挑战。此外,该分析还提供了对该行业竞争特征的宝贵考察,包括在研究基准年观察到的累积、分散主导地位和合併特征等因素。这种详细程度的提高使供应商能够做出更明智的决策并制定有效的策略,从而在市场上获得竞争优势。
该报告对以下几个方面提供了宝贵的见解:
1-市场渗透率:提供有关主要企业所服务的市场的全面资讯。
2-市场开拓:我们深入研究利润丰厚的新兴市场,并分析它们在成熟细分市场中的渗透率。
3- 市场多元化:提供有关新产品发布、开拓地区、最新发展和投资的详细资讯。
4-竞争力评估与资讯:对主要企业的市场占有率、策略、产品、认证、监管状况、专利状况、製造能力等进行全面评估。
5- 产品开发与创新:提供对未来技术、研发活动和突破性产品开发的见解。
本报告解决了以下关键问题:
1-流量控制市场的市场规模与预测是多少?
2-在流量控制市场的预测期内,需要考虑投资哪些产品、细分市场、应用和领域?
3-流量控制市场的技术趋势和法律规范是什么?
4-流量控制市场主要厂商的市场占有率是多少?
5-进入流量控制市场的合适型态或策略手段是什么?
目录
第一章 前言
第二章调查方法
第三章执行摘要
第四章市场概况
第五章市场洞察
- 市场动态
- 促进因素
- 石油和天然气产业需求增加
- 收紧环境保护和工业流程的政府标准
- 加大基础建设力度,新计画激增,工业设施升级
- 抑制因素
- 与先进的流量控制系统相关的高资本成本
- 机会
- 可再生能源计划投资的增加增加了对先进流量控制解决方案的需求
- 创新流量控制开发的技术进步
- 任务
- 安装和维护先进流量控制基础设施的复杂性
- 促进因素
- 市场区隔分析
- 设备类型:大量使用稳压器来控制流体的压力或流量
- 应用:石油天然气产业流量控制采用率高
- 市场趋势分析
- 高通膨的累积效应
- 波特五力分析
- 价值炼和关键路径分析
- 法律规范
第六章依设备类型分類的流量控制市场
- 致动器
- 流量计
- 泵浦
- 稳压器
- 阀门
第七章流量控制市场:按应用
- 电子产品
- 海洋
- 矿业
- 石油天然气
- 电力
第八章美洲流量控制市场
- 阿根廷
- 巴西
- 加拿大
- 墨西哥
- 美国
第九章亚太流量控制市场
- 澳洲
- 中国
- 印度
- 印尼
- 日本
- 马来西亚
- 菲律宾
- 新加坡
- 韩国
- 台湾
- 泰国
- 越南
第十章 欧洲、中东、非洲流量控制市场
- 丹麦
- 埃及
- 芬兰
- 法国
- 德国
- 以色列
- 义大利
- 荷兰
- 奈及利亚
- 挪威
- 波兰
- 卡达
- 俄罗斯
- 沙乌地阿拉伯
- 南非
- 西班牙
- 瑞典
- 瑞士
- 土耳其
- 阿拉伯聯合大公国
- 英国
第十一章竞争形势
- FPNV定位矩阵
- 市场占有率分析:主要企业
- 主要企业竞争情境分析
- 新产品发布和功能增强
第12章竞争产品组合
- 主要公司简介
- ABB Ltd.
- Alfa Laval AB
- Azbil Corporation
- Badger Meter, Inc.
- Circor International, Inc.
- Crane Holdings, Co.
- Emerson Electric Co.
- Endress+Hauser AG
- Flowserve Corporation
- Fluidra SA
- Fratelli Tognella SpA
- General Electric Company
- Hitachi High-Tech Corporation
- Honeywell International Inc.
- IMI Critical Engineering
- Katronic Technologies Ltd.
- KEM Kuppers Elektromechanik GmbH
- KITZ Corporation
- Max Machinery, Inc.
- Parker Hannifin Corporation
- Robert Bosch GmbH
- Rotork PLC
- Samson Controls Inc.
- Schlumberger NV
- Schneider Electric SE
- Sick AG
- Valmet Oyj
- Weatherford International PLC
- Yokogawa Electric Corporation
- 主要产品系列
第十三章附录
- 讨论指南
- 关于许可证和定价
[180 Pages Report] The Flow Control Market size was estimated at USD 2.76 billion in 2023 and expected to reach USD 2.95 billion in 2024, at a CAGR 7.43% to reach USD 4.56 billion by 2030.
Global Flow Control Market
| KEY MARKET STATISTICS | |
|---|---|
| Base Year [2023] | USD 2.76 billion |
| Estimated Year [2024] | USD 2.95 billion |
| Forecast Year [2030] | USD 4.56 billion |
| CAGR (%) | 7.43% |
Flow control refers to managing, regulating, and manipulating the flow of fluids, gases, or other materials within a system or process. Flow control aims to ensure that the movement of substances occurs in a controlled and efficient manner, meeting specific requirements for the given application. Flow control technologies continue to evolve with advancements in materials, sensors, automation, and digital control systems. The capacity to strictly regulate the flow of fluids is fundamental to numerous industrial processes, contributing to efficiency, safety, and overall system performance. Innovative products offering better performance and integration capabilities and stricter standards for environmental protection and industrial processes fueled the market growth. Infrastructure development, such as new projects and upgrades in industrial facilities, water treatment plants, and energy sectors, and expanding industries in emerging economies contributed to the overall market growth. However, High capital costs for advanced flow control systems and fluctuating raw material prices affect the manufacturing and pricing of flow control devices, and complexity in installation and maintenance hamper the market adoption. Increased investment in renewable energy projects demanding advanced flow control solutions and automation trends necessitated smart valves and intelligent flow meters for better process management, creating future market opportunities.
Regional Insights
The Americas has a significant landscape in the flow control market owing to robust consumer needs due to the growth of industries such as oil and gas and chemicals. Customer purchasing behavior indicates a preference for energy-efficient and environmentally sustainable flow control solutions. High levels of investment in R&D facilitate continuous innovation, with initiatives focusing on digitalization and automation in flow control systems. The European Union's rigorous environmental standards drive the need for advanced and sustainable flow control technologies. EU customers are inclined towards products that meet stringent energy efficiency directives and low-emission goals. The European market demonstrates significant research endeavors aimed at minimizing the ecological impact of industrial processes, and there are many patents about green technologies within the flow control sector. The oil and gas industry predominantly dictates the Middle Eastern flow control market, necessitating systems capable of handling aggressive environments and high temperatures. The tendency of Middle Eastern customers to lean toward high-specification products that conform to international safety and quality standards has further fueled the market growth in the region. Asia Pacific's flow control market is driven by burgeoning industrial development, particularly in emerging economies. Customer needs in the area are diverse, with mature markets favoring premium, high-tech solutions and developing markets emphasizing cost-effectiveness. Regional investments are influenced by urbanization, technological adoption, and infrastructure enhancement.
FPNV Positioning Matrix
The FPNV Positioning Matrix is pivotal in evaluating the Flow Control Market. It offers a comprehensive assessment of vendors, examining key metrics related to Business Strategy and Product Satisfaction. This in-depth analysis empowers users to make well-informed decisions aligned with their requirements. Based on the evaluation, the vendors are then categorized into four distinct quadrants representing varying levels of success: Forefront (F), Pathfinder (P), Niche (N), or Vital (V).
Market Share Analysis
The Market Share Analysis is a comprehensive tool that provides an insightful and in-depth examination of the current state of vendors in the Flow Control Market. By meticulously comparing and analyzing vendor contributions in terms of overall revenue, customer base, and other key metrics, we can offer companies a greater understanding of their performance and the challenges they face when competing for market share. Additionally, this analysis provides valuable insights into the competitive nature of the sector, including factors such as accumulation, fragmentation dominance, and amalgamation traits observed over the base year period studied. With this expanded level of detail, vendors can make more informed decisions and devise effective strategies to gain a competitive edge in the market.
Key Company Profiles
The report delves into recent significant developments in the Flow Control Market, highlighting leading vendors and their innovative profiles. These include ABB Ltd., Alfa Laval AB, Azbil Corporation, Badger Meter, Inc., Circor International, Inc., Crane Holdings, Co., Emerson Electric Co., Endress+Hauser AG, Flowserve Corporation, Fluidra S.A., Fratelli Tognella S.p.A, General Electric Company, Hitachi High-Tech Corporation, Honeywell International Inc., IMI Critical Engineering, Katronic Technologies Ltd., KEM Kuppers Elektromechanik GmbH, KITZ Corporation, Max Machinery, Inc., Parker Hannifin Corporation, Robert Bosch GmbH, Rotork PLC, Samson Controls Inc., Schlumberger NV, Schneider Electric SE, Sick AG, Valmet Oyj, Weatherford International PLC, and Yokogawa Electric Corporation.
Market Segmentation & Coverage
This research report categorizes the Flow Control Market to forecast the revenues and analyze trends in each of the following sub-markets:
- Equipment Type
- Actuators
- Flow Meters
- Pumps
- Regulators
- Valves
- Application
- Electronics
- Marine
- Mining
- Oil & Gas
- Power
- Region
- Americas
- Argentina
- Brazil
- Canada
- Mexico
- United States
- California
- Florida
- Illinois
- New York
- Ohio
- Pennsylvania
- Texas
- Asia-Pacific
- Australia
- China
- India
- Indonesia
- Japan
- Malaysia
- Philippines
- Singapore
- South Korea
- Taiwan
- Thailand
- Vietnam
- Europe, Middle East & Africa
- Denmark
- Egypt
- Finland
- France
- Germany
- Israel
- Italy
- Netherlands
- Nigeria
- Norway
- Poland
- Qatar
- Russia
- Saudi Arabia
- South Africa
- Spain
- Sweden
- Switzerland
- Turkey
- United Arab Emirates
- United Kingdom
- Americas
The report offers valuable insights on the following aspects:
1. Market Penetration: It presents comprehensive information on the market provided by key players.
2. Market Development: It delves deep into lucrative emerging markets and analyzes the penetration across mature market segments.
3. Market Diversification: It provides detailed information on new product launches, untapped geographic regions, recent developments, and investments.
4. Competitive Assessment & Intelligence: It conducts an exhaustive assessment of market shares, strategies, products, certifications, regulatory approvals, patent landscape, and manufacturing capabilities of the leading players.
5. Product Development & Innovation: It offers intelligent insights on future technologies, R&D activities, and breakthrough product developments.
The report addresses key questions such as:
1. What is the market size and forecast of the Flow Control Market?
2. Which products, segments, applications, and areas should one consider investing in over the forecast period in the Flow Control Market?
3. What are the technology trends and regulatory frameworks in the Flow Control Market?
4. What is the market share of the leading vendors in the Flow Control Market?
5. Which modes and strategic moves are suitable for entering the Flow Control Market?
Table of Contents
1. Preface
- 1.1. Objectives of the Study
- 1.2. Market Segmentation & Coverage
- 1.3. Years Considered for the Study
- 1.4. Currency & Pricing
- 1.5. Language
- 1.6. Limitations
- 1.7. Assumptions
- 1.8. Stakeholders
2. Research Methodology
- 2.1. Define: Research Objective
- 2.2. Determine: Research Design
- 2.3. Prepare: Research Instrument
- 2.4. Collect: Data Source
- 2.5. Analyze: Data Interpretation
- 2.6. Formulate: Data Verification
- 2.7. Publish: Research Report
- 2.8. Repeat: Report Update
3. Executive Summary
4. Market Overview
- 4.1. Introduction
- 4.2. Flow Control Market, by Region
5. Market Insights
- 5.1. Market Dynamics
- 5.1.1. Drivers
- 5.1.1.1. Increasing demand from the oil and gas industry
- 5.1.1.2. Stricter government standards for environmental protection and industrial processes
- 5.1.1.3. Rising infrastructure development coupled with a surge in new projects and upgrades in industrial facilities
- 5.1.2. Restraints
- 5.1.2.1. High capital costs associated with the advanced flow control systems
- 5.1.3. Opportunities
- 5.1.3.1. Increased investment in renewable energy projects led to demand for advanced flow control solutions
- 5.1.3.2. Technological advancements in the development of innovative flow controls
- 5.1.4. Challenges
- 5.1.4.1. Complexity in installation and maintenance of sophisticated flow control infrastructure
- 5.1.1. Drivers
- 5.2. Market Segmentation Analysis
- 5.2.1. Equipment Type: Significant utilization of regulators to control the pressure or flow of fluids
- 5.2.2. Application: High adoption of flow control in oil & gas industry
- 5.3. Market Trend Analysis
- 5.4. Cumulative Impact of High Inflation
- 5.5. Porter's Five Forces Analysis
- 5.5.1. Threat of New Entrants
- 5.5.2. Threat of Substitutes
- 5.5.3. Bargaining Power of Customers
- 5.5.4. Bargaining Power of Suppliers
- 5.5.5. Industry Rivalry
- 5.6. Value Chain & Critical Path Analysis
- 5.7. Regulatory Framework
6. Flow Control Market, by Equipment Type
- 6.1. Introduction
- 6.2. Actuators
- 6.3. Flow Meters
- 6.4. Pumps
- 6.5. Regulators
- 6.6. Valves
7. Flow Control Market, by Application
- 7.1. Introduction
- 7.2. Electronics
- 7.3. Marine
- 7.4. Mining
- 7.5. Oil & Gas
- 7.6. Power
8. Americas Flow Control Market
- 8.1. Introduction
- 8.2. Argentina
- 8.3. Brazil
- 8.4. Canada
- 8.5. Mexico
- 8.6. United States
9. Asia-Pacific Flow Control Market
- 9.1. Introduction
- 9.2. Australia
- 9.3. China
- 9.4. India
- 9.5. Indonesia
- 9.6. Japan
- 9.7. Malaysia
- 9.8. Philippines
- 9.9. Singapore
- 9.10. South Korea
- 9.11. Taiwan
- 9.12. Thailand
- 9.13. Vietnam
10. Europe, Middle East & Africa Flow Control Market
- 10.1. Introduction
- 10.2. Denmark
- 10.3. Egypt
- 10.4. Finland
- 10.5. France
- 10.6. Germany
- 10.7. Israel
- 10.8. Italy
- 10.9. Netherlands
- 10.10. Nigeria
- 10.11. Norway
- 10.12. Poland
- 10.13. Qatar
- 10.14. Russia
- 10.15. Saudi Arabia
- 10.16. South Africa
- 10.17. Spain
- 10.18. Sweden
- 10.19. Switzerland
- 10.20. Turkey
- 10.21. United Arab Emirates
- 10.22. United Kingdom
11. Competitive Landscape
- 11.1. FPNV Positioning Matrix
- 11.2. Market Share Analysis, By Key Player
- 11.3. Competitive Scenario Analysis, By Key Player
- 11.3.1. New Product Launch & Enhancement
- 11.3.1.1. Fuji Electric Launches New S-Flow Ultrasonic Flow Meter
- 11.3.1.2. PSG Launches New and Updated Flow-Sensor and Flow-Measurement Technologies
- 11.3.1.3. Sensirion Launches Its New SFC6000 Mass Flow Controller
- 11.3.1. New Product Launch & Enhancement
12. Competitive Portfolio
- 12.1. Key Company Profiles
- 12.1.1. ABB Ltd.
- 12.1.2. Alfa Laval AB
- 12.1.3. Azbil Corporation
- 12.1.4. Badger Meter, Inc.
- 12.1.5. Circor International, Inc.
- 12.1.6. Crane Holdings, Co.
- 12.1.7. Emerson Electric Co.
- 12.1.8. Endress+Hauser AG
- 12.1.9. Flowserve Corporation
- 12.1.10. Fluidra S.A.
- 12.1.11. Fratelli Tognella S.p.A
- 12.1.12. General Electric Company
- 12.1.13. Hitachi High-Tech Corporation
- 12.1.14. Honeywell International Inc.
- 12.1.15. IMI Critical Engineering
- 12.1.16. Katronic Technologies Ltd.
- 12.1.17. KEM Kuppers Elektromechanik GmbH
- 12.1.18. KITZ Corporation
- 12.1.19. Max Machinery, Inc.
- 12.1.20. Parker Hannifin Corporation
- 12.1.21. Robert Bosch GmbH
- 12.1.22. Rotork PLC
- 12.1.23. Samson Controls Inc.
- 12.1.24. Schlumberger NV
- 12.1.25. Schneider Electric SE
- 12.1.26. Sick AG
- 12.1.27. Valmet Oyj
- 12.1.28. Weatherford International PLC
- 12.1.29. Yokogawa Electric Corporation
- 12.2. Key Product Portfolio
13. Appendix
- 13.1. Discussion Guide
- 13.2. License & Pricing
LIST OF FIGURES
- FIGURE 1. FLOW CONTROL MARKET RESEARCH PROCESS
- FIGURE 2. FLOW CONTROL MARKET SIZE, 2023 VS 2030
- FIGURE 3. FLOW CONTROL MARKET SIZE, 2018-2030 (USD MILLION)
- FIGURE 4. FLOW CONTROL MARKET SIZE, BY REGION, 2023 VS 2030 (%)
- FIGURE 5. FLOW CONTROL MARKET SIZE, BY REGION, 2023 VS 2024 VS 2030 (USD MILLION)
- FIGURE 6. FLOW CONTROL MARKET DYNAMICS
- FIGURE 7. FLOW CONTROL MARKET SIZE, BY EQUIPMENT TYPE, 2023 VS 2030 (%)
- FIGURE 8. FLOW CONTROL MARKET SIZE, BY EQUIPMENT TYPE, 2023 VS 2024 VS 2030 (USD MILLION)
- FIGURE 9. FLOW CONTROL MARKET SIZE, BY APPLICATION, 2023 VS 2030 (%)
- FIGURE 10. FLOW CONTROL MARKET SIZE, BY APPLICATION, 2023 VS 2024 VS 2030 (USD MILLION)
- FIGURE 11. AMERICAS FLOW CONTROL MARKET SIZE, BY COUNTRY, 2023 VS 2030 (%)
- FIGURE 12. AMERICAS FLOW CONTROL MARKET SIZE, BY COUNTRY, 2023 VS 2024 VS 2030 (USD MILLION)
- FIGURE 13. UNITED STATES FLOW CONTROL MARKET SIZE, BY STATE, 2023 VS 2030 (%)
- FIGURE 14. UNITED STATES FLOW CONTROL MARKET SIZE, BY STATE, 2023 VS 2024 VS 2030 (USD MILLION)
- FIGURE 15. ASIA-PACIFIC FLOW CONTROL MARKET SIZE, BY COUNTRY, 2023 VS 2030 (%)
- FIGURE 16. ASIA-PACIFIC FLOW CONTROL MARKET SIZE, BY COUNTRY, 2023 VS 2024 VS 2030 (USD MILLION)
- FIGURE 17. EUROPE, MIDDLE EAST & AFRICA FLOW CONTROL MARKET SIZE, BY COUNTRY, 2023 VS 2030 (%)
- FIGURE 18. EUROPE, MIDDLE EAST & AFRICA FLOW CONTROL MARKET SIZE, BY COUNTRY, 2023 VS 2024 VS 2030 (USD MILLION)
- FIGURE 19. FLOW CONTROL MARKET, FPNV POSITIONING MATRIX, 2023
- FIGURE 20. FLOW CONTROL MARKET SHARE, BY KEY PLAYER, 2023
LIST OF TABLES
- TABLE 1. FLOW CONTROL MARKET SEGMENTATION & COVERAGE
- TABLE 2. UNITED STATES DOLLAR EXCHANGE RATE, 2018-2023
- TABLE 3. FLOW CONTROL MARKET SIZE, 2018-2030 (USD MILLION)
- TABLE 4. GLOBAL FLOW CONTROL MARKET SIZE, BY REGION, 2018-2030 (USD MILLION)
- TABLE 5. FLOW CONTROL MARKET SIZE, BY EQUIPMENT TYPE, 2018-2030 (USD MILLION)
- TABLE 6. FLOW CONTROL MARKET SIZE, BY ACTUATORS, BY REGION, 2018-2030 (USD MILLION)
- TABLE 7. FLOW CONTROL MARKET SIZE, BY FLOW METERS, BY REGION, 2018-2030 (USD MILLION)
- TABLE 8. FLOW CONTROL MARKET SIZE, BY PUMPS, BY REGION, 2018-2030 (USD MILLION)
- TABLE 9. FLOW CONTROL MARKET SIZE, BY REGULATORS, BY REGION, 2018-2030 (USD MILLION)
- TABLE 10. FLOW CONTROL MARKET SIZE, BY VALVES, BY REGION, 2018-2030 (USD MILLION)
- TABLE 11. FLOW CONTROL MARKET SIZE, BY APPLICATION, 2018-2030 (USD MILLION)
- TABLE 12. FLOW CONTROL MARKET SIZE, BY ELECTRONICS, BY REGION, 2018-2030 (USD MILLION)
- TABLE 13. FLOW CONTROL MARKET SIZE, BY MARINE, BY REGION, 2018-2030 (USD MILLION)
- TABLE 14. FLOW CONTROL MARKET SIZE, BY MINING, BY REGION, 2018-2030 (USD MILLION)
- TABLE 15. FLOW CONTROL MARKET SIZE, BY OIL & GAS, BY REGION, 2018-2030 (USD MILLION)
- TABLE 16. FLOW CONTROL MARKET SIZE, BY POWER, BY REGION, 2018-2030 (USD MILLION)
- TABLE 17. AMERICAS FLOW CONTROL MARKET SIZE, BY EQUIPMENT TYPE, 2018-2030 (USD MILLION)
- TABLE 18. AMERICAS FLOW CONTROL MARKET SIZE, BY APPLICATION, 2018-2030 (USD MILLION)
- TABLE 19. AMERICAS FLOW CONTROL MARKET SIZE, BY COUNTRY, 2018-2030 (USD MILLION)
- TABLE 20. ARGENTINA FLOW CONTROL MARKET SIZE, BY EQUIPMENT TYPE, 2018-2030 (USD MILLION)
- TABLE 21. ARGENTINA FLOW CONTROL MARKET SIZE, BY APPLICATION, 2018-2030 (USD MILLION)
- TABLE 22. BRAZIL FLOW CONTROL MARKET SIZE, BY EQUIPMENT TYPE, 2018-2030 (USD MILLION)
- TABLE 23. BRAZIL FLOW CONTROL MARKET SIZE, BY APPLICATION, 2018-2030 (USD MILLION)
- TABLE 24. CANADA FLOW CONTROL MARKET SIZE, BY EQUIPMENT TYPE, 2018-2030 (USD MILLION)
- TABLE 25. CANADA FLOW CONTROL MARKET SIZE, BY APPLICATION, 2018-2030 (USD MILLION)
- TABLE 26. MEXICO FLOW CONTROL MARKET SIZE, BY EQUIPMENT TYPE, 2018-2030 (USD MILLION)
- TABLE 27. MEXICO FLOW CONTROL MARKET SIZE, BY APPLICATION, 2018-2030 (USD MILLION)
- TABLE 28. UNITED STATES FLOW CONTROL MARKET SIZE, BY EQUIPMENT TYPE, 2018-2030 (USD MILLION)
- TABLE 29. UNITED STATES FLOW CONTROL MARKET SIZE, BY APPLICATION, 2018-2030 (USD MILLION)
- TABLE 30. UNITED STATES FLOW CONTROL MARKET SIZE, BY STATE, 2018-2030 (USD MILLION)
- TABLE 31. ASIA-PACIFIC FLOW CONTROL MARKET SIZE, BY EQUIPMENT TYPE, 2018-2030 (USD MILLION)
- TABLE 32. ASIA-PACIFIC FLOW CONTROL MARKET SIZE, BY APPLICATION, 2018-2030 (USD MILLION)
- TABLE 33. ASIA-PACIFIC FLOW CONTROL MARKET SIZE, BY COUNTRY, 2018-2030 (USD MILLION)
- TABLE 34. AUSTRALIA FLOW CONTROL MARKET SIZE, BY EQUIPMENT TYPE, 2018-2030 (USD MILLION)
- TABLE 35. AUSTRALIA FLOW CONTROL MARKET SIZE, BY APPLICATION, 2018-2030 (USD MILLION)
- TABLE 36. CHINA FLOW CONTROL MARKET SIZE, BY EQUIPMENT TYPE, 2018-2030 (USD MILLION)
- TABLE 37. CHINA FLOW CONTROL MARKET SIZE, BY APPLICATION, 2018-2030 (USD MILLION)
- TABLE 38. INDIA FLOW CONTROL MARKET SIZE, BY EQUIPMENT TYPE, 2018-2030 (USD MILLION)
- TABLE 39. INDIA FLOW CONTROL MARKET SIZE, BY APPLICATION, 2018-2030 (USD MILLION)
- TABLE 40. INDONESIA FLOW CONTROL MARKET SIZE, BY EQUIPMENT TYPE, 2018-2030 (USD MILLION)
- TABLE 41. INDONESIA FLOW CONTROL MARKET SIZE, BY APPLICATION, 2018-2030 (USD MILLION)
- TABLE 42. JAPAN FLOW CONTROL MARKET SIZE, BY EQUIPMENT TYPE, 2018-2030 (USD MILLION)
- TABLE 43. JAPAN FLOW CONTROL MARKET SIZE, BY APPLICATION, 2018-2030 (USD MILLION)
- TABLE 44. MALAYSIA FLOW CONTROL MARKET SIZE, BY EQUIPMENT TYPE, 2018-2030 (USD MILLION)
- TABLE 45. MALAYSIA FLOW CONTROL MARKET SIZE, BY APPLICATION, 2018-2030 (USD MILLION)
- TABLE 46. PHILIPPINES FLOW CONTROL MARKET SIZE, BY EQUIPMENT TYPE, 2018-2030 (USD MILLION)
- TABLE 47. PHILIPPINES FLOW CONTROL MARKET SIZE, BY APPLICATION, 2018-2030 (USD MILLION)
- TABLE 48. SINGAPORE FLOW CONTROL MARKET SIZE, BY EQUIPMENT TYPE, 2018-2030 (USD MILLION)
- TABLE 49. SINGAPORE FLOW CONTROL MARKET SIZE, BY APPLICATION, 2018-2030 (USD MILLION)
- TABLE 50. SOUTH KOREA FLOW CONTROL MARKET SIZE, BY EQUIPMENT TYPE, 2018-2030 (USD MILLION)
- TABLE 51. SOUTH KOREA FLOW CONTROL MARKET SIZE, BY APPLICATION, 2018-2030 (USD MILLION)
- TABLE 52. TAIWAN FLOW CONTROL MARKET SIZE, BY EQUIPMENT TYPE, 2018-2030 (USD MILLION)
- TABLE 53. TAIWAN FLOW CONTROL MARKET SIZE, BY APPLICATION, 2018-2030 (USD MILLION)
- TABLE 54. THAILAND FLOW CONTROL MARKET SIZE, BY EQUIPMENT TYPE, 2018-2030 (USD MILLION)
- TABLE 55. THAILAND FLOW CONTROL MARKET SIZE, BY APPLICATION, 2018-2030 (USD MILLION)
- TABLE 56. VIETNAM FLOW CONTROL MARKET SIZE, BY EQUIPMENT TYPE, 2018-2030 (USD MILLION)
- TABLE 57. VIETNAM FLOW CONTROL MARKET SIZE, BY APPLICATION, 2018-2030 (USD MILLION)
- TABLE 58. EUROPE, MIDDLE EAST & AFRICA FLOW CONTROL MARKET SIZE, BY EQUIPMENT TYPE, 2018-2030 (USD MILLION)
- TABLE 59. EUROPE, MIDDLE EAST & AFRICA FLOW CONTROL MARKET SIZE, BY APPLICATION, 2018-2030 (USD MILLION)
- TABLE 60. EUROPE, MIDDLE EAST & AFRICA FLOW CONTROL MARKET SIZE, BY COUNTRY, 2018-2030 (USD MILLION)
- TABLE 61. DENMARK FLOW CONTROL MARKET SIZE, BY EQUIPMENT TYPE, 2018-2030 (USD MILLION)
- TABLE 62. DENMARK FLOW CONTROL MARKET SIZE, BY APPLICATION, 2018-2030 (USD MILLION)
- TABLE 63. EGYPT FLOW CONTROL MARKET SIZE, BY EQUIPMENT TYPE, 2018-2030 (USD MILLION)
- TABLE 64. EGYPT FLOW CONTROL MARKET SIZE, BY APPLICATION, 2018-2030 (USD MILLION)
- TABLE 65. FINLAND FLOW CONTROL MARKET SIZE, BY EQUIPMENT TYPE, 2018-2030 (USD MILLION)
- TABLE 66. FINLAND FLOW CONTROL MARKET SIZE, BY APPLICATION, 2018-2030 (USD MILLION)
- TABLE 67. FRANCE FLOW CONTROL MARKET SIZE, BY EQUIPMENT TYPE, 2018-2030 (USD MILLION)
- TABLE 68. FRANCE FLOW CONTROL MARKET SIZE, BY APPLICATION, 2018-2030 (USD MILLION)
- TABLE 69. GERMANY FLOW CONTROL MARKET SIZE, BY EQUIPMENT TYPE, 2018-2030 (USD MILLION)
- TABLE 70. GERMANY FLOW CONTROL MARKET SIZE, BY APPLICATION, 2018-2030 (USD MILLION)
- TABLE 71. ISRAEL FLOW CONTROL MARKET SIZE, BY EQUIPMENT TYPE, 2018-2030 (USD MILLION)
- TABLE 72. ISRAEL FLOW CONTROL MARKET SIZE, BY APPLICATION, 2018-2030 (USD MILLION)
- TABLE 73. ITALY FLOW CONTROL MARKET SIZE, BY EQUIPMENT TYPE, 2018-2030 (USD MILLION)
- TABLE 74. ITALY FLOW CONTROL MARKET SIZE, BY APPLICATION, 2018-2030 (USD MILLION)
- TABLE 75. NETHERLANDS FLOW CONTROL MARKET SIZE, BY EQUIPMENT TYPE, 2018-2030 (USD MILLION)
- TABLE 76. NETHERLANDS FLOW CONTROL MARKET SIZE, BY APPLICATION, 2018-2030 (USD MILLION)
- TABLE 77. NIGERIA FLOW CONTROL MARKET SIZE, BY EQUIPMENT TYPE, 2018-2030 (USD MILLION)
- TABLE 78. NIGERIA FLOW CONTROL MARKET SIZE, BY APPLICATION, 2018-2030 (USD MILLION)
- TABLE 79. NORWAY FLOW CONTROL MARKET SIZE, BY EQUIPMENT TYPE, 2018-2030 (USD MILLION)
- TABLE 80. NORWAY FLOW CONTROL MARKET SIZE, BY APPLICATION, 2018-2030 (USD MILLION)
- TABLE 81. POLAND FLOW CONTROL MARKET SIZE, BY EQUIPMENT TYPE, 2018-2030 (USD MILLION)
- TABLE 82. POLAND FLOW CONTROL MARKET SIZE, BY APPLICATION, 2018-2030 (USD MILLION)
- TABLE 83. QATAR FLOW CONTROL MARKET SIZE, BY EQUIPMENT TYPE, 2018-2030 (USD MILLION)
- TABLE 84. QATAR FLOW CONTROL MARKET SIZE, BY APPLICATION, 2018-2030 (USD MILLION)
- TABLE 85. RUSSIA FLOW CONTROL MARKET SIZE, BY EQUIPMENT TYPE, 2018-2030 (USD MILLION)
- TABLE 86. RUSSIA FLOW CONTROL MARKET SIZE, BY APPLICATION, 2018-2030 (USD MILLION)
- TABLE 87. SAUDI ARABIA FLOW CONTROL MARKET SIZE, BY EQUIPMENT TYPE, 2018-2030 (USD MILLION)
- TABLE 88. SAUDI ARABIA FLOW CONTROL MARKET SIZE, BY APPLICATION, 2018-2030 (USD MILLION)
- TABLE 89. SOUTH AFRICA FLOW CONTROL MARKET SIZE, BY EQUIPMENT TYPE, 2018-2030 (USD MILLION)
- TABLE 90. SOUTH AFRICA FLOW CONTROL MARKET SIZE, BY APPLICATION, 2018-2030 (USD MILLION)
- TABLE 91. SPAIN FLOW CONTROL MARKET SIZE, BY EQUIPMENT TYPE, 2018-2030 (USD MILLION)
- TABLE 92. SPAIN FLOW CONTROL MARKET SIZE, BY APPLICATION, 2018-2030 (USD MILLION)
- TABLE 93. SWEDEN FLOW CONTROL MARKET SIZE, BY EQUIPMENT TYPE, 2018-2030 (USD MILLION)
- TABLE 94. SWEDEN FLOW CONTROL MARKET SIZE, BY APPLICATION, 2018-2030 (USD MILLION)
- TABLE 95. SWITZERLAND FLOW CONTROL MARKET SIZE, BY EQUIPMENT TYPE, 2018-2030 (USD MILLION)
- TABLE 96. SWITZERLAND FLOW CONTROL MARKET SIZE, BY APPLICATION, 2018-2030 (USD MILLION)
- TABLE 97. TURKEY FLOW CONTROL MARKET SIZE, BY EQUIPMENT TYPE, 2018-2030 (USD MILLION)
- TABLE 98. TURKEY FLOW CONTROL MARKET SIZE, BY APPLICATION, 2018-2030 (USD MILLION)
- TABLE 99. UNITED ARAB EMIRATES FLOW CONTROL MARKET SIZE, BY EQUIPMENT TYPE, 2018-2030 (USD MILLION)
- TABLE 100. UNITED ARAB EMIRATES FLOW CONTROL MARKET SIZE, BY APPLICATION, 2018-2030 (USD MILLION)
- TABLE 101. UNITED KINGDOM FLOW CONTROL MARKET SIZE, BY EQUIPMENT TYPE, 2018-2030 (USD MILLION)
- TABLE 102. UNITED KINGDOM FLOW CONTROL MARKET SIZE, BY APPLICATION, 2018-2030 (USD MILLION)
- TABLE 103. FLOW CONTROL MARKET, FPNV POSITIONING MATRIX, 2023
- TABLE 104. FLOW CONTROL MARKET SHARE, BY KEY PLAYER, 2023
- TABLE 105. FLOW CONTROL MARKET LICENSE & PRICING
 液环真空帮浦市场:按类型、材料类型、流量、应用划分 - 2024-2030 年全球预测
 全球涡轮分子帮浦市场规模、份额和成长分析:按类型和最终用户 - 产业预测(2024-2031)
 全球实验室真空帮浦市场规模、份额、成长分析(按类型、按应用)- 产业预测,2023-2030 年
 真空帮浦:市场占有率分析、产业趋势与统计、成长预测(2024-2029)
 全球干式真空帮浦市场:趋势、预测、竞争分析(~2030 年)
 涡轮分子帮浦市场报告:2030 年趋势、预测与竞争分析
 真空帮浦市场报告:2030 年趋势、预测与竞争分析
 实验室真空帮浦市场:按产品类型、技术、应用和最终用户 - 2024-2030 年全球预测
 真空帮浦市场:按产品类型、技术和最终用户划分 - 2024-2030 年全球预测
 到 2030 年干式多级罗茨帮浦市场预测:按产品、材料、应用、最终用户和地区进行的全球分析