


 |
市场调查报告书
商品编码
1415472
卫星在轨服务市场:按服务类型、卫星类型、轨道、最终用户划分 - 全球预测 2024-2030On-Orbit Satellite Servicing Market by Service Type (Active Debris Removal & Orbit Adjustment, Assembly, Refueling), Satellite Type (Large Satellite, Medium Satellite, Small Satellite), Orbit, End-User - Global Forecast 2024-2030 |
||||||
※ 本网页内容可能与最新版本有所差异。详细情况请与我们联繫。
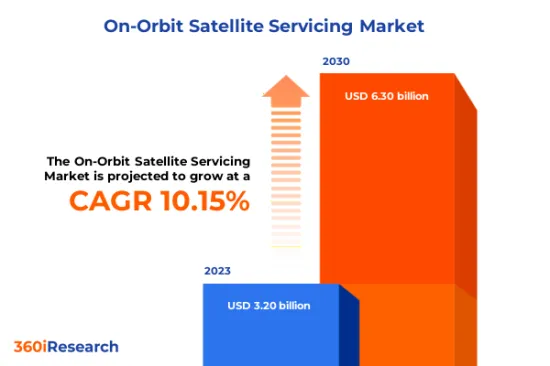
预计2023年卫星在轨服务市场规模为32亿美元,2024年达35.1亿美元,2030年预计将达63亿美元,复合年增长率为10.15%。
全球卫星在轨服务市场
| 主要市场统计 | |
|---|---|
| 基准年[2023] | 32亿美元 |
| 预测年份 [2024] | 35.1亿美元 |
| 预测年份 [2030] | 63亿美元 |
| 复合年增长率(%) | 10.15% |
卫星在轨服务是太空技术的新兴领域,涵盖旨在提高在轨卫星运行效率和延长使用寿命的广泛活动。这种创新的卫星维护方法代表了传统方法的模式转移,即退役过时的卫星并发射新卫星来取代它们。在轨服务具有多种优势,包括降低成本、提高可靠性、增强卫星功能以及减少空间碎片产生。全球卫星在轨服务市场由商业、政府和军事实体组成,这些实体开发用于检查、维修、加油和升级太空卫星的技术和服务。各领域对卫星服务的需求不断增长,以及能够在太空与卫星交会对接的自主机器人技术的进步,正在推动对在轨卫星服务的需求。监管措施和官民合作关係正在为新兴企业公司和上市公司探索创新的在轨定序解决方案创造有利的环境。然而,与先进技术相关的高开发成本可能会阻碍这些服务的商业性可行性。此外,太空碎片减缓、在轨安全管理和卫星所有权等法规的复杂性给在轨服务系统的部署带来了重大挑战。除了这些挑战之外,市场供应商还致力于透过开发可重复使用的服务平台和利用太空太阳能和小行星开采的推进剂等现场资源来降低任务成本。我就是。能够执行高级操作任务的自主机器人技术的改进以及政府太空支出的增加预计将推动全球卫星在轨服务市场的机会。
区域洞察
在美洲,美国在卫星在轨服务的研究、开发和商业化方面处于领先地位。 2020年,诺斯罗普·格鲁曼公司的任务扩展飞行器-1(MEV-1)成功展示了其透过附着在卫星上并控制轨道保持功能来延长通讯寿命的能力。这家美国公司的这项突破刺激了在轨定序技术的进一步发展。近年来,欧洲、中东和非洲地区的航太领域持续成长,农业、海洋监测、环境监测和灾害管理等各行业越来越多地采用基于卫星的应用。为了满足欧洲、中东和非洲地区对卫星及其服务快速增长的需求,各国正大力投资本土能力,旨在提供服务,同时延长现有卫星的使用寿命。此外,欧洲太空总署 (ESA) 透过资助和合作雄心勃勃的太空计划,在推动市场发展方面发挥着至关重要的作用。中国、印度和日本等国已成为亚太地区卫星在轨服务活动的主要参与者。这些国家强劲的经济成长,加上各种工业和民用目的对卫星应用的依赖日益增加,正在推动亚太地区卫星在轨服务市场的成长。
FPNV定位矩阵
FPNV定位矩阵对于评估卫星在轨服务市场至关重要。我们检视与业务策略和产品满意度相关的关键指标,以对供应商进行全面评估。这种深入的分析使用户能够根据自己的要求做出明智的决策。根据评估,供应商被分为四个成功程度不同的像限:前沿(F)、探路者(P)、利基(N)和重要(V)。
市场占有率分析
市场占有率分析是一种综合工具,可以对卫星在轨服务市场供应商的现状进行深入而深入的研究。全面比较和分析供应商在整体收益、基本客群和其他关键指标方面的贡献,以便更好地了解公司的绩效及其在争夺市场占有率时面临的挑战。此外,该分析还提供了对该行业竞争特征的宝贵考察,包括在研究基准年观察到的累积、分散主导地位和合併特征等因素。这种详细程度的提高使供应商能够做出更明智的决策并制定有效的策略,从而在市场上获得竞争优势。
该报告对以下几个方面提供了宝贵的见解:
1-市场渗透率:提供有关主要企业所服务的市场的全面资讯。
2-市场开拓:我们深入研究利润丰厚的新兴市场,并分析它们在成熟细分市场中的渗透率。
3- 市场多元化:提供有关新产品发布、开拓地区、最新发展和投资的详细资讯。
4-竞争力评估与资讯:对主要企业的市场占有率、策略、产品、认证、监管状况、专利状况、製造能力等进行全面评估。
5- 产品开发与创新:提供对未来技术、研发活动和突破性产品开发的见解。
本报告解决了以下关键问题:
1-卫星轨道服务市场的市场规模与预测是多少?
2-在卫星轨道服务市场预测期内,需要考虑投资哪些产品、细分市场、应用和领域?
3-卫星在轨服务市场的技术趋势和法律规范是什么?
4-卫星在轨服务市场主要供应商的市场占有率是多少?
5-进入卫星轨道服务市场的合适型态和战略手段是什么?
目录
第一章 前言
第二章调查方法
第三章执行摘要
第四章市场概况
第五章市场洞察
- 市场动态
- 促进因素
- 随着卫星人口老化,对卫星在轨服务的需求将会增加。
- 全球对地球静止卫星的需求不断增加
- 抑制因素
- 与卫星在轨服务相关的技术复杂性
- 机会
- 卫星在轨服务的持续发展
- 政府增加军事太空通讯的投资
- 任务
- 卫星在轨服务的严格规定和指南
- 促进因素
- 市场区隔分析
- 服务类型:对卫星加油服务的需求很高,以确保太空卫星的长期效率。
- 卫星类型:为了平衡成本和效能,中型卫星越来越多地采用在轨卫星服务。
- 轨道:中地球轨道在导航系统中的巨大优势。
- 最终用户:国防部门更多地采用该技术来优先考虑作战准备和復原能力。
- 市场趋势分析
- 高通膨的累积效应
- 波特五力分析
- 价值炼和关键路径分析
- 法律规范
第六章卫星轨道服务市场:依服务类型
- 主动清除碎片和轨道调整
- 组装
- 加油
- 机器人服务
第七章 按卫星类型分類的卫星轨道服务市场
- 大型卫星
- 中型卫星
- 小卫星
第八章依轨道分類的卫星轨道服务市场
- 地球静止轨道
- 低地球轨道(LEO)
- 中地球轨道 (MEO)
第九章卫星轨道服务市场:依最终用户分类
- 商业的
- 防御
第十章美洲卫星轨道服务市场
- 阿根廷
- 巴西
- 加拿大
- 墨西哥
- 美国
第十一章亚太卫星轨道服务市场
- 澳洲
- 中国
- 印度
- 印尼
- 日本
- 马来西亚
- 菲律宾
- 新加坡
- 韩国
- 台湾
- 泰国
- 越南
第十二章 欧洲、中东和非洲卫星轨道服务市场
- 丹麦
- 埃及
- 芬兰
- 法国
- 德国
- 以色列
- 义大利
- 荷兰
- 奈及利亚
- 挪威
- 波兰
- 卡达
- 俄罗斯
- 沙乌地阿拉伯
- 南非
- 西班牙
- 瑞典
- 瑞士
- 土耳其
- 阿拉伯聯合大公国
- 英国
第十三章竞争形势
- FPNV定位矩阵
- 市场占有率分析:主要企业
- 主要企业竞争情境分析
- 合约、合作和伙伴关係
- 新产品发布和功能增强
- 投资、资金筹措
第14章竞争产品组合
- 主要公司简介
- Airbus SE
- Altius Space Machines, Inc.
- Astroscale Holdings Inc.
- ClearSpace
- D-Orbit SpA
- Digantara
- Lockheed Martin Corporation
- Maxar Technologies Holdings Inc.
- Momentus Inc.
- Northrop Grumman Corporation
- Obruta Space Solutions Corp.
- Orbit Fab, Inc.
- OrbitGuardians
- Share My Space
- Thales
- Voyager Space Holdings, Inc.
- 主要产品系列
第十五章附录
- 讨论指南
- 关于许可证和定价
[193 Pages Report] The On-Orbit Satellite Servicing Market size was estimated at USD 3.20 billion in 2023 and expected to reach USD 3.51 billion in 2024, at a CAGR 10.15% to reach USD 6.30 billion by 2030.
Global On-Orbit Satellite Servicing Market
| KEY MARKET STATISTICS | |
|---|---|
| Base Year [2023] | USD 3.20 billion |
| Estimated Year [2024] | USD 3.51 billion |
| Forecast Year [2030] | USD 6.30 billion |
| CAGR (%) | 10.15% |
On-orbit satellite servicing is an emerging field in space technology, encompassing a broad range of activities aimed at enhancing operational efficiency and extending the lifespan of satellites while they are in orbit. This innovative approach to satellite maintenance represents a paradigm shift from traditional methods, which involve decommissioning out-of-service satellites and launching new ones as replacements. On-orbit satellite servicing offers various benefits, including cost reductions, improved reliability, enhanced satellite capabilities, and decreased space debris generation. The global on-orbit satellite servicing market consists of commercial, government, and military entities that develop technologies and services to inspect, repair, refuel, or upgrade satellites in space. Increasing demand for satellite-based services across various sectors and advancements in autonomous robotic technologies enabling rendezvous and docking with satellites in space are raising the demand for on-orbit satellite services. Regulatory initiatives and public-private partnerships have created a favorable environment for startups and established companies to explore innovative on-orbit servicing solutions. However, high development costs associated with advanced technologies may hinder the commercial viability of these services. Additionally, regulatory complexities concerning space debris mitigation, orbital safety management, and satellite ownership rights pose significant challenges to deploying on-orbit servicing systems. Besides the challenging factors, market vendors are focusing on reducing mission costs by developing reusable service platforms or leveraging in-situ resources such as space-based solar power or asteroid mining-derived propellants. Improving autonomous robotic technologies capable of sophisticated manipulation tasks and rising government space expenditure are expected to propel opportunities for the global on-orbit satellite servicing market.
Regional Insights
In the Americas, the United States is at the forefront of on-orbit satellite servicing research and development activities and commercialization efforts. In 2020, Northrop Grumman's Mission Extension Vehicle-1 (MEV-1) successfully demonstrated its ability to extend the life of a communication satellite by attaching itself and taking control of orbit maintenance functions. This groundbreaking achievement by an American company has spurred further growth in on-orbit servicing technologies. In recent years, EMEA has witnessed consistent growth in its space sector with increased adoption of satellite-based applications across various industries such as agriculture, maritime surveillance, environmental monitoring, and disaster management. To accommodate this burgeoning demand for satellites and their services within EMEA, countries are investing heavily in homegrown capabilities designed to service existing satellites while extending their operational lifespan. Moreover, the European Space Agency (ESA) is pivotal in driving the market forward by funding and collaborating on ambitious space projects. Countries such as China, India, and Japan have emerged as major participants in on-orbit satellite servicing activities within the APAC region. The robust economic growth in these countries, combined with their increased dependence on satellite-based applications for various industrial and civilian purposes, has resulted in heightened growth within the APAC region's on-orbit satellite servicing market.
FPNV Positioning Matrix
The FPNV Positioning Matrix is pivotal in evaluating the On-Orbit Satellite Servicing Market. It offers a comprehensive assessment of vendors, examining key metrics related to Business Strategy and Product Satisfaction. This in-depth analysis empowers users to make well-informed decisions aligned with their requirements. Based on the evaluation, the vendors are then categorized into four distinct quadrants representing varying levels of success: Forefront (F), Pathfinder (P), Niche (N), or Vital (V).
Market Share Analysis
The Market Share Analysis is a comprehensive tool that provides an insightful and in-depth examination of the current state of vendors in the On-Orbit Satellite Servicing Market. By meticulously comparing and analyzing vendor contributions in terms of overall revenue, customer base, and other key metrics, we can offer companies a greater understanding of their performance and the challenges they face when competing for market share. Additionally, this analysis provides valuable insights into the competitive nature of the sector, including factors such as accumulation, fragmentation dominance, and amalgamation traits observed over the base year period studied. With this expanded level of detail, vendors can make more informed decisions and devise effective strategies to gain a competitive edge in the market.
Key Company Profiles
The report delves into recent significant developments in the On-Orbit Satellite Servicing Market, highlighting leading vendors and their innovative profiles. These include Airbus SE, Altius Space Machines, Inc., Astroscale Holdings Inc., ClearSpace, D-Orbit SpA, Digantara, Lockheed Martin Corporation, Maxar Technologies Holdings Inc., Momentus Inc., Northrop Grumman Corporation, Obruta Space Solutions Corp., Orbit Fab, Inc., OrbitGuardians, Share My Space, Thales, and Voyager Space Holdings, Inc..
Market Segmentation & Coverage
This research report categorizes the On-Orbit Satellite Servicing Market to forecast the revenues and analyze trends in each of the following sub-markets:
- Service Type
- Active Debris Removal & Orbit Adjustment
- Assembly
- Refueling
- Robotic Servicing
- Satellite Type
- Large Satellite
- Medium Satellite
- Small Satellite
- Orbit
- Geostationary Orbit
- Low Earth Orbit (LEO)
- Medium Earth Orbit (MEO)
- End-User
- Commercial
- Defense
- Region
- Americas
- Argentina
- Brazil
- Canada
- Mexico
- United States
- California
- Florida
- Illinois
- New York
- Ohio
- Pennsylvania
- Texas
- Asia-Pacific
- Australia
- China
- India
- Indonesia
- Japan
- Malaysia
- Philippines
- Singapore
- South Korea
- Taiwan
- Thailand
- Vietnam
- Europe, Middle East & Africa
- Denmark
- Egypt
- Finland
- France
- Germany
- Israel
- Italy
- Netherlands
- Nigeria
- Norway
- Poland
- Qatar
- Russia
- Saudi Arabia
- South Africa
- Spain
- Sweden
- Switzerland
- Turkey
- United Arab Emirates
- United Kingdom
- Americas
The report offers valuable insights on the following aspects:
1. Market Penetration: It presents comprehensive information on the market provided by key players.
2. Market Development: It delves deep into lucrative emerging markets and analyzes the penetration across mature market segments.
3. Market Diversification: It provides detailed information on new product launches, untapped geographic regions, recent developments, and investments.
4. Competitive Assessment & Intelligence: It conducts an exhaustive assessment of market shares, strategies, products, certifications, regulatory approvals, patent landscape, and manufacturing capabilities of the leading players.
5. Product Development & Innovation: It offers intelligent insights on future technologies, R&D activities, and breakthrough product developments.
The report addresses key questions such as:
1. What is the market size and forecast of the On-Orbit Satellite Servicing Market?
2. Which products, segments, applications, and areas should one consider investing in over the forecast period in the On-Orbit Satellite Servicing Market?
3. What are the technology trends and regulatory frameworks in the On-Orbit Satellite Servicing Market?
4. What is the market share of the leading vendors in the On-Orbit Satellite Servicing Market?
5. Which modes and strategic moves are suitable for entering the On-Orbit Satellite Servicing Market?
Table of Contents
1. Preface
- 1.1. Objectives of the Study
- 1.2. Market Segmentation & Coverage
- 1.3. Years Considered for the Study
- 1.4. Currency & Pricing
- 1.5. Language
- 1.6. Limitations
- 1.7. Assumptions
- 1.8. Stakeholders
2. Research Methodology
- 2.1. Define: Research Objective
- 2.2. Determine: Research Design
- 2.3. Prepare: Research Instrument
- 2.4. Collect: Data Source
- 2.5. Analyze: Data Interpretation
- 2.6. Formulate: Data Verification
- 2.7. Publish: Research Report
- 2.8. Repeat: Report Update
3. Executive Summary
4. Market Overview
- 4.1. Introduction
- 4.2. On-Orbit Satellite Servicing Market, by Region
5. Market Insights
- 5.1. Market Dynamics
- 5.1.1. Drivers
- 5.1.1.1. Growing need for on-orbit satellite servicing with increasing aging satellite population
- 5.1.1.2. Increasing demand for geostationary satellites worldwide
- 5.1.2. Restraints
- 5.1.2.1. Technological complexity associated with on-orbit satellite servicing
- 5.1.3. Opportunities
- 5.1.3.1. Ongoing development in on-orbit satellite servicing
- 5.1.3.2. Rising government investments in military space communications
- 5.1.4. Challenges
- 5.1.4.1. Stringent regulations and guidelines regarding on-orbit satellite servicing
- 5.1.1. Drivers
- 5.2. Market Segmentation Analysis
- 5.2.1. Service Type: High demand for satellite refueling services to ensure the long-term efficiency of space-based satellites.
- 5.2.2. Satellite Type: Growing adoption of on-orbit satellite services by medium satellites to balance cost and performance.
- 5.2.3. Orbit: Significant advantages of medium earth orbit in navigation systems.
- 5.2.4. End-User: Increasing adoption by the defense sector to prioritize operational readiness and resilience.
- 5.3. Market Trend Analysis
- 5.4. Cumulative Impact of High Inflation
- 5.5. Porter's Five Forces Analysis
- 5.5.1. Threat of New Entrants
- 5.5.2. Threat of Substitutes
- 5.5.3. Bargaining Power of Customers
- 5.5.4. Bargaining Power of Suppliers
- 5.5.5. Industry Rivalry
- 5.6. Value Chain & Critical Path Analysis
- 5.7. Regulatory Framework
6. On-Orbit Satellite Servicing Market, by Service Type
- 6.1. Introduction
- 6.2. Active Debris Removal & Orbit Adjustment
- 6.3. Assembly
- 6.4. Refueling
- 6.5. Robotic Servicing
7. On-Orbit Satellite Servicing Market, by Satellite Type
- 7.1. Introduction
- 7.2. Large Satellite
- 7.3. Medium Satellite
- 7.4. Small Satellite
8. On-Orbit Satellite Servicing Market, by Orbit
- 8.1. Introduction
- 8.2. Geostationary Orbit
- 8.3. Low Earth Orbit (LEO)
- 8.4. Medium Earth Orbit (MEO)
9. On-Orbit Satellite Servicing Market, by End-User
- 9.1. Introduction
- 9.2. Commercial
- 9.3. Defense
10. Americas On-Orbit Satellite Servicing Market
- 10.1. Introduction
- 10.2. Argentina
- 10.3. Brazil
- 10.4. Canada
- 10.5. Mexico
- 10.6. United States
11. Asia-Pacific On-Orbit Satellite Servicing Market
- 11.1. Introduction
- 11.2. Australia
- 11.3. China
- 11.4. India
- 11.5. Indonesia
- 11.6. Japan
- 11.7. Malaysia
- 11.8. Philippines
- 11.9. Singapore
- 11.10. South Korea
- 11.11. Taiwan
- 11.12. Thailand
- 11.13. Vietnam
12. Europe, Middle East & Africa On-Orbit Satellite Servicing Market
- 12.1. Introduction
- 12.2. Denmark
- 12.3. Egypt
- 12.4. Finland
- 12.5. France
- 12.6. Germany
- 12.7. Israel
- 12.8. Italy
- 12.9. Netherlands
- 12.10. Nigeria
- 12.11. Norway
- 12.12. Poland
- 12.13. Qatar
- 12.14. Russia
- 12.15. Saudi Arabia
- 12.16. South Africa
- 12.17. Spain
- 12.18. Sweden
- 12.19. Switzerland
- 12.20. Turkey
- 12.21. United Arab Emirates
- 12.22. United Kingdom
13. Competitive Landscape
- 13.1. FPNV Positioning Matrix
- 13.2. Market Share Analysis, By Key Player
- 13.3. Competitive Scenario Analysis, By Key Player
- 13.3.1. Agreement, Collaboration, & Partnership
- 13.3.1.1. Italy awards $256 million contract for 2026 in-orbit servicing mission
- 13.3.2. New Product Launch & Enhancement
- 13.3.2.1. Lockheed Martin declares success demonstrating tech for in-orbit satellite servicing
- 13.3.3. Investment & Funding
- 13.3.3.1. U.S. Space Force and Astroscale to co-invest in a refueling satellite
- 13.3.1. Agreement, Collaboration, & Partnership
14. Competitive Portfolio
- 14.1. Key Company Profiles
- 14.1.1. Airbus SE
- 14.1.2. Altius Space Machines, Inc.
- 14.1.3. Astroscale Holdings Inc.
- 14.1.4. ClearSpace
- 14.1.5. D-Orbit SpA
- 14.1.6. Digantara
- 14.1.7. Lockheed Martin Corporation
- 14.1.8. Maxar Technologies Holdings Inc.
- 14.1.9. Momentus Inc.
- 14.1.10. Northrop Grumman Corporation
- 14.1.11. Obruta Space Solutions Corp.
- 14.1.12. Orbit Fab, Inc.
- 14.1.13. OrbitGuardians
- 14.1.14. Share My Space
- 14.1.15. Thales
- 14.1.16. Voyager Space Holdings, Inc.
- 14.2. Key Product Portfolio
15. Appendix
- 15.1. Discussion Guide
- 15.2. License & Pricing
LIST OF FIGURES
- FIGURE 1. ON-ORBIT SATELLITE SERVICING MARKET RESEARCH PROCESS
- FIGURE 2. ON-ORBIT SATELLITE SERVICING MARKET SIZE, 2023 VS 2030
- FIGURE 3. ON-ORBIT SATELLITE SERVICING MARKET SIZE, 2018-2030 (USD MILLION)
- FIGURE 4. ON-ORBIT SATELLITE SERVICING MARKET SIZE, BY REGION, 2023 VS 2030 (%)
- FIGURE 5. ON-ORBIT SATELLITE SERVICING MARKET SIZE, BY REGION, 2023 VS 2024 VS 2030 (USD MILLION)
- FIGURE 6. ON-ORBIT SATELLITE SERVICING MARKET DYNAMICS
- FIGURE 7. ON-ORBIT SATELLITE SERVICING MARKET SIZE, BY SERVICE TYPE, 2023 VS 2030 (%)
- FIGURE 8. ON-ORBIT SATELLITE SERVICING MARKET SIZE, BY SERVICE TYPE, 2023 VS 2024 VS 2030 (USD MILLION)
- FIGURE 9. ON-ORBIT SATELLITE SERVICING MARKET SIZE, BY SATELLITE TYPE, 2023 VS 2030 (%)
- FIGURE 10. ON-ORBIT SATELLITE SERVICING MARKET SIZE, BY SATELLITE TYPE, 2023 VS 2024 VS 2030 (USD MILLION)
- FIGURE 11. ON-ORBIT SATELLITE SERVICING MARKET SIZE, BY ORBIT, 2023 VS 2030 (%)
- FIGURE 12. ON-ORBIT SATELLITE SERVICING MARKET SIZE, BY ORBIT, 2023 VS 2024 VS 2030 (USD MILLION)
- FIGURE 13. ON-ORBIT SATELLITE SERVICING MARKET SIZE, BY END-USER, 2023 VS 2030 (%)
- FIGURE 14. ON-ORBIT SATELLITE SERVICING MARKET SIZE, BY END-USER, 2023 VS 2024 VS 2030 (USD MILLION)
- FIGURE 15. AMERICAS ON-ORBIT SATELLITE SERVICING MARKET SIZE, BY COUNTRY, 2023 VS 2030 (%)
- FIGURE 16. AMERICAS ON-ORBIT SATELLITE SERVICING MARKET SIZE, BY COUNTRY, 2023 VS 2024 VS 2030 (USD MILLION)
- FIGURE 17. UNITED STATES ON-ORBIT SATELLITE SERVICING MARKET SIZE, BY STATE, 2023 VS 2030 (%)
- FIGURE 18. UNITED STATES ON-ORBIT SATELLITE SERVICING MARKET SIZE, BY STATE, 2023 VS 2024 VS 2030 (USD MILLION)
- FIGURE 19. ASIA-PACIFIC ON-ORBIT SATELLITE SERVICING MARKET SIZE, BY COUNTRY, 2023 VS 2030 (%)
- FIGURE 20. ASIA-PACIFIC ON-ORBIT SATELLITE SERVICING MARKET SIZE, BY COUNTRY, 2023 VS 2024 VS 2030 (USD MILLION)
- FIGURE 21. EUROPE, MIDDLE EAST & AFRICA ON-ORBIT SATELLITE SERVICING MARKET SIZE, BY COUNTRY, 2023 VS 2030 (%)
- FIGURE 22. EUROPE, MIDDLE EAST & AFRICA ON-ORBIT SATELLITE SERVICING MARKET SIZE, BY COUNTRY, 2023 VS 2024 VS 2030 (USD MILLION)
- FIGURE 23. ON-ORBIT SATELLITE SERVICING MARKET, FPNV POSITIONING MATRIX, 2023
- FIGURE 24. ON-ORBIT SATELLITE SERVICING MARKET SHARE, BY KEY PLAYER, 2023
LIST OF TABLES
- TABLE 1. ON-ORBIT SATELLITE SERVICING MARKET SEGMENTATION & COVERAGE
- TABLE 2. UNITED STATES DOLLAR EXCHANGE RATE, 2018-2023
- TABLE 3. ON-ORBIT SATELLITE SERVICING MARKET SIZE, 2018-2030 (USD MILLION)
- TABLE 4. GLOBAL ON-ORBIT SATELLITE SERVICING MARKET SIZE, BY REGION, 2018-2030 (USD MILLION)
- TABLE 5. ON-ORBIT SATELLITE SERVICING MARKET SIZE, BY SERVICE TYPE, 2018-2030 (USD MILLION)
- TABLE 6. ON-ORBIT SATELLITE SERVICING MARKET SIZE, BY ACTIVE DEBRIS REMOVAL & ORBIT ADJUSTMENT, BY REGION, 2018-2030 (USD MILLION)
- TABLE 7. ON-ORBIT SATELLITE SERVICING MARKET SIZE, BY ASSEMBLY, BY REGION, 2018-2030 (USD MILLION)
- TABLE 8. ON-ORBIT SATELLITE SERVICING MARKET SIZE, BY REFUELING, BY REGION, 2018-2030 (USD MILLION)
- TABLE 9. ON-ORBIT SATELLITE SERVICING MARKET SIZE, BY ROBOTIC SERVICING, BY REGION, 2018-2030 (USD MILLION)
- TABLE 10. ON-ORBIT SATELLITE SERVICING MARKET SIZE, BY SATELLITE TYPE, 2018-2030 (USD MILLION)
- TABLE 11. ON-ORBIT SATELLITE SERVICING MARKET SIZE, BY LARGE SATELLITE, BY REGION, 2018-2030 (USD MILLION)
- TABLE 12. ON-ORBIT SATELLITE SERVICING MARKET SIZE, BY MEDIUM SATELLITE, BY REGION, 2018-2030 (USD MILLION)
- TABLE 13. ON-ORBIT SATELLITE SERVICING MARKET SIZE, BY SMALL SATELLITE, BY REGION, 2018-2030 (USD MILLION)
- TABLE 14. ON-ORBIT SATELLITE SERVICING MARKET SIZE, BY ORBIT, 2018-2030 (USD MILLION)
- TABLE 15. ON-ORBIT SATELLITE SERVICING MARKET SIZE, BY GEOSTATIONARY ORBIT, BY REGION, 2018-2030 (USD MILLION)
- TABLE 16. ON-ORBIT SATELLITE SERVICING MARKET SIZE, BY LOW EARTH ORBIT (LEO), BY REGION, 2018-2030 (USD MILLION)
- TABLE 17. ON-ORBIT SATELLITE SERVICING MARKET SIZE, BY MEDIUM EARTH ORBIT (MEO), BY REGION, 2018-2030 (USD MILLION)
- TABLE 18. ON-ORBIT SATELLITE SERVICING MARKET SIZE, BY END-USER, 2018-2030 (USD MILLION)
- TABLE 19. ON-ORBIT SATELLITE SERVICING MARKET SIZE, BY COMMERCIAL, BY REGION, 2018-2030 (USD MILLION)
- TABLE 20. ON-ORBIT SATELLITE SERVICING MARKET SIZE, BY DEFENSE, BY REGION, 2018-2030 (USD MILLION)
- TABLE 21. AMERICAS ON-ORBIT SATELLITE SERVICING MARKET SIZE, BY SERVICE TYPE, 2018-2030 (USD MILLION)
- TABLE 22. AMERICAS ON-ORBIT SATELLITE SERVICING MARKET SIZE, BY SATELLITE TYPE, 2018-2030 (USD MILLION)
- TABLE 23. AMERICAS ON-ORBIT SATELLITE SERVICING MARKET SIZE, BY ORBIT, 2018-2030 (USD MILLION)
- TABLE 24. AMERICAS ON-ORBIT SATELLITE SERVICING MARKET SIZE, BY END-USER, 2018-2030 (USD MILLION)
- TABLE 25. AMERICAS ON-ORBIT SATELLITE SERVICING MARKET SIZE, BY COUNTRY, 2018-2030 (USD MILLION)
- TABLE 26. ARGENTINA ON-ORBIT SATELLITE SERVICING MARKET SIZE, BY SERVICE TYPE, 2018-2030 (USD MILLION)
- TABLE 27. ARGENTINA ON-ORBIT SATELLITE SERVICING MARKET SIZE, BY SATELLITE TYPE, 2018-2030 (USD MILLION)
- TABLE 28. ARGENTINA ON-ORBIT SATELLITE SERVICING MARKET SIZE, BY ORBIT, 2018-2030 (USD MILLION)
- TABLE 29. ARGENTINA ON-ORBIT SATELLITE SERVICING MARKET SIZE, BY END-USER, 2018-2030 (USD MILLION)
- TABLE 30. BRAZIL ON-ORBIT SATELLITE SERVICING MARKET SIZE, BY SERVICE TYPE, 2018-2030 (USD MILLION)
- TABLE 31. BRAZIL ON-ORBIT SATELLITE SERVICING MARKET SIZE, BY SATELLITE TYPE, 2018-2030 (USD MILLION)
- TABLE 32. BRAZIL ON-ORBIT SATELLITE SERVICING MARKET SIZE, BY ORBIT, 2018-2030 (USD MILLION)
- TABLE 33. BRAZIL ON-ORBIT SATELLITE SERVICING MARKET SIZE, BY END-USER, 2018-2030 (USD MILLION)
- TABLE 34. CANADA ON-ORBIT SATELLITE SERVICING MARKET SIZE, BY SERVICE TYPE, 2018-2030 (USD MILLION)
- TABLE 35. CANADA ON-ORBIT SATELLITE SERVICING MARKET SIZE, BY SATELLITE TYPE, 2018-2030 (USD MILLION)
- TABLE 36. CANADA ON-ORBIT SATELLITE SERVICING MARKET SIZE, BY ORBIT, 2018-2030 (USD MILLION)
- TABLE 37. CANADA ON-ORBIT SATELLITE SERVICING MARKET SIZE, BY END-USER, 2018-2030 (USD MILLION)
- TABLE 38. MEXICO ON-ORBIT SATELLITE SERVICING MARKET SIZE, BY SERVICE TYPE, 2018-2030 (USD MILLION)
- TABLE 39. MEXICO ON-ORBIT SATELLITE SERVICING MARKET SIZE, BY SATELLITE TYPE, 2018-2030 (USD MILLION)
- TABLE 40. MEXICO ON-ORBIT SATELLITE SERVICING MARKET SIZE, BY ORBIT, 2018-2030 (USD MILLION)
- TABLE 41. MEXICO ON-ORBIT SATELLITE SERVICING MARKET SIZE, BY END-USER, 2018-2030 (USD MILLION)
- TABLE 42. UNITED STATES ON-ORBIT SATELLITE SERVICING MARKET SIZE, BY SERVICE TYPE, 2018-2030 (USD MILLION)
- TABLE 43. UNITED STATES ON-ORBIT SATELLITE SERVICING MARKET SIZE, BY SATELLITE TYPE, 2018-2030 (USD MILLION)
- TABLE 44. UNITED STATES ON-ORBIT SATELLITE SERVICING MARKET SIZE, BY ORBIT, 2018-2030 (USD MILLION)
- TABLE 45. UNITED STATES ON-ORBIT SATELLITE SERVICING MARKET SIZE, BY END-USER, 2018-2030 (USD MILLION)
- TABLE 46. UNITED STATES ON-ORBIT SATELLITE SERVICING MARKET SIZE, BY STATE, 2018-2030 (USD MILLION)
- TABLE 47. ASIA-PACIFIC ON-ORBIT SATELLITE SERVICING MARKET SIZE, BY SERVICE TYPE, 2018-2030 (USD MILLION)
- TABLE 48. ASIA-PACIFIC ON-ORBIT SATELLITE SERVICING MARKET SIZE, BY SATELLITE TYPE, 2018-2030 (USD MILLION)
- TABLE 49. ASIA-PACIFIC ON-ORBIT SATELLITE SERVICING MARKET SIZE, BY ORBIT, 2018-2030 (USD MILLION)
- TABLE 50. ASIA-PACIFIC ON-ORBIT SATELLITE SERVICING MARKET SIZE, BY END-USER, 2018-2030 (USD MILLION)
- TABLE 51. ASIA-PACIFIC ON-ORBIT SATELLITE SERVICING MARKET SIZE, BY COUNTRY, 2018-2030 (USD MILLION)
- TABLE 52. AUSTRALIA ON-ORBIT SATELLITE SERVICING MARKET SIZE, BY SERVICE TYPE, 2018-2030 (USD MILLION)
- TABLE 53. AUSTRALIA ON-ORBIT SATELLITE SERVICING MARKET SIZE, BY SATELLITE TYPE, 2018-2030 (USD MILLION)
- TABLE 54. AUSTRALIA ON-ORBIT SATELLITE SERVICING MARKET SIZE, BY ORBIT, 2018-2030 (USD MILLION)
- TABLE 55. AUSTRALIA ON-ORBIT SATELLITE SERVICING MARKET SIZE, BY END-USER, 2018-2030 (USD MILLION)
- TABLE 56. CHINA ON-ORBIT SATELLITE SERVICING MARKET SIZE, BY SERVICE TYPE, 2018-2030 (USD MILLION)
- TABLE 57. CHINA ON-ORBIT SATELLITE SERVICING MARKET SIZE, BY SATELLITE TYPE, 2018-2030 (USD MILLION)
- TABLE 58. CHINA ON-ORBIT SATELLITE SERVICING MARKET SIZE, BY ORBIT, 2018-2030 (USD MILLION)
- TABLE 59. CHINA ON-ORBIT SATELLITE SERVICING MARKET SIZE, BY END-USER, 2018-2030 (USD MILLION)
- TABLE 60. INDIA ON-ORBIT SATELLITE SERVICING MARKET SIZE, BY SERVICE TYPE, 2018-2030 (USD MILLION)
- TABLE 61. INDIA ON-ORBIT SATELLITE SERVICING MARKET SIZE, BY SATELLITE TYPE, 2018-2030 (USD MILLION)
- TABLE 62. INDIA ON-ORBIT SATELLITE SERVICING MARKET SIZE, BY ORBIT, 2018-2030 (USD MILLION)
- TABLE 63. INDIA ON-ORBIT SATELLITE SERVICING MARKET SIZE, BY END-USER, 2018-2030 (USD MILLION)
- TABLE 64. INDONESIA ON-ORBIT SATELLITE SERVICING MARKET SIZE, BY SERVICE TYPE, 2018-2030 (USD MILLION)
- TABLE 65. INDONESIA ON-ORBIT SATELLITE SERVICING MARKET SIZE, BY SATELLITE TYPE, 2018-2030 (USD MILLION)
- TABLE 66. INDONESIA ON-ORBIT SATELLITE SERVICING MARKET SIZE, BY ORBIT, 2018-2030 (USD MILLION)
- TABLE 67. INDONESIA ON-ORBIT SATELLITE SERVICING MARKET SIZE, BY END-USER, 2018-2030 (USD MILLION)
- TABLE 68. JAPAN ON-ORBIT SATELLITE SERVICING MARKET SIZE, BY SERVICE TYPE, 2018-2030 (USD MILLION)
- TABLE 69. JAPAN ON-ORBIT SATELLITE SERVICING MARKET SIZE, BY SATELLITE TYPE, 2018-2030 (USD MILLION)
- TABLE 70. JAPAN ON-ORBIT SATELLITE SERVICING MARKET SIZE, BY ORBIT, 2018-2030 (USD MILLION)
- TABLE 71. JAPAN ON-ORBIT SATELLITE SERVICING MARKET SIZE, BY END-USER, 2018-2030 (USD MILLION)
- TABLE 72. MALAYSIA ON-ORBIT SATELLITE SERVICING MARKET SIZE, BY SERVICE TYPE, 2018-2030 (USD MILLION)
- TABLE 73. MALAYSIA ON-ORBIT SATELLITE SERVICING MARKET SIZE, BY SATELLITE TYPE, 2018-2030 (USD MILLION)
- TABLE 74. MALAYSIA ON-ORBIT SATELLITE SERVICING MARKET SIZE, BY ORBIT, 2018-2030 (USD MILLION)
- TABLE 75. MALAYSIA ON-ORBIT SATELLITE SERVICING MARKET SIZE, BY END-USER, 2018-2030 (USD MILLION)
- TABLE 76. PHILIPPINES ON-ORBIT SATELLITE SERVICING MARKET SIZE, BY SERVICE TYPE, 2018-2030 (USD MILLION)
- TABLE 77. PHILIPPINES ON-ORBIT SATELLITE SERVICING MARKET SIZE, BY SATELLITE TYPE, 2018-2030 (USD MILLION)
- TABLE 78. PHILIPPINES ON-ORBIT SATELLITE SERVICING MARKET SIZE, BY ORBIT, 2018-2030 (USD MILLION)
- TABLE 79. PHILIPPINES ON-ORBIT SATELLITE SERVICING MARKET SIZE, BY END-USER, 2018-2030 (USD MILLION)
- TABLE 80. SINGAPORE ON-ORBIT SATELLITE SERVICING MARKET SIZE, BY SERVICE TYPE, 2018-2030 (USD MILLION)
- TABLE 81. SINGAPORE ON-ORBIT SATELLITE SERVICING MARKET SIZE, BY SATELLITE TYPE, 2018-2030 (USD MILLION)
- TABLE 82. SINGAPORE ON-ORBIT SATELLITE SERVICING MARKET SIZE, BY ORBIT, 2018-2030 (USD MILLION)
- TABLE 83. SINGAPORE ON-ORBIT SATELLITE SERVICING MARKET SIZE, BY END-USER, 2018-2030 (USD MILLION)
- TABLE 84. SOUTH KOREA ON-ORBIT SATELLITE SERVICING MARKET SIZE, BY SERVICE TYPE, 2018-2030 (USD MILLION)
- TABLE 85. SOUTH KOREA ON-ORBIT SATELLITE SERVICING MARKET SIZE, BY SATELLITE TYPE, 2018-2030 (USD MILLION)
- TABLE 86. SOUTH KOREA ON-ORBIT SATELLITE SERVICING MARKET SIZE, BY ORBIT, 2018-2030 (USD MILLION)
- TABLE 87. SOUTH KOREA ON-ORBIT SATELLITE SERVICING MARKET SIZE, BY END-USER, 2018-2030 (USD MILLION)
- TABLE 88. TAIWAN ON-ORBIT SATELLITE SERVICING MARKET SIZE, BY SERVICE TYPE, 2018-2030 (USD MILLION)
- TABLE 89. TAIWAN ON-ORBIT SATELLITE SERVICING MARKET SIZE, BY SATELLITE TYPE, 2018-2030 (USD MILLION)
- TABLE 90. TAIWAN ON-ORBIT SATELLITE SERVICING MARKET SIZE, BY ORBIT, 2018-2030 (USD MILLION)
- TABLE 91. TAIWAN ON-ORBIT SATELLITE SERVICING MARKET SIZE, BY END-USER, 2018-2030 (USD MILLION)
- TABLE 92. THAILAND ON-ORBIT SATELLITE SERVICING MARKET SIZE, BY SERVICE TYPE, 2018-2030 (USD MILLION)
- TABLE 93. THAILAND ON-ORBIT SATELLITE SERVICING MARKET SIZE, BY SATELLITE TYPE, 2018-2030 (USD MILLION)
- TABLE 94. THAILAND ON-ORBIT SATELLITE SERVICING MARKET SIZE, BY ORBIT, 2018-2030 (USD MILLION)
- TABLE 95. THAILAND ON-ORBIT SATELLITE SERVICING MARKET SIZE, BY END-USER, 2018-2030 (USD MILLION)
- TABLE 96. VIETNAM ON-ORBIT SATELLITE SERVICING MARKET SIZE, BY SERVICE TYPE, 2018-2030 (USD MILLION)
- TABLE 97. VIETNAM ON-ORBIT SATELLITE SERVICING MARKET SIZE, BY SATELLITE TYPE, 2018-2030 (USD MILLION)
- TABLE 98. VIETNAM ON-ORBIT SATELLITE SERVICING MARKET SIZE, BY ORBIT, 2018-2030 (USD MILLION)
- TABLE 99. VIETNAM ON-ORBIT SATELLITE SERVICING MARKET SIZE, BY END-USER, 2018-2030 (USD MILLION)
- TABLE 100. EUROPE, MIDDLE EAST & AFRICA ON-ORBIT SATELLITE SERVICING MARKET SIZE, BY SERVICE TYPE, 2018-2030 (USD MILLION)
- TABLE 101. EUROPE, MIDDLE EAST & AFRICA ON-ORBIT SATELLITE SERVICING MARKET SIZE, BY SATELLITE TYPE, 2018-2030 (USD MILLION)
- TABLE 102. EUROPE, MIDDLE EAST & AFRICA ON-ORBIT SATELLITE SERVICING MARKET SIZE, BY ORBIT, 2018-2030 (USD MILLION)
- TABLE 103. EUROPE, MIDDLE EAST & AFRICA ON-ORBIT SATELLITE SERVICING MARKET SIZE, BY END-USER, 2018-2030 (USD MILLION)
- TABLE 104. EUROPE, MIDDLE EAST & AFRICA ON-ORBIT SATELLITE SERVICING MARKET SIZE, BY COUNTRY, 2018-2030 (USD MILLION)
- TABLE 105. DENMARK ON-ORBIT SATELLITE SERVICING MARKET SIZE, BY SERVICE TYPE, 2018-2030 (USD MILLION)
- TABLE 106. DENMARK ON-ORBIT SATELLITE SERVICING MARKET SIZE, BY SATELLITE TYPE, 2018-2030 (USD MILLION)
- TABLE 107. DENMARK ON-ORBIT SATELLITE SERVICING MARKET SIZE, BY ORBIT, 2018-2030 (USD MILLION)
- TABLE 108. DENMARK ON-ORBIT SATELLITE SERVICING MARKET SIZE, BY END-USER, 2018-2030 (USD MILLION)
- TABLE 109. EGYPT ON-ORBIT SATELLITE SERVICING MARKET SIZE, BY SERVICE TYPE, 2018-2030 (USD MILLION)
- TABLE 110. EGYPT ON-ORBIT SATELLITE SERVICING MARKET SIZE, BY SATELLITE TYPE, 2018-2030 (USD MILLION)
- TABLE 111. EGYPT ON-ORBIT SATELLITE SERVICING MARKET SIZE, BY ORBIT, 2018-2030 (USD MILLION)
- TABLE 112. EGYPT ON-ORBIT SATELLITE SERVICING MARKET SIZE, BY END-USER, 2018-2030 (USD MILLION)
- TABLE 113. FINLAND ON-ORBIT SATELLITE SERVICING MARKET SIZE, BY SERVICE TYPE, 2018-2030 (USD MILLION)
- TABLE 114. FINLAND ON-ORBIT SATELLITE SERVICING MARKET SIZE, BY SATELLITE TYPE, 2018-2030 (USD MILLION)
- TABLE 115. FINLAND ON-ORBIT SATELLITE SERVICING MARKET SIZE, BY ORBIT, 2018-2030 (USD MILLION)
- TABLE 116. FINLAND ON-ORBIT SATELLITE SERVICING MARKET SIZE, BY END-USER, 2018-2030 (USD MILLION)
- TABLE 117. FRANCE ON-ORBIT SATELLITE SERVICING MARKET SIZE, BY SERVICE TYPE, 2018-2030 (USD MILLION)
- TABLE 118. FRANCE ON-ORBIT SATELLITE SERVICING MARKET SIZE, BY SATELLITE TYPE, 2018-2030 (USD MILLION)
- TABLE 119. FRANCE ON-ORBIT SATELLITE SERVICING MARKET SIZE, BY ORBIT, 2018-2030 (USD MILLION)
- TABLE 120. FRANCE ON-ORBIT SATELLITE SERVICING MARKET SIZE, BY END-USER, 2018-2030 (USD MILLION)
- TABLE 121. GERMANY ON-ORBIT SATELLITE SERVICING MARKET SIZE, BY SERVICE TYPE, 2018-2030 (USD MILLION)
- TABLE 122. GERMANY ON-ORBIT SATELLITE SERVICING MARKET SIZE, BY SATELLITE TYPE, 2018-2030 (USD MILLION)
- TABLE 123. GERMANY ON-ORBIT SATELLITE SERVICING MARKET SIZE, BY ORBIT, 2018-2030 (USD MILLION)
- TABLE 124. GERMANY ON-ORBIT SATELLITE SERVICING MARKET SIZE, BY END-USER, 2018-2030 (USD MILLION)
- TABLE 125. ISRAEL ON-ORBIT SATELLITE SERVICING MARKET SIZE, BY SERVICE TYPE, 2018-2030 (USD MILLION)
- TABLE 126. ISRAEL ON-ORBIT SATELLITE SERVICING MARKET SIZE, BY SATELLITE TYPE, 2018-2030 (USD MILLION)
- TABLE 127. ISRAEL ON-ORBIT SATELLITE SERVICING MARKET SIZE, BY ORBIT, 2018-2030 (USD MILLION)
- TABLE 128. ISRAEL ON-ORBIT SATELLITE SERVICING MARKET SIZE, BY END-USER, 2018-2030 (USD MILLION)
- TABLE 129. ITALY ON-ORBIT SATELLITE SERVICING MARKET SIZE, BY SERVICE TYPE, 2018-2030 (USD MILLION)
- TABLE 130. ITALY ON-ORBIT SATELLITE SERVICING MARKET SIZE, BY SATELLITE TYPE, 2018-2030 (USD MILLION)
- TABLE 131. ITALY ON-ORBIT SATELLITE SERVICING MARKET SIZE, BY ORBIT, 2018-2030 (USD MILLION)
- TABLE 132. ITALY ON-ORBIT SATELLITE SERVICING MARKET SIZE, BY END-USER, 2018-2030 (USD MILLION)
- TABLE 133. NETHERLANDS ON-ORBIT SATELLITE SERVICING MARKET SIZE, BY SERVICE TYPE, 2018-2030 (USD MILLION)
- TABLE 134. NETHERLANDS ON-ORBIT SATELLITE SERVICING MARKET SIZE, BY SATELLITE TYPE, 2018-2030 (USD MILLION)
- TABLE 135. NETHERLANDS ON-ORBIT SATELLITE SERVICING MARKET SIZE, BY ORBIT, 2018-2030 (USD MILLION)
- TABLE 136. NETHERLANDS ON-ORBIT SATELLITE SERVICING MARKET SIZE, BY END-USER, 2018-2030 (USD MILLION)
- TABLE 137. NIGERIA ON-ORBIT SATELLITE SERVICING MARKET SIZE, BY SERVICE TYPE, 2018-2030 (USD MILLION)
- TABLE 138. NIGERIA ON-ORBIT SATELLITE SERVICING MARKET SIZE, BY SATELLITE TYPE, 2018-2030 (USD MILLION)
- TABLE 139. NIGERIA ON-ORBIT SATELLITE SERVICING MARKET SIZE, BY ORBIT, 2018-2030 (USD MILLION)
- TABLE 140. NIGERIA ON-ORBIT SATELLITE SERVICING MARKET SIZE, BY END-USER, 2018-2030 (USD MILLION)
- TABLE 141. NORWAY ON-ORBIT SATELLITE SERVICING MARKET SIZE, BY SERVICE TYPE, 2018-2030 (USD MILLION)
- TABLE 142. NORWAY ON-ORBIT SATELLITE SERVICING MARKET SIZE, BY SATELLITE TYPE, 2018-2030 (USD MILLION)
- TABLE 143. NORWAY ON-ORBIT SATELLITE SERVICING MARKET SIZE, BY ORBIT, 2018-2030 (USD MILLION)
- TABLE 144. NORWAY ON-ORBIT SATELLITE SERVICING MARKET SIZE, BY END-USER, 2018-2030 (USD MILLION)
- TABLE 145. POLAND ON-ORBIT SATELLITE SERVICING MARKET SIZE, BY SERVICE TYPE, 2018-2030 (USD MILLION)
- TABLE 146. POLAND ON-ORBIT SATELLITE SERVICING MARKET SIZE, BY SATELLITE TYPE, 2018-2030 (USD MILLION)
- TABLE 147. POLAND ON-ORBIT SATELLITE SERVICING MARKET SIZE, BY ORBIT, 2018-2030 (USD MILLION)
- TABLE 148. POLAND ON-ORBIT SATELLITE SERVICING MARKET SIZE, BY END-USER, 2018-2030 (USD MILLION)
- TABLE 149. QATAR ON-ORBIT SATELLITE SERVICING MARKET SIZE, BY SERVICE TYPE, 2018-2030 (USD MILLION)
- TABLE 150. QATAR ON-ORBIT SATELLITE SERVICING MARKET SIZE, BY SATELLITE TYPE, 2018-2030 (USD MILLION)
- TABLE 151. QATAR ON-ORBIT SATELLITE SERVICING MARKET SIZE, BY ORBIT, 2018-2030 (USD MILLION)
- TABLE 152. QATAR ON-ORBIT SATELLITE SERVICING MARKET SIZE, BY END-USER, 2018-2030 (USD MILLION)
- TABLE 153. RUSSIA ON-ORBIT SATELLITE SERVICING MARKET SIZE, BY SERVICE TYPE, 2018-2030 (USD MILLION)
- TABLE 154. RUSSIA ON-ORBIT SATELLITE SERVICING MARKET SIZE, BY SATELLITE TYPE, 2018-2030 (USD MILLION)
- TABLE 155. RUSSIA ON-ORBIT SATELLITE SERVICING MARKET SIZE, BY ORBIT, 2018-2030 (USD MILLION)
- TABLE 156. RUSSIA ON-ORBIT SATELLITE SERVICING MARKET SIZE, BY END-USER, 2018-2030 (USD MILLION)
- TABLE 157. SAUDI ARABIA ON-ORBIT SATELLITE SERVICING MARKET SIZE, BY SERVICE TYPE, 2018-2030 (USD MILLION)
- TABLE 158. SAUDI ARABIA ON-ORBIT SATELLITE SERVICING MARKET SIZE, BY SATELLITE TYPE, 2018-2030 (USD MILLION)
- TABLE 159. SAUDI ARABIA ON-ORBIT SATELLITE SERVICING MARKET SIZE, BY ORBIT, 2018-2030 (USD MILLION)
- TABLE 160. SAUDI ARABIA ON-ORBIT SATELLITE SERVICING MARKET SIZE, BY END-USER, 2018-2030 (USD MILLION)
- TABLE 161. SOUTH AFRICA ON-ORBIT SATELLITE SERVICING MARKET SIZE, BY SERVICE TYPE, 2018-2030 (USD MILLION)
- TABLE 162. SOUTH AFRICA ON-ORBIT SATELLITE SERVICING MARKET SIZE, BY SATELLITE TYPE, 2018-2030 (USD MILLION)
- TABLE 163. SOUTH AFRICA ON-ORBIT SATELLITE SERVICING MARKET SIZE, BY ORBIT, 2018-2030 (USD MILLION)
- TABLE 164. SOUTH AFRICA ON-ORBIT SATELLITE SERVICING MARKET SIZE, BY END-USER, 2018-2030 (USD MILLION)
- TABLE 165. SPAIN ON-ORBIT SATELLITE SERVICING MARKET SIZE, BY SERVICE TYPE, 2018-2030 (USD MILLION)
- TABLE 166. SPAIN ON-ORBIT SATELLITE SERVICING MARKET SIZE, BY SATELLITE TYPE, 2018-2030 (USD MILLION)
- TABLE 167. SPAIN ON-ORBIT SATELLITE SERVICING MARKET SIZE, BY ORBIT, 2018-2030 (USD MILLION)
- TABLE 168. SPAIN ON-ORBIT SATELLITE SERVICING MARKET SIZE, BY END-USER, 2018-2030 (USD MILLION)
- TABLE 169. SWEDEN ON-ORBIT SATELLITE SERVICING MARKET SIZE, BY SERVICE TYPE, 2018-2030 (USD MILLION)
- TABLE 170. SWEDEN ON-ORBIT SATELLITE SERVICING MARKET SIZE, BY SATELLITE TYPE, 2018-2030 (USD MILLION)
- TABLE 171. SWEDEN ON-ORBIT SATELLITE SERVICING MARKET SIZE, BY ORBIT, 2018-2030 (USD MILLION)
- TABLE 172. SWEDEN ON-ORBIT SATELLITE SERVICING MARKET SIZE, BY END-USER, 2018-2030 (USD MILLION)
- TABLE 173. SWITZERLAND ON-ORBIT SATELLITE SERVICING MARKET SIZE, BY SERVICE TYPE, 2018-2030 (USD MILLION)
- TABLE 174. SWITZERLAND ON-ORBIT SATELLITE SERVICING MARKET SIZE, BY SATELLITE TYPE, 2018-2030 (USD MILLION)
- TABLE 175. SWITZERLAND ON-ORBIT SATELLITE SERVICING MARKET SIZE, BY ORBIT, 2018-2030 (USD MILLION)
- TABLE 176. SWITZERLAND ON-ORBIT SATELLITE SERVICING MARKET SIZE, BY END-USER, 2018-2030 (USD MILLION)
- TABLE 177. TURKEY ON-ORBIT SATELLITE SERVICING MARKET SIZE, BY SERVICE TYPE, 2018-2030 (USD MILLION)
- TABLE 178. TURKEY ON-ORBIT SATELLITE SERVICING MARKET SIZE, BY SATELLITE TYPE, 2018-2030 (USD MILLION)
- TABLE 179. TURKEY ON-ORBIT SATELLITE SERVICING MARKET SIZE, BY ORBIT, 2018-2030 (USD MILLION)
- TABLE 180. TURKEY ON-ORBIT SATELLITE SERVICING MARKET SIZE, BY END-USER, 2018-2030 (USD MILLION)
- TABLE 181. UNITED ARAB EMIRATES ON-ORBIT SATELLITE SERVICING MARKET SIZE, BY SERVICE TYPE, 2018-2030 (USD MILLION)
- TABLE 182. UNITED ARAB EMIRATES ON-ORBIT SATELLITE SERVICING MARKET SIZE, BY SATELLITE TYPE, 2018-2030 (USD MILLION)
- TABLE 183. UNITED ARAB EMIRATES ON-ORBIT SATELLITE SERVICING MARKET SIZE, BY ORBIT, 2018-2030 (USD MILLION)
- TABLE 184. UNITED ARAB EMIRATES ON-ORBIT SATELLITE SERVICING MARKET SIZE, BY END-USER, 2018-2030 (USD MILLION)
- TABLE 185. UNITED KINGDOM ON-ORBIT SATELLITE SERVICING MARKET SIZE, BY SERVICE TYPE, 2018-2030 (USD MILLION)
- TABLE 186. UNITED KINGDOM ON-ORBIT SATELLITE SERVICING MARKET SIZE, BY SATELLITE TYPE, 2018-2030 (USD MILLION)
- TABLE 187. UNITED KINGDOM ON-ORBIT SATELLITE SERVICING MARKET SIZE, BY ORBIT, 2018-2030 (USD MILLION)
- TABLE 188. UNITED KINGDOM ON-ORBIT SATELLITE SERVICING MARKET SIZE, BY END-USER, 2018-2030 (USD MILLION)
- TABLE 189. ON-ORBIT SATELLITE SERVICING MARKET, FPNV POSITIONING MATRIX, 2023
- TABLE 190. ON-ORBIT SATELLITE SERVICING MARKET SHARE, BY KEY PLAYER, 2023
- TABLE 191. ON-ORBIT SATELLITE SERVICING MARKET LICENSE & PRICING
 嵌入式卫星系统市场:2024-2034年
 2024 年卫星全球市场报告
 卫星对接系统市场:按服务类型、太空船类型、最终用户划分 - 全球预测 2024-2030
 卫星指挥与控制系统市场:按组件、安装类型、平台、频宽、应用和最终用户 - 2024-2030 年全球预测
 商业卫星组件市场:按组件、品质等级划分 - 2024-2030 年全球预测
 基于卫星的物联网服务市场:按类型、频宽、组织规模和服务划分 - 2024-2030 年全球预测
 卫星 5G 新无线电市场:按服务、频段和最终用户划分 - 全球预测 2024-2030 年
 卫星指挥与控制 (C2) 系统:市场与技术预测(~2032 年)
 大型卫星推进和 AOCS 子系统的全球市场:按应用、最终用户、子系统和地区进行分析和预测(2023-2033 年)
 全球地球静止轨道卫星市场(2023-2033)