


 |
市场调查报告书
商品编码
1434171
5G 企业市场:按设备、组织规模和最终用户划分 - 全球预测 2023-20305G Enterprise Market by Equipment (Distributed Antenna System, Radio Node, Service Node), Organization Size (Large Enterprises, SMEs), End User - Global Forecast 2023-2030 |
||||||
※ 本网页内容可能与最新版本有所差异。详细情况请与我们联繫。
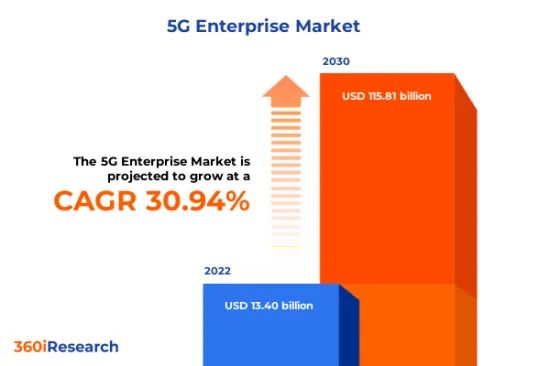
预计2022年5G企业市场规模为134亿美元,预计2023年将达173亿美元,2030年将达1,158.1亿美元,复合年增长率为30.94%。
5G企业全球市场
| 主要市场统计 | |
|---|---|
| 基准年[2022] | 134亿美元 |
| 预测年份 [2023] | 173亿美元 |
| 预测年份 [2030] | 1158.1亿美元 |
| 复合年增长率(%) | 30.94% |
5G企业是指5G技术在业务领域的应用与适配,旨在提高业务效率、改善业务流程、提供创新服务和客户体验。这包括部署根据企业(从中小型企业到大型企业)的特定需求量身定制的 5G 网路和服务。与传统技术相比,这种新一代无线技术可提供显着更高的速度、更低的延迟和更高的容量,并用于物联网 (IoT)、工业自动化、智慧建筑和企业内部即时资料分析等众多应用环境、启用使用案例。由于物联网设备和行动连接的增加,资料流量迅速增加正在推动市场成长。为了实现云端基础、扩增实境实境和虚拟实境等应用程式对更高频宽和更低延迟的业务需求,正在推动 5G 的采用不断增加。然而,高昂的初始基础设施投资和营运成本限制了企业范围内的 5G 部署。此外,有关资料隐私和网路漏洞的安全性疑虑正在阻碍市场的成长。此外,满足中小企业需求的 5G 解决方案的开发以及保护 5G 网路基础设施的网路安全产品和服务的投资正在为 5G 扩展创造重要机会。
区域洞察
在美洲地区,5G部署进展迅速,重点是企业解决方案和工业自动化增强。消费者对高速资料和物联网 (IoT) 的需求正在推动市场成长,而通讯巨头则继续大力投资基础设施和频谱。美洲地区顺应这一趋势,专注于建立强大的5G网路以支持智慧城市和数位健康倡议。这些地区的客户购买行为倾向于可靠、安全的网路解决方案,从而在业务运营中获得竞争优势。欧盟正大力投资5G基础设施,以刺激创新和经济成长,而消费者的需求则集中在效率和永续性。欧洲政府的研究倡议强调了欧洲对引领全球技术标准的承诺。中东地区正在快速部署 5G 以应对多样化的经济挑战,并大力投资智慧城市计划。非洲 5G 市场正处于起步阶段,行动网路存取和企业解决方案需求不断增长,推动了其采用。亚太地区是5G技术的关键地区,中国处于部署的最前沿,体现在广泛的商业使用和融入工业应用中。中国消费者对 5G 服务的需求是由渴望实施工业 4.0 能力的强劲製造业所推动的。日本正在采用5G来提高技术力,特别是在机器人和智慧城市解决方案方面。由于年轻人口的快速成长和智慧型手机普及的提高,印度市场潜力巨大。
FPNV定位矩阵
FPNV定位矩阵对于评估5G企业市场至关重要。我们检视与业务策略和产品满意度相关的关键指标,以对供应商进行全面评估。这种深入的分析使用户能够根据自己的要求做出明智的决策。根据评估,供应商被分为四个成功程度不同的像限:前沿(F)、探路者(P)、利基(N)和重要(V)。
市场占有率分析
市场占有率分析是一个综合工具,可以对 5G 企业市场供应商的现状进行深入而深入的研究。全面比较和分析供应商在整体收益、基本客群和其他关键指标方面的贡献,以便更好地了解公司的绩效及其在争夺市场占有率时面临的挑战。此外,该分析还提供了对该行业竞争特征的宝贵见解,包括在研究基准年观察到的累积、分散主导地位和合併特征等因素。这种详细程度的提高使供应商能够做出更明智的决策并制定有效的策略,从而在市场上获得竞争优势。
该报告对以下几个方面提供了宝贵的见解:
1-市场渗透率:提供有关主要企业所服务的市场的全面资讯。
2-市场开拓:我们深入研究利润丰厚的新兴市场,并分析它们在成熟细分市场中的渗透率。
3- 市场多元化:提供有关新产品发布、开拓地区、最新发展和投资的详细资讯。
4-竞争力评估与资讯:对主要企业的市场占有率、策略、产品、认证、监管状况、专利状况、製造能力等进行全面评估。
5- 产品开发与创新:提供对未来技术、研发活动和突破性产品开发的见解。
本报告解决了以下关键问题:
1-5G企业市场的市场规模和预测是多少?
2-5G企业市场预测期间需要考虑投资的产品、细分市场、应用程式和领域有哪些?
3-5G企业市场的技术趋势和法律规范是什么?
4-5G企业市场主要厂商的市场占有率是多少?
5-进入5G企业市场的合适型态和策略手段是什么?
目录
第一章 前言
第二章调查方法
第三章执行摘要
第四章市场概况
第五章市场洞察
- 市场动态
- 促进因素
- 随着工业 4.0 的发展,对更快速度和改善网路覆盖的需求
- 5G 改善了最终用户产业的视讯监控和检测前景
- 连网汽车技术的采用增加
- 抑制因素
- 与 5G 技术相关的覆盖不均匀问题
- 5G 基础设施现有的限制
- 机会
- 5G企业在能源、製造和物流领域的新用途
- 中小型企业的 5G 网路前景更加广阔
- 任务
- 与安全性和配置相关的问题
- 促进因素
- 市场区隔分析
- 设备:增加优先分散式天线系统,增强大型高层建筑和高密度区域的室内无线覆盖
- 组织规模:大型企业由于其管理的资料的敏感性而优先考虑强大的安全通讯协定。
- 最终用户:政府扩大 5G 在智慧城市基础设施和军事通讯网路中的使用
- 市场趋势分析
- COVID-19 的累积影响
- 俄罗斯-乌克兰衝突的累积影响
- 高通膨的累积效应
- 波特五力分析
- 价值炼和关键路径分析
- 法律规范
- 客户客製化
第六章 5G企业市场:依设备划分
- 分散式天线系统
- 无线节点
- 服务节点
第七章 5G 企业市场:依组织规模
- 大公司
- 中小企业
第 8 章 5G 企业市场:依最终用户划分
- 农业
- 车
- BFSI
- 政府和国防
- 医疗保健和生命科学
- 资讯科技
- 製造业
- 媒体与娱乐
- 零售与电子商务
- 运输和物流
第九章美洲5G企业市场
- 阿根廷
- 巴西
- 加拿大
- 墨西哥
- 美国
第十章 亚太地区5G企业市场
- 澳洲
- 中国
- 印度
- 印尼
- 日本
- 马来西亚
- 菲律宾
- 新加坡
- 韩国
- 台湾
- 泰国
- 越南
第十一章欧洲、中东和非洲5G企业市场
- 丹麦
- 埃及
- 芬兰
- 法国
- 德国
- 以色列
- 义大利
- 荷兰
- 奈及利亚
- 挪威
- 波兰
- 卡达
- 俄罗斯
- 沙乌地阿拉伯
- 南非
- 西班牙
- 瑞典
- 瑞士
- 土耳其
- 阿拉伯聯合大公国
- 英国
第十二章竞争形势
- FPNV定位矩阵
- 市场占有率分析:主要企业
- 主要企业竞争情境分析
- 合约、合作和伙伴关係
- 新产品发布和功能增强
第13章竞争产品组合
- 主要公司简介
- Affirmed Networks, Inc. by Microsoft Corporation
- Airspan Networks Holdings Inc.
- American Tower Corporation
- AT&T Inc.
- Ciena Corporation
- Cisco Systems, Inc.
- Comba Telecom Systems Holdings Limited
- CommScope, Inc.
- Extreme Networks, Inc.
- FiberHome Telecommunication Technologies Co., Ltd.
- Fujitsu Limited
- Hewlett Packard Enterprise Company
- Huawei Technologies Co., Ltd.
- Juniper Networks, Inc.
- Mavenir Systems, Inc.
- NEC Corporation
- Nokia Corporation
- Parallel Wireless, Inc.
- Samsung Electronics Co., Ltd.
- SK Inc.
- T-Mobile USA, Inc. by Deutsche Telekom AG
- Telefonaktiebolaget LM Ericsson
- Verizon Communications Inc.
- VMware, Inc. by Broadcom Inc.
- VVDN Technologies
- ZTE Corporation
- 主要产品系列
第十四章附录
- 讨论指南
- 关于许可证和定价
[192 Pages Report] The 5G Enterprise Market size was estimated at USD 13.40 billion in 2022 and expected to reach USD 17.30 billion in 2023, at a CAGR 30.94% to reach USD 115.81 billion by 2030.
Global 5G Enterprise Market
| KEY MARKET STATISTICS | |
|---|---|
| Base Year [2022] | USD 13.40 billion |
| Estimated Year [2023] | USD 17.30 billion |
| Forecast Year [2030] | USD 115.81 billion |
| CAGR (%) | 30.94% |
5G Enterprise refers to the application and adaptation of 5G technology within the business sector to enhance operational efficiency, improve business processes, and provide innovative services and customer experiences. It encompasses the deployment of 5G networks and services tailored to the explicit needs of enterprises, ranging from small businesses to large corporations. This next generation of wireless technology offers significantly higher speed, lower latency, and greater capacity compared to its predecessors, enabling a multitude of use cases such as the Internet of Things (IoT), industrial automation, smart buildings, and real-time data analytics within an enterprise environment. The exponential increase in data traffic due to the rise in IoT devices and mobile connectivity is driving the growth of the market. Business requirements for higher bandwidth and lower latency to enable applications such as cloud-based services and augmented reality & virtual reality, increasing deployment of 5G. However, high initial infrastructure investment and operational costs limit the adoption of 5G across enterprises. Security concerns related to data privacy and network vulnerabilities hinder market growth. Furthermore, the development of 5G solutions that cater to the necessities of small and medium-sized enterprises (SMEs) and investment in cybersecurity products and services to protect the 5G network infrastructure pose significant opportunities for 5G expansion.
Regional Insights
In the American region, 5G deployment is advancing rapidly, with an emphasis on enhancing enterprise solutions and industrial automation. The consumer needs for high-speed data and the Internet of Things (IoT) drives market growth, while telecommunications giants continue to invest heavily in infrastructure and spectrum. The American region is paralleling this trend, focusing on establishing robust 5G networks to support smart cities and digital health initiatives. Customer purchasing behaviors in these regions gravitate towards reliable and secure network solutions that enable a competitive edge in business operations. The EU is heavily investing in 5G infrastructure to stimulate innovation and economic growth, with consumer needs centered around efficiency and sustainability. Research initiatives by the European governments underline Europe's commitment to leading global technological standards. The Middle East is rapidly adopting 5G to support diversified economic agendas, with significant investments in smart city projects. Africa's 5G market is at an embryonic stage, with adoption driven by a growing demand for mobile Internet access and enterprise solutions. Asia Pacific is a key region in 5G technology, with China at the forefront of deployment, manifesting through extensive commercial use and integration in industrial applications. Consumer demand for 5G services in China is driven by a robust manufacturing sector eager to embrace Industry 4.0 capabilities. Japan is adopting 5G to improve its technological prowess, specifically in robotics and smart city solutions. In India, the market holds significant potential due to a burgeoning young population and increasing smartphone penetration.
FPNV Positioning Matrix
The FPNV Positioning Matrix is pivotal in evaluating the 5G Enterprise Market. It offers a comprehensive assessment of vendors, examining key metrics related to Business Strategy and Product Satisfaction. This in-depth analysis empowers users to make well-informed decisions aligned with their requirements. Based on the evaluation, the vendors are then categorized into four distinct quadrants representing varying levels of success: Forefront (F), Pathfinder (P), Niche (N), or Vital (V).
Market Share Analysis
The Market Share Analysis is a comprehensive tool that provides an insightful and in-depth examination of the current state of vendors in the 5G Enterprise Market. By meticulously comparing and analyzing vendor contributions in terms of overall revenue, customer base, and other key metrics, we can offer companies a greater understanding of their performance and the challenges they face when competing for market share. Additionally, this analysis provides valuable insights into the competitive nature of the sector, including factors such as accumulation, fragmentation dominance, and amalgamation traits observed over the base year period studied. With this expanded level of detail, vendors can make more informed decisions and devise effective strategies to gain a competitive edge in the market.
Key Company Profiles
The report delves into recent significant developments in the 5G Enterprise Market, highlighting leading vendors and their innovative profiles. These include Affirmed Networks, Inc. by Microsoft Corporation, Airspan Networks Holdings Inc., American Tower Corporation, AT&T Inc., Ciena Corporation, Cisco Systems, Inc., Comba Telecom Systems Holdings Limited, CommScope, Inc., Extreme Networks, Inc., FiberHome Telecommunication Technologies Co., Ltd., Fujitsu Limited, Hewlett Packard Enterprise Company, Huawei Technologies Co., Ltd., Juniper Networks, Inc., Mavenir Systems, Inc., NEC Corporation, Nokia Corporation, Parallel Wireless, Inc., Samsung Electronics Co., Ltd., SK Inc., T-Mobile USA, Inc. by Deutsche Telekom AG, Telefonaktiebolaget LM Ericsson, Verizon Communications Inc., VMware, Inc. by Broadcom Inc., VVDN Technologies, and ZTE Corporation.
Market Segmentation & Coverage
This research report categorizes the 5G Enterprise Market to forecast the revenues and analyze trends in each of the following sub-markets:
- Equipment
- Distributed Antenna System
- Radio Node
- Service Node
- Organization Size
- Large Enterprises
- SMEs
- End User
- Agriculture
- Automotive
- BFSI
- Government & Defense
- Healthcare & Life Sciences
- Information Technology
- Manufacturing
- Media & Entertainment
- Retail & Ecommerce
- Transportation & Logistics
- Region
- Americas
- Argentina
- Brazil
- Canada
- Mexico
- United States
- California
- Florida
- Illinois
- New York
- Ohio
- Pennsylvania
- Texas
- Asia-Pacific
- Australia
- China
- India
- Indonesia
- Japan
- Malaysia
- Philippines
- Singapore
- South Korea
- Taiwan
- Thailand
- Vietnam
- Europe, Middle East & Africa
- Denmark
- Egypt
- Finland
- France
- Germany
- Israel
- Italy
- Netherlands
- Nigeria
- Norway
- Poland
- Qatar
- Russia
- Saudi Arabia
- South Africa
- Spain
- Sweden
- Switzerland
- Turkey
- United Arab Emirates
- United Kingdom
- Americas
The report offers valuable insights on the following aspects:
1. Market Penetration: It presents comprehensive information on the market provided by key players.
2. Market Development: It delves deep into lucrative emerging markets and analyzes the penetration across mature market segments.
3. Market Diversification: It provides detailed information on new product launches, untapped geographic regions, recent developments, and investments.
4. Competitive Assessment & Intelligence: It conducts an exhaustive assessment of market shares, strategies, products, certifications, regulatory approvals, patent landscape, and manufacturing capabilities of the leading players.
5. Product Development & Innovation: It offers intelligent insights on future technologies, R&D activities, and breakthrough product developments.
The report addresses key questions such as:
1. What is the market size and forecast of the 5G Enterprise Market?
2. Which products, segments, applications, and areas should one consider investing in over the forecast period in the 5G Enterprise Market?
3. What are the technology trends and regulatory frameworks in the 5G Enterprise Market?
4. What is the market share of the leading vendors in the 5G Enterprise Market?
5. Which modes and strategic moves are suitable for entering the 5G Enterprise Market?
Table of Contents
1. Preface
- 1.1. Objectives of the Study
- 1.2. Market Segmentation & Coverage
- 1.3. Years Considered for the Study
- 1.4. Currency & Pricing
- 1.5. Language
- 1.6. Limitations
- 1.7. Assumptions
- 1.8. Stakeholders
2. Research Methodology
- 2.1. Define: Research Objective
- 2.2. Determine: Research Design
- 2.3. Prepare: Research Instrument
- 2.4. Collect: Data Source
- 2.5. Analyze: Data Interpretation
- 2.6. Formulate: Data Verification
- 2.7. Publish: Research Report
- 2.8. Repeat: Report Update
3. Executive Summary
4. Market Overview
- 4.1. Introduction
- 4.2. 5G Enterprise Market, by Region
5. Market Insights
- 5.1. Market Dynamics
- 5.1.1. Drivers
- 5.1.1.1. Demand for High Speed and Improved Network Coverage with Development of Industry 4.0
- 5.1.1.2. Improving Prospect of Video Monitoring and Detection Across End-User Industries with 5G
- 5.1.1.3. Increasing Adoption of Connected Vehicle Technologies
- 5.1.2. Restraints
- 5.1.2.1. Uneven Coverage Issues Associated with 5G Technology
- 5.1.2.2. Existing Limitations in 5G Infrastructure
- 5.1.3. Opportunities
- 5.1.3.1. Emerging Use of 5G enterprises in Energy, Manufacturing & Logistic Sectors
- 5.1.3.2. Increasing 5G Network Vista across Small-Medium Enterprises
- 5.1.4. Challenges
- 5.1.4.1. Issues Associated with Security and Configurations
- 5.1.1. Drivers
- 5.2. Market Segmentation Analysis
- 5.2.1. Equipment: Growing preference distributed antenna system to enhance indoor wireless coverage over large multi-story buildings and high-density areas
- 5.2.2. Organization Size: Large enterprises prioritize robust security protocols due to the sensitive nature of the data they manage
- 5.2.3. End User: Expanding utilization of 5G in smart city infrastructure and military communication networks by the government
- 5.3. Market Trend Analysis
- 5.4. Cumulative Impact of COVID-19
- 5.5. Cumulative Impact of Russia-Ukraine Conflict
- 5.6. Cumulative Impact of High Inflation
- 5.7. Porter's Five Forces Analysis
- 5.7.1. Threat of New Entrants
- 5.7.2. Threat of Substitutes
- 5.7.3. Bargaining Power of Customers
- 5.7.4. Bargaining Power of Suppliers
- 5.7.5. Industry Rivalry
- 5.8. Value Chain & Critical Path Analysis
- 5.9. Regulatory Framework
- 5.10. Client Customization
6. 5G Enterprise Market, by Equipment
- 6.1. Introduction
- 6.2. Distributed Antenna System
- 6.3. Radio Node
- 6.4. Service Node
7. 5G Enterprise Market, by Organization Size
- 7.1. Introduction
- 7.2. Large Enterprises
- 7.3. SMEs
8. 5G Enterprise Market, by End User
- 8.1. Introduction
- 8.2. Agriculture
- 8.3. Automotive
- 8.4. BFSI
- 8.5. Government & Defense
- 8.6. Healthcare & Life Sciences
- 8.7. Information Technology
- 8.8. Manufacturing
- 8.9. Media & Entertainment
- 8.10. Retail & Ecommerce
- 8.11. Transportation & Logistics
9. Americas 5G Enterprise Market
- 9.1. Introduction
- 9.2. Argentina
- 9.3. Brazil
- 9.4. Canada
- 9.5. Mexico
- 9.6. United States
10. Asia-Pacific 5G Enterprise Market
- 10.1. Introduction
- 10.2. Australia
- 10.3. China
- 10.4. India
- 10.5. Indonesia
- 10.6. Japan
- 10.7. Malaysia
- 10.8. Philippines
- 10.9. Singapore
- 10.10. South Korea
- 10.11. Taiwan
- 10.12. Thailand
- 10.13. Vietnam
11. Europe, Middle East & Africa 5G Enterprise Market
- 11.1. Introduction
- 11.2. Denmark
- 11.3. Egypt
- 11.4. Finland
- 11.5. France
- 11.6. Germany
- 11.7. Israel
- 11.8. Italy
- 11.9. Netherlands
- 11.10. Nigeria
- 11.11. Norway
- 11.12. Poland
- 11.13. Qatar
- 11.14. Russia
- 11.15. Saudi Arabia
- 11.16. South Africa
- 11.17. Spain
- 11.18. Sweden
- 11.19. Switzerland
- 11.20. Turkey
- 11.21. United Arab Emirates
- 11.22. United Kingdom
12. Competitive Landscape
- 12.1. FPNV Positioning Matrix
- 12.2. Market Share Analysis, By Key Player
- 12.3. Competitive Scenario Analysis, By Key Player
- 12.3.1. Agreement, Collaboration, & Partnership
- 12.3.1.1. HPE completes acquisition of private 5G leader Athonet
- 12.3.2. New Product Launch & Enhancement
- 12.3.2.1. Ericsson and AgriBusiness Connect pursue 5G enterprise potential in Australia's agriculture sector
- 12.3.2.2. VVDN launches end to end Private 5G Solution for Enterprises for SI, OEMs, Telcos
- 12.3.1. Agreement, Collaboration, & Partnership
13. Competitive Portfolio
- 13.1. Key Company Profiles
- 13.1.1. Affirmed Networks, Inc. by Microsoft Corporation
- 13.1.2. Airspan Networks Holdings Inc.
- 13.1.3. American Tower Corporation
- 13.1.4. AT&T Inc.
- 13.1.5. Ciena Corporation
- 13.1.6. Cisco Systems, Inc.
- 13.1.7. Comba Telecom Systems Holdings Limited
- 13.1.8. CommScope, Inc.
- 13.1.9. Extreme Networks, Inc.
- 13.1.10. FiberHome Telecommunication Technologies Co., Ltd.
- 13.1.11. Fujitsu Limited
- 13.1.12. Hewlett Packard Enterprise Company
- 13.1.13. Huawei Technologies Co., Ltd.
- 13.1.14. Juniper Networks, Inc.
- 13.1.15. Mavenir Systems, Inc.
- 13.1.16. NEC Corporation
- 13.1.17. Nokia Corporation
- 13.1.18. Parallel Wireless, Inc.
- 13.1.19. Samsung Electronics Co., Ltd.
- 13.1.20. SK Inc.
- 13.1.21. T-Mobile USA, Inc. by Deutsche Telekom AG
- 13.1.22. Telefonaktiebolaget LM Ericsson
- 13.1.23. Verizon Communications Inc.
- 13.1.24. VMware, Inc. by Broadcom Inc.
- 13.1.25. VVDN Technologies
- 13.1.26. ZTE Corporation
- 13.2. Key Product Portfolio
14. Appendix
- 14.1. Discussion Guide
- 14.2. License & Pricing
LIST OF FIGURES
- FIGURE 1. 5G ENTERPRISE MARKET RESEARCH PROCESS
- FIGURE 2. 5G ENTERPRISE MARKET SIZE, 2022 VS 2030
- FIGURE 3. 5G ENTERPRISE MARKET SIZE, 2018-2030 (USD MILLION)
- FIGURE 4. 5G ENTERPRISE MARKET SIZE, BY REGION, 2022 VS 2030 (%)
- FIGURE 5. 5G ENTERPRISE MARKET SIZE, BY REGION, 2022 VS 2023 VS 2030 (USD MILLION)
- FIGURE 6. 5G ENTERPRISE MARKET DYNAMICS
- FIGURE 7. 5G ENTERPRISE MARKET SIZE, BY EQUIPMENT, 2022 VS 2030 (%)
- FIGURE 8. 5G ENTERPRISE MARKET SIZE, BY EQUIPMENT, 2022 VS 2023 VS 2030 (USD MILLION)
- FIGURE 9. 5G ENTERPRISE MARKET SIZE, BY ORGANIZATION SIZE, 2022 VS 2030 (%)
- FIGURE 10. 5G ENTERPRISE MARKET SIZE, BY ORGANIZATION SIZE, 2022 VS 2023 VS 2030 (USD MILLION)
- FIGURE 11. 5G ENTERPRISE MARKET SIZE, BY END USER, 2022 VS 2030 (%)
- FIGURE 12. 5G ENTERPRISE MARKET SIZE, BY END USER, 2022 VS 2023 VS 2030 (USD MILLION)
- FIGURE 13. AMERICAS 5G ENTERPRISE MARKET SIZE, BY COUNTRY, 2022 VS 2030 (%)
- FIGURE 14. AMERICAS 5G ENTERPRISE MARKET SIZE, BY COUNTRY, 2022 VS 2023 VS 2030 (USD MILLION)
- FIGURE 15. UNITED STATES 5G ENTERPRISE MARKET SIZE, BY STATE, 2022 VS 2030 (%)
- FIGURE 16. UNITED STATES 5G ENTERPRISE MARKET SIZE, BY STATE, 2022 VS 2023 VS 2030 (USD MILLION)
- FIGURE 17. ASIA-PACIFIC 5G ENTERPRISE MARKET SIZE, BY COUNTRY, 2022 VS 2030 (%)
- FIGURE 18. ASIA-PACIFIC 5G ENTERPRISE MARKET SIZE, BY COUNTRY, 2022 VS 2023 VS 2030 (USD MILLION)
- FIGURE 19. EUROPE, MIDDLE EAST & AFRICA 5G ENTERPRISE MARKET SIZE, BY COUNTRY, 2022 VS 2030 (%)
- FIGURE 20. EUROPE, MIDDLE EAST & AFRICA 5G ENTERPRISE MARKET SIZE, BY COUNTRY, 2022 VS 2023 VS 2030 (USD MILLION)
- FIGURE 21. 5G ENTERPRISE MARKET, FPNV POSITIONING MATRIX, 2022
- FIGURE 22. 5G ENTERPRISE MARKET SHARE, BY KEY PLAYER, 2022
LIST OF TABLES
- TABLE 1. 5G ENTERPRISE MARKET SEGMENTATION & COVERAGE
- TABLE 2. UNITED STATES DOLLAR EXCHANGE RATE, 2018-2022
- TABLE 3. 5G ENTERPRISE MARKET SIZE, 2018-2030 (USD MILLION)
- TABLE 4. GLOBAL 5G ENTERPRISE MARKET SIZE, BY REGION, 2018-2030 (USD MILLION)
- TABLE 5. 5G ENTERPRISE MARKET SIZE, BY EQUIPMENT, 2018-2030 (USD MILLION)
- TABLE 6. 5G ENTERPRISE MARKET SIZE, BY DISTRIBUTED ANTENNA SYSTEM, BY REGION, 2018-2030 (USD MILLION)
- TABLE 7. 5G ENTERPRISE MARKET SIZE, BY RADIO NODE, BY REGION, 2018-2030 (USD MILLION)
- TABLE 8. 5G ENTERPRISE MARKET SIZE, BY SERVICE NODE, BY REGION, 2018-2030 (USD MILLION)
- TABLE 9. 5G ENTERPRISE MARKET SIZE, BY ORGANIZATION SIZE, 2018-2030 (USD MILLION)
- TABLE 10. 5G ENTERPRISE MARKET SIZE, BY LARGE ENTERPRISES, BY REGION, 2018-2030 (USD MILLION)
- TABLE 11. 5G ENTERPRISE MARKET SIZE, BY SMES, BY REGION, 2018-2030 (USD MILLION)
- TABLE 12. 5G ENTERPRISE MARKET SIZE, BY END USER, 2018-2030 (USD MILLION)
- TABLE 13. 5G ENTERPRISE MARKET SIZE, BY AGRICULTURE, BY REGION, 2018-2030 (USD MILLION)
- TABLE 14. 5G ENTERPRISE MARKET SIZE, BY AUTOMOTIVE, BY REGION, 2018-2030 (USD MILLION)
- TABLE 15. 5G ENTERPRISE MARKET SIZE, BY BFSI, BY REGION, 2018-2030 (USD MILLION)
- TABLE 16. 5G ENTERPRISE MARKET SIZE, BY GOVERNMENT & DEFENSE, BY REGION, 2018-2030 (USD MILLION)
- TABLE 17. 5G ENTERPRISE MARKET SIZE, BY HEALTHCARE & LIFE SCIENCES, BY REGION, 2018-2030 (USD MILLION)
- TABLE 18. 5G ENTERPRISE MARKET SIZE, BY INFORMATION TECHNOLOGY, BY REGION, 2018-2030 (USD MILLION)
- TABLE 19. 5G ENTERPRISE MARKET SIZE, BY MANUFACTURING, BY REGION, 2018-2030 (USD MILLION)
- TABLE 20. 5G ENTERPRISE MARKET SIZE, BY MEDIA & ENTERTAINMENT, BY REGION, 2018-2030 (USD MILLION)
- TABLE 21. 5G ENTERPRISE MARKET SIZE, BY RETAIL & ECOMMERCE, BY REGION, 2018-2030 (USD MILLION)
- TABLE 22. 5G ENTERPRISE MARKET SIZE, BY TRANSPORTATION & LOGISTICS, BY REGION, 2018-2030 (USD MILLION)
- TABLE 23. AMERICAS 5G ENTERPRISE MARKET SIZE, BY EQUIPMENT, 2018-2030 (USD MILLION)
- TABLE 24. AMERICAS 5G ENTERPRISE MARKET SIZE, BY ORGANIZATION SIZE, 2018-2030 (USD MILLION)
- TABLE 25. AMERICAS 5G ENTERPRISE MARKET SIZE, BY END USER, 2018-2030 (USD MILLION)
- TABLE 26. AMERICAS 5G ENTERPRISE MARKET SIZE, BY COUNTRY, 2018-2030 (USD MILLION)
- TABLE 27. ARGENTINA 5G ENTERPRISE MARKET SIZE, BY EQUIPMENT, 2018-2030 (USD MILLION)
- TABLE 28. ARGENTINA 5G ENTERPRISE MARKET SIZE, BY ORGANIZATION SIZE, 2018-2030 (USD MILLION)
- TABLE 29. ARGENTINA 5G ENTERPRISE MARKET SIZE, BY END USER, 2018-2030 (USD MILLION)
- TABLE 30. BRAZIL 5G ENTERPRISE MARKET SIZE, BY EQUIPMENT, 2018-2030 (USD MILLION)
- TABLE 31. BRAZIL 5G ENTERPRISE MARKET SIZE, BY ORGANIZATION SIZE, 2018-2030 (USD MILLION)
- TABLE 32. BRAZIL 5G ENTERPRISE MARKET SIZE, BY END USER, 2018-2030 (USD MILLION)
- TABLE 33. CANADA 5G ENTERPRISE MARKET SIZE, BY EQUIPMENT, 2018-2030 (USD MILLION)
- TABLE 34. CANADA 5G ENTERPRISE MARKET SIZE, BY ORGANIZATION SIZE, 2018-2030 (USD MILLION)
- TABLE 35. CANADA 5G ENTERPRISE MARKET SIZE, BY END USER, 2018-2030 (USD MILLION)
- TABLE 36. MEXICO 5G ENTERPRISE MARKET SIZE, BY EQUIPMENT, 2018-2030 (USD MILLION)
- TABLE 37. MEXICO 5G ENTERPRISE MARKET SIZE, BY ORGANIZATION SIZE, 2018-2030 (USD MILLION)
- TABLE 38. MEXICO 5G ENTERPRISE MARKET SIZE, BY END USER, 2018-2030 (USD MILLION)
- TABLE 39. UNITED STATES 5G ENTERPRISE MARKET SIZE, BY EQUIPMENT, 2018-2030 (USD MILLION)
- TABLE 40. UNITED STATES 5G ENTERPRISE MARKET SIZE, BY ORGANIZATION SIZE, 2018-2030 (USD MILLION)
- TABLE 41. UNITED STATES 5G ENTERPRISE MARKET SIZE, BY END USER, 2018-2030 (USD MILLION)
- TABLE 42. UNITED STATES 5G ENTERPRISE MARKET SIZE, BY STATE, 2018-2030 (USD MILLION)
- TABLE 43. ASIA-PACIFIC 5G ENTERPRISE MARKET SIZE, BY EQUIPMENT, 2018-2030 (USD MILLION)
- TABLE 44. ASIA-PACIFIC 5G ENTERPRISE MARKET SIZE, BY ORGANIZATION SIZE, 2018-2030 (USD MILLION)
- TABLE 45. ASIA-PACIFIC 5G ENTERPRISE MARKET SIZE, BY END USER, 2018-2030 (USD MILLION)
- TABLE 46. ASIA-PACIFIC 5G ENTERPRISE MARKET SIZE, BY COUNTRY, 2018-2030 (USD MILLION)
- TABLE 47. AUSTRALIA 5G ENTERPRISE MARKET SIZE, BY EQUIPMENT, 2018-2030 (USD MILLION)
- TABLE 48. AUSTRALIA 5G ENTERPRISE MARKET SIZE, BY ORGANIZATION SIZE, 2018-2030 (USD MILLION)
- TABLE 49. AUSTRALIA 5G ENTERPRISE MARKET SIZE, BY END USER, 2018-2030 (USD MILLION)
- TABLE 50. CHINA 5G ENTERPRISE MARKET SIZE, BY EQUIPMENT, 2018-2030 (USD MILLION)
- TABLE 51. CHINA 5G ENTERPRISE MARKET SIZE, BY ORGANIZATION SIZE, 2018-2030 (USD MILLION)
- TABLE 52. CHINA 5G ENTERPRISE MARKET SIZE, BY END USER, 2018-2030 (USD MILLION)
- TABLE 53. INDIA 5G ENTERPRISE MARKET SIZE, BY EQUIPMENT, 2018-2030 (USD MILLION)
- TABLE 54. INDIA 5G ENTERPRISE MARKET SIZE, BY ORGANIZATION SIZE, 2018-2030 (USD MILLION)
- TABLE 55. INDIA 5G ENTERPRISE MARKET SIZE, BY END USER, 2018-2030 (USD MILLION)
- TABLE 56. INDONESIA 5G ENTERPRISE MARKET SIZE, BY EQUIPMENT, 2018-2030 (USD MILLION)
- TABLE 57. INDONESIA 5G ENTERPRISE MARKET SIZE, BY ORGANIZATION SIZE, 2018-2030 (USD MILLION)
- TABLE 58. INDONESIA 5G ENTERPRISE MARKET SIZE, BY END USER, 2018-2030 (USD MILLION)
- TABLE 59. JAPAN 5G ENTERPRISE MARKET SIZE, BY EQUIPMENT, 2018-2030 (USD MILLION)
- TABLE 60. JAPAN 5G ENTERPRISE MARKET SIZE, BY ORGANIZATION SIZE, 2018-2030 (USD MILLION)
- TABLE 61. JAPAN 5G ENTERPRISE MARKET SIZE, BY END USER, 2018-2030 (USD MILLION)
- TABLE 62. MALAYSIA 5G ENTERPRISE MARKET SIZE, BY EQUIPMENT, 2018-2030 (USD MILLION)
- TABLE 63. MALAYSIA 5G ENTERPRISE MARKET SIZE, BY ORGANIZATION SIZE, 2018-2030 (USD MILLION)
- TABLE 64. MALAYSIA 5G ENTERPRISE MARKET SIZE, BY END USER, 2018-2030 (USD MILLION)
- TABLE 65. PHILIPPINES 5G ENTERPRISE MARKET SIZE, BY EQUIPMENT, 2018-2030 (USD MILLION)
- TABLE 66. PHILIPPINES 5G ENTERPRISE MARKET SIZE, BY ORGANIZATION SIZE, 2018-2030 (USD MILLION)
- TABLE 67. PHILIPPINES 5G ENTERPRISE MARKET SIZE, BY END USER, 2018-2030 (USD MILLION)
- TABLE 68. SINGAPORE 5G ENTERPRISE MARKET SIZE, BY EQUIPMENT, 2018-2030 (USD MILLION)
- TABLE 69. SINGAPORE 5G ENTERPRISE MARKET SIZE, BY ORGANIZATION SIZE, 2018-2030 (USD MILLION)
- TABLE 70. SINGAPORE 5G ENTERPRISE MARKET SIZE, BY END USER, 2018-2030 (USD MILLION)
- TABLE 71. SOUTH KOREA 5G ENTERPRISE MARKET SIZE, BY EQUIPMENT, 2018-2030 (USD MILLION)
- TABLE 72. SOUTH KOREA 5G ENTERPRISE MARKET SIZE, BY ORGANIZATION SIZE, 2018-2030 (USD MILLION)
- TABLE 73. SOUTH KOREA 5G ENTERPRISE MARKET SIZE, BY END USER, 2018-2030 (USD MILLION)
- TABLE 74. TAIWAN 5G ENTERPRISE MARKET SIZE, BY EQUIPMENT, 2018-2030 (USD MILLION)
- TABLE 75. TAIWAN 5G ENTERPRISE MARKET SIZE, BY ORGANIZATION SIZE, 2018-2030 (USD MILLION)
- TABLE 76. TAIWAN 5G ENTERPRISE MARKET SIZE, BY END USER, 2018-2030 (USD MILLION)
- TABLE 77. THAILAND 5G ENTERPRISE MARKET SIZE, BY EQUIPMENT, 2018-2030 (USD MILLION)
- TABLE 78. THAILAND 5G ENTERPRISE MARKET SIZE, BY ORGANIZATION SIZE, 2018-2030 (USD MILLION)
- TABLE 79. THAILAND 5G ENTERPRISE MARKET SIZE, BY END USER, 2018-2030 (USD MILLION)
- TABLE 80. VIETNAM 5G ENTERPRISE MARKET SIZE, BY EQUIPMENT, 2018-2030 (USD MILLION)
- TABLE 81. VIETNAM 5G ENTERPRISE MARKET SIZE, BY ORGANIZATION SIZE, 2018-2030 (USD MILLION)
- TABLE 82. VIETNAM 5G ENTERPRISE MARKET SIZE, BY END USER, 2018-2030 (USD MILLION)
- TABLE 83. EUROPE, MIDDLE EAST & AFRICA 5G ENTERPRISE MARKET SIZE, BY EQUIPMENT, 2018-2030 (USD MILLION)
- TABLE 84. EUROPE, MIDDLE EAST & AFRICA 5G ENTERPRISE MARKET SIZE, BY ORGANIZATION SIZE, 2018-2030 (USD MILLION)
- TABLE 85. EUROPE, MIDDLE EAST & AFRICA 5G ENTERPRISE MARKET SIZE, BY END USER, 2018-2030 (USD MILLION)
- TABLE 86. EUROPE, MIDDLE EAST & AFRICA 5G ENTERPRISE MARKET SIZE, BY COUNTRY, 2018-2030 (USD MILLION)
- TABLE 87. DENMARK 5G ENTERPRISE MARKET SIZE, BY EQUIPMENT, 2018-2030 (USD MILLION)
- TABLE 88. DENMARK 5G ENTERPRISE MARKET SIZE, BY ORGANIZATION SIZE, 2018-2030 (USD MILLION)
- TABLE 89. DENMARK 5G ENTERPRISE MARKET SIZE, BY END USER, 2018-2030 (USD MILLION)
- TABLE 90. EGYPT 5G ENTERPRISE MARKET SIZE, BY EQUIPMENT, 2018-2030 (USD MILLION)
- TABLE 91. EGYPT 5G ENTERPRISE MARKET SIZE, BY ORGANIZATION SIZE, 2018-2030 (USD MILLION)
- TABLE 92. EGYPT 5G ENTERPRISE MARKET SIZE, BY END USER, 2018-2030 (USD MILLION)
- TABLE 93. FINLAND 5G ENTERPRISE MARKET SIZE, BY EQUIPMENT, 2018-2030 (USD MILLION)
- TABLE 94. FINLAND 5G ENTERPRISE MARKET SIZE, BY ORGANIZATION SIZE, 2018-2030 (USD MILLION)
- TABLE 95. FINLAND 5G ENTERPRISE MARKET SIZE, BY END USER, 2018-2030 (USD MILLION)
- TABLE 96. FRANCE 5G ENTERPRISE MARKET SIZE, BY EQUIPMENT, 2018-2030 (USD MILLION)
- TABLE 97. FRANCE 5G ENTERPRISE MARKET SIZE, BY ORGANIZATION SIZE, 2018-2030 (USD MILLION)
- TABLE 98. FRANCE 5G ENTERPRISE MARKET SIZE, BY END USER, 2018-2030 (USD MILLION)
- TABLE 99. GERMANY 5G ENTERPRISE MARKET SIZE, BY EQUIPMENT, 2018-2030 (USD MILLION)
- TABLE 100. GERMANY 5G ENTERPRISE MARKET SIZE, BY ORGANIZATION SIZE, 2018-2030 (USD MILLION)
- TABLE 101. GERMANY 5G ENTERPRISE MARKET SIZE, BY END USER, 2018-2030 (USD MILLION)
- TABLE 102. ISRAEL 5G ENTERPRISE MARKET SIZE, BY EQUIPMENT, 2018-2030 (USD MILLION)
- TABLE 103. ISRAEL 5G ENTERPRISE MARKET SIZE, BY ORGANIZATION SIZE, 2018-2030 (USD MILLION)
- TABLE 104. ISRAEL 5G ENTERPRISE MARKET SIZE, BY END USER, 2018-2030 (USD MILLION)
- TABLE 105. ITALY 5G ENTERPRISE MARKET SIZE, BY EQUIPMENT, 2018-2030 (USD MILLION)
- TABLE 106. ITALY 5G ENTERPRISE MARKET SIZE, BY ORGANIZATION SIZE, 2018-2030 (USD MILLION)
- TABLE 107. ITALY 5G ENTERPRISE MARKET SIZE, BY END USER, 2018-2030 (USD MILLION)
- TABLE 108. NETHERLANDS 5G ENTERPRISE MARKET SIZE, BY EQUIPMENT, 2018-2030 (USD MILLION)
- TABLE 109. NETHERLANDS 5G ENTERPRISE MARKET SIZE, BY ORGANIZATION SIZE, 2018-2030 (USD MILLION)
- TABLE 110. NETHERLANDS 5G ENTERPRISE MARKET SIZE, BY END USER, 2018-2030 (USD MILLION)
- TABLE 111. NIGERIA 5G ENTERPRISE MARKET SIZE, BY EQUIPMENT, 2018-2030 (USD MILLION)
- TABLE 112. NIGERIA 5G ENTERPRISE MARKET SIZE, BY ORGANIZATION SIZE, 2018-2030 (USD MILLION)
- TABLE 113. NIGERIA 5G ENTERPRISE MARKET SIZE, BY END USER, 2018-2030 (USD MILLION)
- TABLE 114. NORWAY 5G ENTERPRISE MARKET SIZE, BY EQUIPMENT, 2018-2030 (USD MILLION)
- TABLE 115. NORWAY 5G ENTERPRISE MARKET SIZE, BY ORGANIZATION SIZE, 2018-2030 (USD MILLION)
- TABLE 116. NORWAY 5G ENTERPRISE MARKET SIZE, BY END USER, 2018-2030 (USD MILLION)
- TABLE 117. POLAND 5G ENTERPRISE MARKET SIZE, BY EQUIPMENT, 2018-2030 (USD MILLION)
- TABLE 118. POLAND 5G ENTERPRISE MARKET SIZE, BY ORGANIZATION SIZE, 2018-2030 (USD MILLION)
- TABLE 119. POLAND 5G ENTERPRISE MARKET SIZE, BY END USER, 2018-2030 (USD MILLION)
- TABLE 120. QATAR 5G ENTERPRISE MARKET SIZE, BY EQUIPMENT, 2018-2030 (USD MILLION)
- TABLE 121. QATAR 5G ENTERPRISE MARKET SIZE, BY ORGANIZATION SIZE, 2018-2030 (USD MILLION)
- TABLE 122. QATAR 5G ENTERPRISE MARKET SIZE, BY END USER, 2018-2030 (USD MILLION)
- TABLE 123. RUSSIA 5G ENTERPRISE MARKET SIZE, BY EQUIPMENT, 2018-2030 (USD MILLION)
- TABLE 124. RUSSIA 5G ENTERPRISE MARKET SIZE, BY ORGANIZATION SIZE, 2018-2030 (USD MILLION)
- TABLE 125. RUSSIA 5G ENTERPRISE MARKET SIZE, BY END USER, 2018-2030 (USD MILLION)
- TABLE 126. SAUDI ARABIA 5G ENTERPRISE MARKET SIZE, BY EQUIPMENT, 2018-2030 (USD MILLION)
- TABLE 127. SAUDI ARABIA 5G ENTERPRISE MARKET SIZE, BY ORGANIZATION SIZE, 2018-2030 (USD MILLION)
- TABLE 128. SAUDI ARABIA 5G ENTERPRISE MARKET SIZE, BY END USER, 2018-2030 (USD MILLION)
- TABLE 129. SOUTH AFRICA 5G ENTERPRISE MARKET SIZE, BY EQUIPMENT, 2018-2030 (USD MILLION)
- TABLE 130. SOUTH AFRICA 5G ENTERPRISE MARKET SIZE, BY ORGANIZATION SIZE, 2018-2030 (USD MILLION)
- TABLE 131. SOUTH AFRICA 5G ENTERPRISE MARKET SIZE, BY END USER, 2018-2030 (USD MILLION)
- TABLE 132. SPAIN 5G ENTERPRISE MARKET SIZE, BY EQUIPMENT, 2018-2030 (USD MILLION)
- TABLE 133. SPAIN 5G ENTERPRISE MARKET SIZE, BY ORGANIZATION SIZE, 2018-2030 (USD MILLION)
- TABLE 134. SPAIN 5G ENTERPRISE MARKET SIZE, BY END USER, 2018-2030 (USD MILLION)
- TABLE 135. SWEDEN 5G ENTERPRISE MARKET SIZE, BY EQUIPMENT, 2018-2030 (USD MILLION)
- TABLE 136. SWEDEN 5G ENTERPRISE MARKET SIZE, BY ORGANIZATION SIZE, 2018-2030 (USD MILLION)
- TABLE 137. SWEDEN 5G ENTERPRISE MARKET SIZE, BY END USER, 2018-2030 (USD MILLION)
- TABLE 138. SWITZERLAND 5G ENTERPRISE MARKET SIZE, BY EQUIPMENT, 2018-2030 (USD MILLION)
- TABLE 139. SWITZERLAND 5G ENTERPRISE MARKET SIZE, BY ORGANIZATION SIZE, 2018-2030 (USD MILLION)
- TABLE 140. SWITZERLAND 5G ENTERPRISE MARKET SIZE, BY END USER, 2018-2030 (USD MILLION)
- TABLE 141. TURKEY 5G ENTERPRISE MARKET SIZE, BY EQUIPMENT, 2018-2030 (USD MILLION)
- TABLE 142. TURKEY 5G ENTERPRISE MARKET SIZE, BY ORGANIZATION SIZE, 2018-2030 (USD MILLION)
- TABLE 143. TURKEY 5G ENTERPRISE MARKET SIZE, BY END USER, 2018-2030 (USD MILLION)
- TABLE 144. UNITED ARAB EMIRATES 5G ENTERPRISE MARKET SIZE, BY EQUIPMENT, 2018-2030 (USD MILLION)
- TABLE 145. UNITED ARAB EMIRATES 5G ENTERPRISE MARKET SIZE, BY ORGANIZATION SIZE, 2018-2030 (USD MILLION)
- TABLE 146. UNITED ARAB EMIRATES 5G ENTERPRISE MARKET SIZE, BY END USER, 2018-2030 (USD MILLION)
- TABLE 147. UNITED KINGDOM 5G ENTERPRISE MARKET SIZE, BY EQUIPMENT, 2018-2030 (USD MILLION)
- TABLE 148. UNITED KINGDOM 5G ENTERPRISE MARKET SIZE, BY ORGANIZATION SIZE, 2018-2030 (USD MILLION)
- TABLE 149. UNITED KINGDOM 5G ENTERPRISE MARKET SIZE, BY END USER, 2018-2030 (USD MILLION)
- TABLE 150. 5G ENTERPRISE MARKET, FPNV POSITIONING MATRIX, 2022
- TABLE 151. 5G ENTERPRISE MARKET SHARE, BY KEY PLAYER, 2022
- TABLE 152. 5G ENTERPRISE MARKET LICENSE & PRICING
 5G企业报告:到2030年的趋势、预测和竞争分析
 5G企业市场、份额、规模、趋势、行业分析报告:按接入设备、按核心网路技术、按服务、按组织规模、按最终用途、按地区、按细分市场、预测,2023-2032年
 5G企业全球市场
 5G企业市场:2023-2028年全球行业趋势、份额、规模、增长、机会及预测
 5G企业的全球市场 - 产业分析,规模,占有率,成长,趋势,预测(2023年~2030年):各产品,各技术,各等级,各用途,各终端用户,各地区
 5G 企业市场 - 增长、趋势、COVID-19 影响和预测 (2023-2028)
 5G企业的全球市场规模:各网路类型,各基础设施,各组织规模,各用途,各产业,各地区的预测(2022年~2028年)