


 |
市场调查报告书
商品编码
1434298
PEX 市场:按类型、技术、最终用户划分 - 2024-2030 年全球预测PEX Market by Type (High-Density Polyethylene, Low-Density Polyethylene, Medium-Density Polyethylene), Technology (Electron Beam Processing, Engel Method, Silane Grafting), End-User - Global Forecast 2024-2030 |
||||||
※ 本网页内容可能与最新版本有所差异。详细情况请与我们联繫。
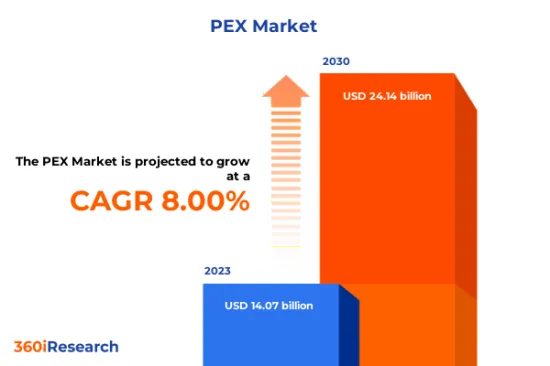
预计2023年PEX市场规模为140.7亿美元,2024年达150.8亿美元,预计2030年将达到241.4亿美元,复合年增长率为8.00%。
PEX全球市场
| 主要市场统计 | |
|---|---|
| 基准年[2023] | 140.7亿美元 |
| 预测年份 [2024] | 150.8亿美元 |
| 预测年份 [2030] | 241.4亿美元 |
| 复合年增长率(%) | 8.00% |
PEX 是一个总称,指的是交联聚乙烯。这种独特类型的塑胶是透过称为交联的工艺製成的,该工艺增强了聚合物并使其更加耐热、耐用和弹性。由于都市化和基础设施发展的加速、对管道的需求以及政府对可再生能源生产和发行的投资增加,该市场正在显着增长。此外,整个经济和电动车生产的需求不断增长正在推动市场成长。由于对 PEX 替代品和替代品的可用性以及 PEX 的环境退化和营运限制的担忧,市场开拓受到阻碍。 PEX 材料成分和生产的改进和进步预计将为市场带来更多机会。此外,对增强 PEX 生命週期永续性的日益关注也为环保解决方案铺平了道路。
区域洞察
在美洲,尤其是北美,PEX 因其弹性、耐用性和易于安装而在住宅建筑领域需求量很大。在美国,对经济高效且可靠的管道解决方案的需求正在推动 PEX 在管道应用中的采用。在南美洲,受经济因素以及新建和维修计划中从传统管道材料逐渐过渡到PEX的推动,PEX的需求正在增长,但增长速度较慢。欧洲、中东和非洲对 PEX 的需求多种多样,在欧洲,PEX 是地暖系统和太阳能/地热系统等可再生能源应用的首选。由于建筑热潮和对耐热管道解决方案的需求,中东显示出巨大的成长潜力。在亚太地区,快速的都市化和工业化,特别是在中国和印度,对 PEX 的需求不断增加。该地区的需求受到大型基础设施计划、饮用水系统中 PEX 的采用以及气候寒冷国家广泛普及地板辐射供暖的推动。
FPNV定位矩阵
FPNV定位矩阵对于评估PEX市场至关重要。我们检视与业务策略和产品满意度相关的关键指标,以对供应商进行全面评估。这种深入的分析使用户能够根据自己的要求做出明智的决策。根据评估,供应商被分为四个成功程度不同的像限:前沿(F)、探路者(P)、利基(N)和重要(V)。
市场占有率分析
市场占有率分析是一个综合工具,可以对 PEX 市场中供应商的现状进行深入而详细的研究。全面比较和分析供应商在整体收益、基本客群和其他关键指标方面的贡献,以便更好地了解公司的绩效及其在争夺市场占有率时面临的挑战。此外,该分析还提供了对该行业竞争特征的宝贵见解,包括在研究基准年观察到的累积、分散主导地位和合併特征等因素。这种详细程度的提高使供应商能够做出更明智的决策并制定有效的策略,从而在市场上获得竞争优势。
该报告对以下几个方面提供了宝贵的见解:
1-市场渗透率:提供有关主要企业所服务的市场的全面资讯。
2-市场开拓:我们深入研究利润丰厚的新兴市场,并分析它们在成熟细分市场中的渗透率。
3- 市场多元化:提供有关新产品发布、开拓地区、最新发展和投资的详细资讯。
4-竞争力评估与资讯:对主要企业的市场占有率、策略、产品、认证、监管状况、专利状况、製造能力等进行全面评估。
5- 产品开发与创新:提供对未来技术、研发活动和突破性产品开发的见解。
本报告解决了以下关键问题:
1-PEX市场的市场规模和预测是多少?
2-PEX 市场预测期间需要考虑投资的产品、细分市场、应用和领域有哪些?
3-PEX市场的技术趋势和法律规范是什么?
4-PEX市场主要厂商的市场占有率是多少?
5-进入PEX市场合适的型态和策略手段是什么?
目录
第一章 前言
第二章调查方法
第三章执行摘要
第四章市场概况
第五章市场洞察
- 市场动态
- 促进因素
- 都市化加速和基础设施发展对管道的需求
- 政府增加对可再生能源生产和分配的投资
- 整个经济领域电动车的需求和产量都在增加
- 抑制因素
- 对 PEX 营运限制和环境劣化的担忧
- 机会
- PEX 材料成分和生产的改进和进步
- 重点是增强 PEX 生命週期的永续性
- 任务
- PEX 替代方案和替代方案的可用性
- 促进因素
- 市场区隔分析
- 类型:MDPE 是首选,因为它提供适度的刚度和弹性
- 技术:更多采用电子束交联工艺,以改善品管并降低营运成本
- 最终用户:广泛适用于住宅和商业用途的 PEX 管道
- 市场趋势分析
- 由于美洲建筑业的扩张和新兴的医疗应用,对 PEX 的需求激增
- 亚太地区对汽车和医疗保健行业的投资增加以及对 PEX 的需求不断增长
- 化学和医疗保健产业的扩张以及欧洲、中东和非洲地区原料的供应
- 高通膨的累积效应
- 波特五力分析
- 价值炼和关键路径分析
- 法律规范
第六章 PEX 市场:依类型
- 高密度聚苯乙烯
- 低密度聚乙烯
- 中密度聚乙烯
第七章 PEX 市场:依技术分类
- 电子束加工
- 恩格尔法
- 硅烷接枝
第 8 章 PEX 市场:依最终用户划分
- 车
- 化学品
- 医疗保健
- 矿业
- 管道工程
- 电线电缆
第九章 美洲PEX市场
- 阿根廷
- 巴西
- 加拿大
- 墨西哥
- 美国
第10章亚太PEX市场
- 澳洲
- 中国
- 印度
- 印尼
- 日本
- 马来西亚
- 菲律宾
- 新加坡
- 韩国
- 台湾
- 泰国
- 越南
第十一章 欧洲、中东、非洲PEX市场
- 丹麦
- 埃及
- 芬兰
- 法国
- 德国
- 以色列
- 义大利
- 荷兰
- 奈及利亚
- 挪威
- 波兰
- 卡达
- 俄罗斯
- 沙乌地阿拉伯
- 南非
- 西班牙
- 瑞典
- 瑞士
- 土耳其
- 阿拉伯聯合大公国
- 英国
第十二章竞争形势
- FPNV定位矩阵
- 市场占有率分析:主要企业
- 主要企业竞争情境分析
- 併购
- 合约、合作和伙伴关係
- 新产品发布和功能增强
- 投资、资金筹措
- 奖项/奖励/扩展
第13章竞争产品组合
- 主要公司简介
- 3H Vinacom Co., Ltd.
- Ankit Polymers
- Apollo by The Mosack Group, Inc.
- Arkema Group
- Avient Corporation
- Borealis AG
- Everhot, Inc.
- Exxon Mobil Corporation
- Hanwha Corporation
- HDC Hyundai EP Company
- Hibco Plastics, Inc.
- Kkalpana industries(India)Limited
- LyondellBasell Industries NV
- MrPEX Systems
- Neste Corporation
- NKT A/S
- Nouryon Chemicals Holding BV
- Palziv Ltd.
- Polylink Polymers(India)Ltd.
- Polyrocks Chemical Co., Ltd.
- REHAU Industries SE & Co. KG
- Reliance Worldwide Corporation Limited
- Repsol, SA
- SACO AEI Polymers
- Sankhla Polymers Pvt. Ltd.
- SILON sro
- Sioux Chief Manufacturing Co., Inc.
- Solvay SA
- Sumitomo Electric Industries, Ltd.
- The Dow Chemical Company
- Toray Industries, Inc.
- Uponor Corporation
- Vikas Lifecare Limited
- WasteWise Group Oy
- Zimmer Biomet Holdings, Inc.
- 主要产品系列
第十四章附录
- 讨论指南
- 关于许可证和定价
[189 Pages Report] The PEX Market size was estimated at USD 14.07 billion in 2023 and expected to reach USD 15.08 billion in 2024, at a CAGR 8.00% to reach USD 24.14 billion by 2030.
Global PEX Market
| KEY MARKET STATISTICS | |
|---|---|
| Base Year [2023] | USD 14.07 billion |
| Estimated Year [2024] | USD 15.08 billion |
| Forecast Year [2030] | USD 24.14 billion |
| CAGR (%) | 8.00% |
PEX, standing for participatory experience exhibition, is an all-encompassing term used to reference cross-linked polyethylene. This unique type of plastic is created through a process known as cross-linking, which strengthens the polymer and enhances its heat resistance, durability, and flexibility. Increasing urbanization and infrastructure development, coupled with demand for pipes and growing government investments in renewable energy production and distribution, are creating significant growth in the market. Moreover, rising demand and electric vehicle production across economies are fueling market growth. Availability of alternatives and substitutes to PEX and concerns regarding environmental degradation of PEX and operational limitations hamper the market development. Improvements and advancements in material composition and production of PEX are expected to have also opened an avenue for more opportunities in the market. In addition, increasing focus on enhancing sustainability in the PEX lifecycle leads the way towards an eco-friendly solution.
Regional Insights
In the Americas, particularly in North America, there is a high demand for PEX in the residential construction sector due to its flexibility, durability, and ease of installation. The United States leads in adopting PEX for plumbing applications, driven by the need for cost-effective and reliable piping solutions. In South America, the demand for PEX is growing, although at a slower pace, influenced by economic factors and the gradual shift from traditional piping materials to PEX in new construction and retrofitting projects. The EMEA region exhibits a diverse demand for PEX, with Europe showing a strong preference for PEX in underfloor heating systems and renewable energy applications, such as solar and geothermal systems. The Middle East shows significant growth potential due to the construction boom and the need for temperature-resistant piping solutions. The Asia-Pacific region has an increasing demand for PEX, driven by rapid urbanization and industrialization, particularly in China and India. The region's demand is fueled by large-scale infrastructure projects, the adoption of PEX in potable water systems, and the increasing popularity of radiant floor heating in countries with colder climates.
FPNV Positioning Matrix
The FPNV Positioning Matrix is pivotal in evaluating the PEX Market. It offers a comprehensive assessment of vendors, examining key metrics related to Business Strategy and Product Satisfaction. This in-depth analysis empowers users to make well-informed decisions aligned with their requirements. Based on the evaluation, the vendors are then categorized into four distinct quadrants representing varying levels of success: Forefront (F), Pathfinder (P), Niche (N), or Vital (V).
Market Share Analysis
The Market Share Analysis is a comprehensive tool that provides an insightful and in-depth examination of the current state of vendors in the PEX Market. By meticulously comparing and analyzing vendor contributions in terms of overall revenue, customer base, and other key metrics, we can offer companies a greater understanding of their performance and the challenges they face when competing for market share. Additionally, this analysis provides valuable insights into the competitive nature of the sector, including factors such as accumulation, fragmentation dominance, and amalgamation traits observed over the base year period studied. With this expanded level of detail, vendors can make more informed decisions and devise effective strategies to gain a competitive edge in the market.
Key Company Profiles
The report delves into recent significant developments in the PEX Market, highlighting leading vendors and their innovative profiles. These include 3H Vinacom Co., Ltd., Ankit Polymers, Apollo by The Mosack Group, Inc., Arkema Group, Avient Corporation, Borealis AG, Everhot, Inc., Exxon Mobil Corporation, Hanwha Corporation, HDC Hyundai EP Company, Hibco Plastics, Inc., Kkalpana industries (India) Limited, LyondellBasell Industries N.V., MrPEX Systems, Neste Corporation, NKT A/S, Nouryon Chemicals Holding B.V., Palziv Ltd., Polylink Polymers (India) Ltd., Polyrocks Chemical Co., Ltd., REHAU Industries SE & Co. KG, Reliance Worldwide Corporation Limited, Repsol, S.A., SACO AEI Polymers, Sankhla Polymers Pvt. Ltd., SILON s.r.o., Sioux Chief Manufacturing Co., Inc., Solvay SA, Sumitomo Electric Industries, Ltd., The Dow Chemical Company, Toray Industries, Inc., Uponor Corporation, Vikas Lifecare Limited, WasteWise Group Oy, and Zimmer Biomet Holdings, Inc..
Market Segmentation & Coverage
This research report categorizes the PEX Market to forecast the revenues and analyze trends in each of the following sub-markets:
- Type
- High-Density Polyethylene
- Low-Density Polyethylene
- Medium-Density Polyethylene
- Technology
- Electron Beam Processing
- Engel Method
- Silane Grafting
- End-User
- Automotive
- Chemical
- Medical & Healthcare
- Mining
- Plumbing
- Wires & Cables
- Region
- Americas
- Argentina
- Brazil
- Canada
- Mexico
- United States
- California
- Florida
- Illinois
- New York
- Ohio
- Pennsylvania
- Texas
- Asia-Pacific
- Australia
- China
- India
- Indonesia
- Japan
- Malaysia
- Philippines
- Singapore
- South Korea
- Taiwan
- Thailand
- Vietnam
- Europe, Middle East & Africa
- Denmark
- Egypt
- Finland
- France
- Germany
- Israel
- Italy
- Netherlands
- Nigeria
- Norway
- Poland
- Qatar
- Russia
- Saudi Arabia
- South Africa
- Spain
- Sweden
- Switzerland
- Turkey
- United Arab Emirates
- United Kingdom
- Americas
The report offers valuable insights on the following aspects:
1. Market Penetration: It presents comprehensive information on the market provided by key players.
2. Market Development: It delves deep into lucrative emerging markets and analyzes the penetration across mature market segments.
3. Market Diversification: It provides detailed information on new product launches, untapped geographic regions, recent developments, and investments.
4. Competitive Assessment & Intelligence: It conducts an exhaustive assessment of market shares, strategies, products, certifications, regulatory approvals, patent landscape, and manufacturing capabilities of the leading players.
5. Product Development & Innovation: It offers intelligent insights on future technologies, R&D activities, and breakthrough product developments.
The report addresses key questions such as:
1. What is the market size and forecast of the PEX Market?
2. Which products, segments, applications, and areas should one consider investing in over the forecast period in the PEX Market?
3. What are the technology trends and regulatory frameworks in the PEX Market?
4. What is the market share of the leading vendors in the PEX Market?
5. Which modes and strategic moves are suitable for entering the PEX Market?
Table of Contents
1. Preface
- 1.1. Objectives of the Study
- 1.2. Market Segmentation & Coverage
- 1.3. Years Considered for the Study
- 1.4. Currency & Pricing
- 1.5. Language
- 1.6. Limitations
- 1.7. Assumptions
- 1.8. Stakeholders
2. Research Methodology
- 2.1. Define: Research Objective
- 2.2. Determine: Research Design
- 2.3. Prepare: Research Instrument
- 2.4. Collect: Data Source
- 2.5. Analyze: Data Interpretation
- 2.6. Formulate: Data Verification
- 2.7. Publish: Research Report
- 2.8. Repeat: Report Update
3. Executive Summary
4. Market Overview
- 4.1. Introduction
- 4.2. PEX Market, by Region
5. Market Insights
- 5.1. Market Dynamics
- 5.1.1. Drivers
- 5.1.1.1. Increasing urbanization and infrastructure development coupled with demand for pipes
- 5.1.1.2. Growing government investments in renewable energy production and distribution
- 5.1.1.3. Rising demand and production of electric vehicles across economies
- 5.1.2. Restraints
- 5.1.2.1. Operational limitations and concerns regarding environmental degradation of PEX
- 5.1.3. Opportunities
- 5.1.3.1. Improvements and advancements in material composition and production of PEX
- 5.1.3.2. Increasing focus on enhancing sustainability in the PEX lifecycle
- 5.1.4. Challenges
- 5.1.4.1. Availability of alternatives and substitutes to PEX
- 5.1.1. Drivers
- 5.2. Market Segmentation Analysis
- 5.2.1. Type: Significant preference for MDPE for decent rigidity and flexibility
- 5.2.2. Technology: Growing adoption for electron beam cross-linking process for improved quality control and operational cost savings
- 5.2.3. End-User: Wider application of PEX pipes for residential and commercial applications
- 5.3. Market Trend Analysis
- 5.3.1. Surge in demand of PEX owing to expanding construction sector and its emergence in medical application in the Americas
- 5.3.2. Increasing investment in the automotive and healthcare industry and growing demand for PEX in the APAC region
- 5.3.3. Expanding chemical and healthcare industry coupled with availability raw materials in the EMEA region
- 5.4. Cumulative Impact of High Inflation
- 5.5. Porter's Five Forces Analysis
- 5.5.1. Threat of New Entrants
- 5.5.2. Threat of Substitutes
- 5.5.3. Bargaining Power of Customers
- 5.5.4. Bargaining Power of Suppliers
- 5.5.5. Industry Rivalry
- 5.6. Value Chain & Critical Path Analysis
- 5.7. Regulatory Framework
6. PEX Market, by Type
- 6.1. Introduction
- 6.2. High-Density Polyethylene
- 6.3. Low-Density Polyethylene
- 6.4. Medium-Density Polyethylene
7. PEX Market, by Technology
- 7.1. Introduction
- 7.2. Electron Beam Processing
- 7.3. Engel Method
- 7.4. Silane Grafting
8. PEX Market, by End-User
- 8.1. Introduction
- 8.2. Automotive
- 8.3. Chemical
- 8.4. Medical & Healthcare
- 8.5. Mining
- 8.6. Plumbing
- 8.7. Wires & Cables
9. Americas PEX Market
- 9.1. Introduction
- 9.2. Argentina
- 9.3. Brazil
- 9.4. Canada
- 9.5. Mexico
- 9.6. United States
10. Asia-Pacific PEX Market
- 10.1. Introduction
- 10.2. Australia
- 10.3. China
- 10.4. India
- 10.5. Indonesia
- 10.6. Japan
- 10.7. Malaysia
- 10.8. Philippines
- 10.9. Singapore
- 10.10. South Korea
- 10.11. Taiwan
- 10.12. Thailand
- 10.13. Vietnam
11. Europe, Middle East & Africa PEX Market
- 11.1. Introduction
- 11.2. Denmark
- 11.3. Egypt
- 11.4. Finland
- 11.5. France
- 11.6. Germany
- 11.7. Israel
- 11.8. Italy
- 11.9. Netherlands
- 11.10. Nigeria
- 11.11. Norway
- 11.12. Poland
- 11.13. Qatar
- 11.14. Russia
- 11.15. Saudi Arabia
- 11.16. South Africa
- 11.17. Spain
- 11.18. Sweden
- 11.19. Switzerland
- 11.20. Turkey
- 11.21. United Arab Emirates
- 11.22. United Kingdom
12. Competitive Landscape
- 12.1. FPNV Positioning Matrix
- 12.2. Market Share Analysis, By Key Player
- 12.3. Competitive Scenario Analysis, By Key Player
- 12.3.1. Merger & Acquisition
- 12.3.1.1. Avient Announces Agreement to Acquire DSM Protective Materials (Dyneema) and Plans to Explore Sale of Distribution
- 12.3.2. Agreement, Collaboration, & Partnership
- 12.3.2.1. Collaboration to Increase Low Density Polyethylene Packaging Recyclability Sees Success in Deinking Trials
- 12.3.2.2. Borealis Bornewables help Uponor Create the World's First Cross-Linked Polyethylene (PE-X) Pipes Based on Renewable Feedstock
- 12.3.2.3. Neste, Borealis, Uponor, Wastewise Group Enable Chemical Recycling of Hard-to-Recycle Plastic Waste into New High-Quality Plastic Pipes
- 12.3.3. New Product Launch & Enhancement
- 12.3.3.1. Dow Helps Enable Decarbonization with ENDURANCE Compounds for Cable Systems in North America
- 12.3.3.2. Borealis Borcycle C Chemical Recycling Provides Circular Solutions for Crosslinked Polyethylene for the Wire & Cable and Infrastructure Sectors
- 12.3.3.3. Avient Launches New Cross-Linkable Formulations for Photovoltaic Cables to Support the Rising Need for Solar Power Generation
- 12.3.4. Investment & Funding
- 12.3.4.1. NKT A/S to Invest Euro 1 Billion in High-Voltage Power Cable Business
- 12.3.5. Award, Recognition, & Expansion
- 12.3.5.1. Reece-Hopper Now Represents REHAU Products in Texas
- 12.3.5.2. SKZ Expands Cross-Linked Materials Research
- 12.3.5.3. Avient Corporation Expands Manufacturing of UL-Certified Wire and Cable Formulations for Photovoltaic Applications to Europe
- 12.3.1. Merger & Acquisition
13. Competitive Portfolio
- 13.1. Key Company Profiles
- 13.1.1. 3H Vinacom Co., Ltd.
- 13.1.2. Ankit Polymers
- 13.1.3. Apollo by The Mosack Group, Inc.
- 13.1.4. Arkema Group
- 13.1.5. Avient Corporation
- 13.1.6. Borealis AG
- 13.1.7. Everhot, Inc.
- 13.1.8. Exxon Mobil Corporation
- 13.1.9. Hanwha Corporation
- 13.1.10. HDC Hyundai EP Company
- 13.1.11. Hibco Plastics, Inc.
- 13.1.12. Kkalpana industries (India) Limited
- 13.1.13. LyondellBasell Industries N.V.
- 13.1.14. MrPEX Systems
- 13.1.15. Neste Corporation
- 13.1.16. NKT A/S
- 13.1.17. Nouryon Chemicals Holding B.V.
- 13.1.18. Palziv Ltd.
- 13.1.19. Polylink Polymers (India) Ltd.
- 13.1.20. Polyrocks Chemical Co., Ltd.
- 13.1.21. REHAU Industries SE & Co. KG
- 13.1.22. Reliance Worldwide Corporation Limited
- 13.1.23. Repsol, S.A.
- 13.1.24. SACO AEI Polymers
- 13.1.25. Sankhla Polymers Pvt. Ltd.
- 13.1.26. SILON s.r.o.
- 13.1.27. Sioux Chief Manufacturing Co., Inc.
- 13.1.28. Solvay SA
- 13.1.29. Sumitomo Electric Industries, Ltd.
- 13.1.30. The Dow Chemical Company
- 13.1.31. Toray Industries, Inc.
- 13.1.32. Uponor Corporation
- 13.1.33. Vikas Lifecare Limited
- 13.1.34. WasteWise Group Oy
- 13.1.35. Zimmer Biomet Holdings, Inc.
- 13.2. Key Product Portfolio
14. Appendix
- 14.1. Discussion Guide
- 14.2. License & Pricing
LIST OF FIGURES
- FIGURE 1. PEX MARKET RESEARCH PROCESS
- FIGURE 2. PEX MARKET SIZE, 2023 VS 2030
- FIGURE 3. PEX MARKET SIZE, 2019-2030 (USD MILLION)
- FIGURE 4. PEX MARKET SIZE, BY REGION, 2023 VS 2030 (%)
- FIGURE 5. PEX MARKET SIZE, BY REGION, 2023 VS 2024 VS 2030 (USD MILLION)
- FIGURE 6. PEX MARKET DYNAMICS
- FIGURE 7. PEX MARKET SIZE, BY TYPE, 2023 VS 2030 (%)
- FIGURE 8. PEX MARKET SIZE, BY TYPE, 2023 VS 2024 VS 2030 (USD MILLION)
- FIGURE 9. PEX MARKET SIZE, BY TECHNOLOGY, 2023 VS 2030 (%)
- FIGURE 10. PEX MARKET SIZE, BY TECHNOLOGY, 2023 VS 2024 VS 2030 (USD MILLION)
- FIGURE 11. PEX MARKET SIZE, BY END-USER, 2023 VS 2030 (%)
- FIGURE 12. PEX MARKET SIZE, BY END-USER, 2023 VS 2024 VS 2030 (USD MILLION)
- FIGURE 13. AMERICAS PEX MARKET SIZE, BY COUNTRY, 2023 VS 2030 (%)
- FIGURE 14. AMERICAS PEX MARKET SIZE, BY COUNTRY, 2023 VS 2024 VS 2030 (USD MILLION)
- FIGURE 15. UNITED STATES PEX MARKET SIZE, BY STATE, 2023 VS 2030 (%)
- FIGURE 16. UNITED STATES PEX MARKET SIZE, BY STATE, 2023 VS 2024 VS 2030 (USD MILLION)
- FIGURE 17. ASIA-PACIFIC PEX MARKET SIZE, BY COUNTRY, 2023 VS 2030 (%)
- FIGURE 18. ASIA-PACIFIC PEX MARKET SIZE, BY COUNTRY, 2023 VS 2024 VS 2030 (USD MILLION)
- FIGURE 19. EUROPE, MIDDLE EAST & AFRICA PEX MARKET SIZE, BY COUNTRY, 2023 VS 2030 (%)
- FIGURE 20. EUROPE, MIDDLE EAST & AFRICA PEX MARKET SIZE, BY COUNTRY, 2023 VS 2024 VS 2030 (USD MILLION)
- FIGURE 21. PEX MARKET, FPNV POSITIONING MATRIX, 2023
- FIGURE 22. PEX MARKET SHARE, BY KEY PLAYER, 2023
LIST OF TABLES
- TABLE 1. PEX MARKET SEGMENTATION & COVERAGE
- TABLE 2. UNITED STATES DOLLAR EXCHANGE RATE, 2019-2023
- TABLE 3. PEX MARKET SIZE, 2019-2030 (USD MILLION)
- TABLE 4. GLOBAL PEX MARKET SIZE, BY REGION, 2019-2030 (USD MILLION)
- TABLE 5. PEX MARKET SIZE, BY TYPE, 2019-2030 (USD MILLION)
- TABLE 6. PEX MARKET SIZE, BY HIGH-DENSITY POLYETHYLENE, BY REGION, 2019-2030 (USD MILLION)
- TABLE 7. PEX MARKET SIZE, BY LOW-DENSITY POLYETHYLENE, BY REGION, 2019-2030 (USD MILLION)
- TABLE 8. PEX MARKET SIZE, BY MEDIUM-DENSITY POLYETHYLENE, BY REGION, 2019-2030 (USD MILLION)
- TABLE 9. PEX MARKET SIZE, BY TECHNOLOGY, 2019-2030 (USD MILLION)
- TABLE 10. PEX MARKET SIZE, BY ELECTRON BEAM PROCESSING, BY REGION, 2019-2030 (USD MILLION)
- TABLE 11. PEX MARKET SIZE, BY ENGEL METHOD, BY REGION, 2019-2030 (USD MILLION)
- TABLE 12. PEX MARKET SIZE, BY SILANE GRAFTING, BY REGION, 2019-2030 (USD MILLION)
- TABLE 13. PEX MARKET SIZE, BY END-USER, 2019-2030 (USD MILLION)
- TABLE 14. PEX MARKET SIZE, BY AUTOMOTIVE, BY REGION, 2019-2030 (USD MILLION)
- TABLE 15. PEX MARKET SIZE, BY CHEMICAL, BY REGION, 2019-2030 (USD MILLION)
- TABLE 16. PEX MARKET SIZE, BY MEDICAL & HEALTHCARE, BY REGION, 2019-2030 (USD MILLION)
- TABLE 17. PEX MARKET SIZE, BY MINING, BY REGION, 2019-2030 (USD MILLION)
- TABLE 18. PEX MARKET SIZE, BY PLUMBING, BY REGION, 2019-2030 (USD MILLION)
- TABLE 19. PEX MARKET SIZE, BY WIRES & CABLES, BY REGION, 2019-2030 (USD MILLION)
- TABLE 20. AMERICAS PEX MARKET SIZE, BY TYPE, 2019-2030 (USD MILLION)
- TABLE 21. AMERICAS PEX MARKET SIZE, BY TECHNOLOGY, 2019-2030 (USD MILLION)
- TABLE 22. AMERICAS PEX MARKET SIZE, BY END-USER, 2019-2030 (USD MILLION)
- TABLE 23. AMERICAS PEX MARKET SIZE, BY COUNTRY, 2019-2030 (USD MILLION)
- TABLE 24. ARGENTINA PEX MARKET SIZE, BY TYPE, 2019-2030 (USD MILLION)
- TABLE 25. ARGENTINA PEX MARKET SIZE, BY TECHNOLOGY, 2019-2030 (USD MILLION)
- TABLE 26. ARGENTINA PEX MARKET SIZE, BY END-USER, 2019-2030 (USD MILLION)
- TABLE 27. BRAZIL PEX MARKET SIZE, BY TYPE, 2019-2030 (USD MILLION)
- TABLE 28. BRAZIL PEX MARKET SIZE, BY TECHNOLOGY, 2019-2030 (USD MILLION)
- TABLE 29. BRAZIL PEX MARKET SIZE, BY END-USER, 2019-2030 (USD MILLION)
- TABLE 30. CANADA PEX MARKET SIZE, BY TYPE, 2019-2030 (USD MILLION)
- TABLE 31. CANADA PEX MARKET SIZE, BY TECHNOLOGY, 2019-2030 (USD MILLION)
- TABLE 32. CANADA PEX MARKET SIZE, BY END-USER, 2019-2030 (USD MILLION)
- TABLE 33. MEXICO PEX MARKET SIZE, BY TYPE, 2019-2030 (USD MILLION)
- TABLE 34. MEXICO PEX MARKET SIZE, BY TECHNOLOGY, 2019-2030 (USD MILLION)
- TABLE 35. MEXICO PEX MARKET SIZE, BY END-USER, 2019-2030 (USD MILLION)
- TABLE 36. UNITED STATES PEX MARKET SIZE, BY TYPE, 2019-2030 (USD MILLION)
- TABLE 37. UNITED STATES PEX MARKET SIZE, BY TECHNOLOGY, 2019-2030 (USD MILLION)
- TABLE 38. UNITED STATES PEX MARKET SIZE, BY END-USER, 2019-2030 (USD MILLION)
- TABLE 39. UNITED STATES PEX MARKET SIZE, BY STATE, 2019-2030 (USD MILLION)
- TABLE 40. ASIA-PACIFIC PEX MARKET SIZE, BY TYPE, 2019-2030 (USD MILLION)
- TABLE 41. ASIA-PACIFIC PEX MARKET SIZE, BY TECHNOLOGY, 2019-2030 (USD MILLION)
- TABLE 42. ASIA-PACIFIC PEX MARKET SIZE, BY END-USER, 2019-2030 (USD MILLION)
- TABLE 43. ASIA-PACIFIC PEX MARKET SIZE, BY COUNTRY, 2019-2030 (USD MILLION)
- TABLE 44. AUSTRALIA PEX MARKET SIZE, BY TYPE, 2019-2030 (USD MILLION)
- TABLE 45. AUSTRALIA PEX MARKET SIZE, BY TECHNOLOGY, 2019-2030 (USD MILLION)
- TABLE 46. AUSTRALIA PEX MARKET SIZE, BY END-USER, 2019-2030 (USD MILLION)
- TABLE 47. CHINA PEX MARKET SIZE, BY TYPE, 2019-2030 (USD MILLION)
- TABLE 48. CHINA PEX MARKET SIZE, BY TECHNOLOGY, 2019-2030 (USD MILLION)
- TABLE 49. CHINA PEX MARKET SIZE, BY END-USER, 2019-2030 (USD MILLION)
- TABLE 50. INDIA PEX MARKET SIZE, BY TYPE, 2019-2030 (USD MILLION)
- TABLE 51. INDIA PEX MARKET SIZE, BY TECHNOLOGY, 2019-2030 (USD MILLION)
- TABLE 52. INDIA PEX MARKET SIZE, BY END-USER, 2019-2030 (USD MILLION)
- TABLE 53. INDONESIA PEX MARKET SIZE, BY TYPE, 2019-2030 (USD MILLION)
- TABLE 54. INDONESIA PEX MARKET SIZE, BY TECHNOLOGY, 2019-2030 (USD MILLION)
- TABLE 55. INDONESIA PEX MARKET SIZE, BY END-USER, 2019-2030 (USD MILLION)
- TABLE 56. JAPAN PEX MARKET SIZE, BY TYPE, 2019-2030 (USD MILLION)
- TABLE 57. JAPAN PEX MARKET SIZE, BY TECHNOLOGY, 2019-2030 (USD MILLION)
- TABLE 58. JAPAN PEX MARKET SIZE, BY END-USER, 2019-2030 (USD MILLION)
- TABLE 59. MALAYSIA PEX MARKET SIZE, BY TYPE, 2019-2030 (USD MILLION)
- TABLE 60. MALAYSIA PEX MARKET SIZE, BY TECHNOLOGY, 2019-2030 (USD MILLION)
- TABLE 61. MALAYSIA PEX MARKET SIZE, BY END-USER, 2019-2030 (USD MILLION)
- TABLE 62. PHILIPPINES PEX MARKET SIZE, BY TYPE, 2019-2030 (USD MILLION)
- TABLE 63. PHILIPPINES PEX MARKET SIZE, BY TECHNOLOGY, 2019-2030 (USD MILLION)
- TABLE 64. PHILIPPINES PEX MARKET SIZE, BY END-USER, 2019-2030 (USD MILLION)
- TABLE 65. SINGAPORE PEX MARKET SIZE, BY TYPE, 2019-2030 (USD MILLION)
- TABLE 66. SINGAPORE PEX MARKET SIZE, BY TECHNOLOGY, 2019-2030 (USD MILLION)
- TABLE 67. SINGAPORE PEX MARKET SIZE, BY END-USER, 2019-2030 (USD MILLION)
- TABLE 68. SOUTH KOREA PEX MARKET SIZE, BY TYPE, 2019-2030 (USD MILLION)
- TABLE 69. SOUTH KOREA PEX MARKET SIZE, BY TECHNOLOGY, 2019-2030 (USD MILLION)
- TABLE 70. SOUTH KOREA PEX MARKET SIZE, BY END-USER, 2019-2030 (USD MILLION)
- TABLE 71. TAIWAN PEX MARKET SIZE, BY TYPE, 2019-2030 (USD MILLION)
- TABLE 72. TAIWAN PEX MARKET SIZE, BY TECHNOLOGY, 2019-2030 (USD MILLION)
- TABLE 73. TAIWAN PEX MARKET SIZE, BY END-USER, 2019-2030 (USD MILLION)
- TABLE 74. THAILAND PEX MARKET SIZE, BY TYPE, 2019-2030 (USD MILLION)
- TABLE 75. THAILAND PEX MARKET SIZE, BY TECHNOLOGY, 2019-2030 (USD MILLION)
- TABLE 76. THAILAND PEX MARKET SIZE, BY END-USER, 2019-2030 (USD MILLION)
- TABLE 77. VIETNAM PEX MARKET SIZE, BY TYPE, 2019-2030 (USD MILLION)
- TABLE 78. VIETNAM PEX MARKET SIZE, BY TECHNOLOGY, 2019-2030 (USD MILLION)
- TABLE 79. VIETNAM PEX MARKET SIZE, BY END-USER, 2019-2030 (USD MILLION)
- TABLE 80. EUROPE, MIDDLE EAST & AFRICA PEX MARKET SIZE, BY TYPE, 2019-2030 (USD MILLION)
- TABLE 81. EUROPE, MIDDLE EAST & AFRICA PEX MARKET SIZE, BY TECHNOLOGY, 2019-2030 (USD MILLION)
- TABLE 82. EUROPE, MIDDLE EAST & AFRICA PEX MARKET SIZE, BY END-USER, 2019-2030 (USD MILLION)
- TABLE 83. EUROPE, MIDDLE EAST & AFRICA PEX MARKET SIZE, BY COUNTRY, 2019-2030 (USD MILLION)
- TABLE 84. DENMARK PEX MARKET SIZE, BY TYPE, 2019-2030 (USD MILLION)
- TABLE 85. DENMARK PEX MARKET SIZE, BY TECHNOLOGY, 2019-2030 (USD MILLION)
- TABLE 86. DENMARK PEX MARKET SIZE, BY END-USER, 2019-2030 (USD MILLION)
- TABLE 87. EGYPT PEX MARKET SIZE, BY TYPE, 2019-2030 (USD MILLION)
- TABLE 88. EGYPT PEX MARKET SIZE, BY TECHNOLOGY, 2019-2030 (USD MILLION)
- TABLE 89. EGYPT PEX MARKET SIZE, BY END-USER, 2019-2030 (USD MILLION)
- TABLE 90. FINLAND PEX MARKET SIZE, BY TYPE, 2019-2030 (USD MILLION)
- TABLE 91. FINLAND PEX MARKET SIZE, BY TECHNOLOGY, 2019-2030 (USD MILLION)
- TABLE 92. FINLAND PEX MARKET SIZE, BY END-USER, 2019-2030 (USD MILLION)
- TABLE 93. FRANCE PEX MARKET SIZE, BY TYPE, 2019-2030 (USD MILLION)
- TABLE 94. FRANCE PEX MARKET SIZE, BY TECHNOLOGY, 2019-2030 (USD MILLION)
- TABLE 95. FRANCE PEX MARKET SIZE, BY END-USER, 2019-2030 (USD MILLION)
- TABLE 96. GERMANY PEX MARKET SIZE, BY TYPE, 2019-2030 (USD MILLION)
- TABLE 97. GERMANY PEX MARKET SIZE, BY TECHNOLOGY, 2019-2030 (USD MILLION)
- TABLE 98. GERMANY PEX MARKET SIZE, BY END-USER, 2019-2030 (USD MILLION)
- TABLE 99. ISRAEL PEX MARKET SIZE, BY TYPE, 2019-2030 (USD MILLION)
- TABLE 100. ISRAEL PEX MARKET SIZE, BY TECHNOLOGY, 2019-2030 (USD MILLION)
- TABLE 101. ISRAEL PEX MARKET SIZE, BY END-USER, 2019-2030 (USD MILLION)
- TABLE 102. ITALY PEX MARKET SIZE, BY TYPE, 2019-2030 (USD MILLION)
- TABLE 103. ITALY PEX MARKET SIZE, BY TECHNOLOGY, 2019-2030 (USD MILLION)
- TABLE 104. ITALY PEX MARKET SIZE, BY END-USER, 2019-2030 (USD MILLION)
- TABLE 105. NETHERLANDS PEX MARKET SIZE, BY TYPE, 2019-2030 (USD MILLION)
- TABLE 106. NETHERLANDS PEX MARKET SIZE, BY TECHNOLOGY, 2019-2030 (USD MILLION)
- TABLE 107. NETHERLANDS PEX MARKET SIZE, BY END-USER, 2019-2030 (USD MILLION)
- TABLE 108. NIGERIA PEX MARKET SIZE, BY TYPE, 2019-2030 (USD MILLION)
- TABLE 109. NIGERIA PEX MARKET SIZE, BY TECHNOLOGY, 2019-2030 (USD MILLION)
- TABLE 110. NIGERIA PEX MARKET SIZE, BY END-USER, 2019-2030 (USD MILLION)
- TABLE 111. NORWAY PEX MARKET SIZE, BY TYPE, 2019-2030 (USD MILLION)
- TABLE 112. NORWAY PEX MARKET SIZE, BY TECHNOLOGY, 2019-2030 (USD MILLION)
- TABLE 113. NORWAY PEX MARKET SIZE, BY END-USER, 2019-2030 (USD MILLION)
- TABLE 114. POLAND PEX MARKET SIZE, BY TYPE, 2019-2030 (USD MILLION)
- TABLE 115. POLAND PEX MARKET SIZE, BY TECHNOLOGY, 2019-2030 (USD MILLION)
- TABLE 116. POLAND PEX MARKET SIZE, BY END-USER, 2019-2030 (USD MILLION)
- TABLE 117. QATAR PEX MARKET SIZE, BY TYPE, 2019-2030 (USD MILLION)
- TABLE 118. QATAR PEX MARKET SIZE, BY TECHNOLOGY, 2019-2030 (USD MILLION)
- TABLE 119. QATAR PEX MARKET SIZE, BY END-USER, 2019-2030 (USD MILLION)
- TABLE 120. RUSSIA PEX MARKET SIZE, BY TYPE, 2019-2030 (USD MILLION)
- TABLE 121. RUSSIA PEX MARKET SIZE, BY TECHNOLOGY, 2019-2030 (USD MILLION)
- TABLE 122. RUSSIA PEX MARKET SIZE, BY END-USER, 2019-2030 (USD MILLION)
- TABLE 123. SAUDI ARABIA PEX MARKET SIZE, BY TYPE, 2019-2030 (USD MILLION)
- TABLE 124. SAUDI ARABIA PEX MARKET SIZE, BY TECHNOLOGY, 2019-2030 (USD MILLION)
- TABLE 125. SAUDI ARABIA PEX MARKET SIZE, BY END-USER, 2019-2030 (USD MILLION)
- TABLE 126. SOUTH AFRICA PEX MARKET SIZE, BY TYPE, 2019-2030 (USD MILLION)
- TABLE 127. SOUTH AFRICA PEX MARKET SIZE, BY TECHNOLOGY, 2019-2030 (USD MILLION)
- TABLE 128. SOUTH AFRICA PEX MARKET SIZE, BY END-USER, 2019-2030 (USD MILLION)
- TABLE 129. SPAIN PEX MARKET SIZE, BY TYPE, 2019-2030 (USD MILLION)
- TABLE 130. SPAIN PEX MARKET SIZE, BY TECHNOLOGY, 2019-2030 (USD MILLION)
- TABLE 131. SPAIN PEX MARKET SIZE, BY END-USER, 2019-2030 (USD MILLION)
- TABLE 132. SWEDEN PEX MARKET SIZE, BY TYPE, 2019-2030 (USD MILLION)
- TABLE 133. SWEDEN PEX MARKET SIZE, BY TECHNOLOGY, 2019-2030 (USD MILLION)
- TABLE 134. SWEDEN PEX MARKET SIZE, BY END-USER, 2019-2030 (USD MILLION)
- TABLE 135. SWITZERLAND PEX MARKET SIZE, BY TYPE, 2019-2030 (USD MILLION)
- TABLE 136. SWITZERLAND PEX MARKET SIZE, BY TECHNOLOGY, 2019-2030 (USD MILLION)
- TABLE 137. SWITZERLAND PEX MARKET SIZE, BY END-USER, 2019-2030 (USD MILLION)
- TABLE 138. TURKEY PEX MARKET SIZE, BY TYPE, 2019-2030 (USD MILLION)
- TABLE 139. TURKEY PEX MARKET SIZE, BY TECHNOLOGY, 2019-2030 (USD MILLION)
- TABLE 140. TURKEY PEX MARKET SIZE, BY END-USER, 2019-2030 (USD MILLION)
- TABLE 141. UNITED ARAB EMIRATES PEX MARKET SIZE, BY TYPE, 2019-2030 (USD MILLION)
- TABLE 142. UNITED ARAB EMIRATES PEX MARKET SIZE, BY TECHNOLOGY, 2019-2030 (USD MILLION)
- TABLE 143. UNITED ARAB EMIRATES PEX MARKET SIZE, BY END-USER, 2019-2030 (USD MILLION)
- TABLE 144. UNITED KINGDOM PEX MARKET SIZE, BY TYPE, 2019-2030 (USD MILLION)
- TABLE 145. UNITED KINGDOM PEX MARKET SIZE, BY TECHNOLOGY, 2019-2030 (USD MILLION)
- TABLE 146. UNITED KINGDOM PEX MARKET SIZE, BY END-USER, 2019-2030 (USD MILLION)
- TABLE 147. PEX MARKET, FPNV POSITIONING MATRIX, 2023
- TABLE 148. PEX MARKET SHARE, BY KEY PLAYER, 2023
- TABLE 149. PEX MARKET LICENSE & PRICING
 2024-2032 年按原料、应用、製造流程和地区分類的高密度聚乙烯市场报告
 2024 年高高密度聚苯乙烯全球市场报告
 高密度聚苯乙烯(HDPE) 瓶市场 – 2024-2029 年预测
 2024-2028年全球高密度聚苯乙烯市场
 全球高密度聚乙烯 (HDPE) 市场:工厂产能、产量、工艺、技术、利用率、供需、最终用途、等级、外贸、销售渠道、区域需求、公司份额(2015-2035))
 全球双峰HDPE(高密度聚苯乙烯)市场分析:厂房生产能力,生产量,经营效率,技术,需求与供给,终端用户产业,流通管道,地区需求(2015年~2030年)
 高密度聚苯乙烯(HDPE)的中国市场
 高密度聚苯乙烯市场:按产品、按用途- 俄罗斯-乌克兰衝突、高通胀的累积影响 - 2023-2030 年全球预测
 高密度聚乙烯 (HDPE) 市场 - 增长、趋势、COVID-19 的影响和预测 (2023-2028)
 高密度聚苯乙烯的全球市场