


 |
市场调查报告书
商品编码
1434576
3D 生物列印市场:按组件、技术和最终用户划分 - 2024-2030 年全球预测3D Bioprinting Market by Component (3D Bioprinters, Bioinks), Technology (Extrusion-based Bioprinting, Inkjet-based Bioprinting, Laser-assisted Bioprinting), End-user - Global Forecast 2024-2030 |
||||||
※ 本网页内容可能与最新版本有所差异。详细情况请与我们联繫。
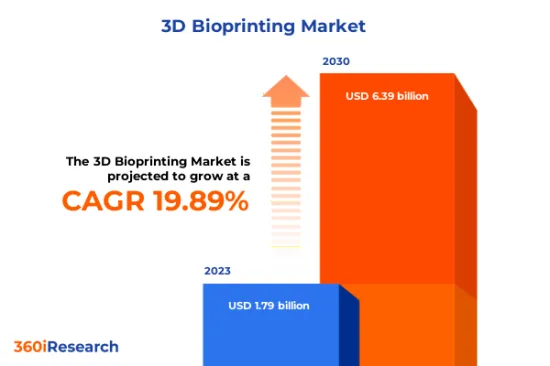
预计2023年3D生物列印市场规模为17.9亿美元,预计2024年将达21.4亿美元,2030年将达到63.9亿美元,复合年增长率为19.89%。
3D生物列印的全球市场
| 主要市场统计 | |
|---|---|
| 基准年[2023] | 17.9亿美元 |
| 预测年份 [2024] | 21.4亿美元 |
| 预测年份 [2030] | 63.9亿美元 |
| 复合年增长率(%) | 19.89% |
3D 生物列印是一项创新技术,将生物墨水与活细胞融合以创建 3D 组织样结构。该过程在3D空间中逐层列印生物墨水和细胞的混合物。近年来,对3D生物列印技术的需求显着增长,并已成为各种生物医学应用的重要工具。疾病建模和组织工程是这项创新技术产生重大影响的两个重要领域。慢性病在全球的流行以及对有效治疗方法日益增长的需求促使研究人员探索 3D 生物列印彻底改变医疗保健的潜力。此外,对个人化医疗应用的需求不断增长,需要根据个别患者的需求量身定製配方和治疗方法,其中 3D 生物列印在实现基于患者遗传特征和疾病特征的定制方面发挥关键作用。可扩展性是 3D 生物列印的关键问题。创造更大、更复杂的组织和器官需要提高列印过程的速度和精确度。然而,近年来,专注于开髮用于 3D 生物列印应用的新型生医材料的研究显着增加。由天然和合成聚合物製成的新型生物墨水专为 3D 生物列印製程而设计。与传统材料相比,这些生物材料具有多种优势,包括提高的生物相容性、可调节的机械性能和改善的细胞黏合性能,这些性能对于组织再生至关重要。
区域洞察
美洲 3D生物製程市场仍然处于领先地位,这主要是由技术进步、成熟的製药工业和坚实的研究基础设施所推动的。美国在美国地区占有重要地位,拥有大量联邦资金来支持 3D 生物列印研究和开发计划。此外,北美的一些学术机构还建立了专用3D生物列印的研究设施。欧洲正在经历慢性病的增加和人口老化,迫切需要更有效的药物和个人化治疗,这推动了 3D 生物列印等生物技术的进步。在欧洲,德国、英国、法国和瑞典等国家正成为製药领域采用3D生物列印技术的重要参与者。近年来,亚洲已成为器官移植中心,随着该地区人口增长、预期寿命延长、慢性病和需要器官移植的疾病数量相应增加,3D生物列印技术的进步正在迅速加速。此外,亚洲国家之间在医学研究和技术方面区域合作的发展也对这一增长做出了重大贡献。印度和中国在开发新颖解决方案方面拥有强大的立足点,专门研究 3D 生物列印技术,例如使用积层製造製程的生物人工器官。
FPNV定位矩阵
FPNV定位矩阵对于评估3D生物列印市场至关重要。我们检视与业务策略和产品满意度相关的关键指标,以对供应商进行全面评估。这种深入的分析使用户能够根据自己的要求做出明智的决策。根据评估,供应商被分为四个成功程度不同的像限:前沿(F)、探路者(P)、利基(N)和重要(V)。
市场占有率分析
市场占有率分析是一种综合工具,可对 3D 生物列印市场中供应商的现状进行深入而详细的研究。全面比较和分析供应商在整体收益、基本客群和其他关键指标方面的贡献,以便更好地了解公司的绩效及其在争夺市场占有率时面临的挑战。此外,该分析还提供了对该行业竞争特征的宝贵见解,包括在研究基准年观察到的累积、分散主导地位和合併特征等因素。这种详细程度的提高使供应商能够做出更明智的决策并制定有效的策略,从而在市场上获得竞争优势。
该报告对以下几个方面提供了宝贵的见解:
1-市场渗透率:提供有关主要企业所服务的市场的全面资讯。
2-市场开拓:我们深入研究利润丰厚的新兴市场,并分析它们在成熟细分市场中的渗透率。
3- 市场多元化:提供有关新产品发布、开拓地区、最新发展和投资的详细资讯。
4-竞争力评估与资讯:对主要企业的市场占有率、策略、产品、认证、监管状况、专利状况、製造能力等进行全面评估。
5- 产品开发与创新:提供对未来技术、研发活动和突破性产品开发的见解。
本报告解决了以下关键问题:
1-生物3D列印市场的市场规模与预测是多少?
2-在 3D 生物列印市场的预测期内,有哪些产品、细分市场、应用和领域需要考虑投资?
3-3D生物列印市场的技术趋势和法律规范是什么?
4-生物3D列印市场主要厂商的市场占有率是多少?
5-进入3D生物列印市场的适当型态和策略手段是什么?
目录
第一章 前言
第二章调查方法
第三章执行摘要
第四章市场概况
第五章市场洞察
- 市场动态
- 促进因素
- 对疾病建模和组织工程的需求不断增长
- 药物和锭剂研究中越来越多地采用 3D 生物列印
- 抑制因素
- 对合适印刷材料的可扩展性和可用性的担忧
- 机会
- 增加为博士学术计划提供的研究经费
- 3D 生物列印机和生医材料的爆炸性进步
- 任务
- 进行细胞生物学研究是资本密集的
- 促进因素
- 市场区隔分析
- 市场趋势分析
- 高通膨的累积效应
- 波特五力分析
- 价值炼和关键路径分析
- 法律规范
第 6 章 3D 生物列印市场:按组成部分
- 3D生物列印机
- 生物墨水
第 7 章 3D 生物列印市场:依技术分类
- 基于挤压的生物列印
- 基于喷墨的生物列印
- 雷射辅助生物列印
第 8 章 3D 生物列印市场:依最终用户划分
- 製药和生物技术公司
- 调查机构
第9章美洲3D生物列印市场
- 阿根廷
- 巴西
- 加拿大
- 墨西哥
- 美国
第10章亚太3D生物列印市场
- 澳洲
- 中国
- 印度
- 印尼
- 日本
- 马来西亚
- 菲律宾
- 新加坡
- 韩国
- 台湾
- 泰国
- 越南
第十一章欧洲、中东和非洲的3D生物列印市场
- 丹麦
- 埃及
- 芬兰
- 法国
- 德国
- 以色列
- 义大利
- 荷兰
- 奈及利亚
- 挪威
- 波兰
- 卡达
- 俄罗斯
- 沙乌地阿拉伯
- 南非
- 西班牙
- 瑞典
- 瑞士
- 土耳其
- 阿拉伯聯合大公国
- 英国
第十二章竞争形势
- FPNV定位矩阵
- 市场占有率分析:主要企业
- 主要企业竞争情境分析
- 合约、合作和伙伴关係
- 投资、资金筹措
第13章竞争产品组合
- 主要公司简介
- 3D BioFibR
- 3D Bioprinting Solutions
- 3D Systems Corporation
- 3DBio Therapeutics
- Advanced Solutions, Inc.
- Aspect Biosystems Ltd.
- Avay Biosciences Private Limited
- Axolotl Biosystems Ltd.
- BICO Group AB
- Brinter Inc.
- Cellbricks GmbH
- CollPlant Biotechnologies Ltd.
- Cyfuse Biomedical KK
- Desktop Metal, Inc.
- Fluicell AB
- FluidForm
- GE HealthCare Technologies Inc.
- GeSiM
- Inventia Life Science Pty Ltd.
- Medprin Regenerative Medical Technologies Co., Ltd.
- Organovo Holdings Inc.
- Pandorum Technologies Pvt. Ltd.
- Precise Bio Inc.
- Prellis Biologics
- REGEMAT 3D SL
- regenHU Ltd.
- Regenovo Biotechnology Co., Ltd. by Shining 3D Tech Co., Ltd.
- ROKIT Healthcare Inc.
- TheWell Bioscience Inc.
- UpNano
- 主要产品系列
第十四章附录
- 讨论指南
- 关于许可证和定价
[180 Pages Report] The 3D Bioprinting Market size was estimated at USD 1.79 billion in 2023 and expected to reach USD 2.14 billion in 2024, at a CAGR 19.89% to reach USD 6.39 billion by 2030.
Global 3D Bioprinting Market
| KEY MARKET STATISTICS | |
|---|---|
| Base Year [2023] | USD 1.79 billion |
| Estimated Year [2024] | USD 2.14 billion |
| Forecast Year [2030] | USD 6.39 billion |
| CAGR (%) | 19.89% |
3D bioprinting is an innovative technology that merges bioinks and living cells to fabricate 3D structures resembling tissues. This process entails printing the bioink and cell mixture layer by layer in a three-dimensional space. In recent years, the demand for 3D bioprinting technologies has experienced significant growth, emerging as a vital tool in various biomedical applications. Disease modeling and tissue engineering are two critical areas where this innovative technology is making a substantial impact. The rising prevalence of chronic diseases globally and an increasing need for effective treatments have spurred researchers to explore the potential of 3D bioprinting in revolutionizing healthcare. Additionally, there has been a rising demand for personalized medicine applications that necessitate patient-specific drug formulations and treatments tailored to individual needs, where 3D bioprinting plays an essential role by allowing for customization based on patients' genetic profiles or disease characteristics. Scalability remains a significant challenge for 3D bioprinting as current technologies are primarily focused on producing smaller tissue constructs. Creating larger and more complex tissues and organs requires advancements in both the speed and precision of printing processes. However, there has been a marked increase in research focused on developing novel biomaterials for 3D bioprinting applications in recent years. New bioinks composed of natural and synthetic polymers are designed specifically for 3D bioprinting processes. These biomaterials offer several advantages over conventional materials, including enhanced biocompatibility, tunable mechanical properties, and improved cell adhesion characteristics which are essentially required for tissue regeneration.
Regional Insights
The Americas 3D bioprocessing market has remained at the forefront, mainly driven by technological advancement, a well-established pharmaceutical industry, and robust research infrastructure. The United States witnessed a significant position in the American region with notable federal funding to support R&D projects in 3D bioprinting. Furthermore, several North American academic institutions have established dedicated 3D bioprinting research facilities. Europe has been witnessing an increasing prevalence of chronic diseases and an expanding geriatric population, creating an urgent need for more effective pharmaceutical drugs and personalized treatments, which has boosted the advancements in biotechnology, such as 3D bioprinting. Across Europe, countries such as Germany, the UK, France, and Sweden have emerged as key players in adopting 3D bioprinting technologies within their pharmaceutical sectors. In recent years, Asia has emerged as a rising hub for organ transplantation, and 3D bioprinting advancements surged majorly due to the region's growing population, its increasing life expectancy, and the subsequent rise in chronic diseases and ailments requiring organ transplants. Furthermore, the development of regional collaboration among Asian countries in medical research and technology has significantly contributed to this growth. India and China have established their strong foothold in developing novel solutions and specializing in 3D bioprinting technologies such as bioartificial organs using additive manufacturing processes.
FPNV Positioning Matrix
The FPNV Positioning Matrix is pivotal in evaluating the 3D Bioprinting Market. It offers a comprehensive assessment of vendors, examining key metrics related to Business Strategy and Product Satisfaction. This in-depth analysis empowers users to make well-informed decisions aligned with their requirements. Based on the evaluation, the vendors are then categorized into four distinct quadrants representing varying levels of success: Forefront (F), Pathfinder (P), Niche (N), or Vital (V).
Market Share Analysis
The Market Share Analysis is a comprehensive tool that provides an insightful and in-depth examination of the current state of vendors in the 3D Bioprinting Market. By meticulously comparing and analyzing vendor contributions in terms of overall revenue, customer base, and other key metrics, we can offer companies a greater understanding of their performance and the challenges they face when competing for market share. Additionally, this analysis provides valuable insights into the competitive nature of the sector, including factors such as accumulation, fragmentation dominance, and amalgamation traits observed over the base year period studied. With this expanded level of detail, vendors can make more informed decisions and devise effective strategies to gain a competitive edge in the market.
Key Company Profiles
The report delves into recent significant developments in the 3D Bioprinting Market, highlighting leading vendors and their innovative profiles. These include 3D BioFibR, 3D Bioprinting Solutions, 3D Systems Corporation, 3DBio Therapeutics, Advanced Solutions, Inc., Aspect Biosystems Ltd., Avay Biosciences Private Limited, Axolotl Biosystems Ltd., BICO Group AB, Brinter Inc., Cellbricks GmbH, CollPlant Biotechnologies Ltd., Cyfuse Biomedical K.K., Desktop Metal, Inc., Fluicell AB, FluidForm, GE HealthCare Technologies Inc., GeSiM, Inventia Life Science Pty Ltd., Medprin Regenerative Medical Technologies Co., Ltd., Organovo Holdings Inc., Pandorum Technologies Pvt. Ltd., Precise Bio Inc., Prellis Biologics, REGEMAT 3D S.L., regenHU Ltd., Regenovo Biotechnology Co., Ltd. by Shining 3D Tech Co., Ltd., ROKIT Healthcare Inc., TheWell Bioscience Inc., and UpNano.
Market Segmentation & Coverage
This research report categorizes the 3D Bioprinting Market to forecast the revenues and analyze trends in each of the following sub-markets:
- Component
- 3D Bioprinters
- Bioinks
- Technology
- Extrusion-based Bioprinting
- Inkjet-based Bioprinting
- Laser-assisted Bioprinting
- End-user
- Pharmaceutical & Biotechnology Companies
- Research Organizations
- Region
- Americas
- Argentina
- Brazil
- Canada
- Mexico
- United States
- California
- Florida
- Illinois
- New York
- Ohio
- Pennsylvania
- Texas
- Asia-Pacific
- Australia
- China
- India
- Indonesia
- Japan
- Malaysia
- Philippines
- Singapore
- South Korea
- Taiwan
- Thailand
- Vietnam
- Europe, Middle East & Africa
- Denmark
- Egypt
- Finland
- France
- Germany
- Israel
- Italy
- Netherlands
- Nigeria
- Norway
- Poland
- Qatar
- Russia
- Saudi Arabia
- South Africa
- Spain
- Sweden
- Switzerland
- Turkey
- United Arab Emirates
- United Kingdom
- Americas
The report offers valuable insights on the following aspects:
1. Market Penetration: It presents comprehensive information on the market provided by key players.
2. Market Development: It delves deep into lucrative emerging markets and analyzes the penetration across mature market segments.
3. Market Diversification: It provides detailed information on new product launches, untapped geographic regions, recent developments, and investments.
4. Competitive Assessment & Intelligence: It conducts an exhaustive assessment of market shares, strategies, products, certifications, regulatory approvals, patent landscape, and manufacturing capabilities of the leading players.
5. Product Development & Innovation: It offers intelligent insights on future technologies, R&D activities, and breakthrough product developments.
The report addresses key questions such as:
1. What is the market size and forecast of the 3D Bioprinting Market?
2. Which products, segments, applications, and areas should one consider investing in over the forecast period in the 3D Bioprinting Market?
3. What are the technology trends and regulatory frameworks in the 3D Bioprinting Market?
4. What is the market share of the leading vendors in the 3D Bioprinting Market?
5. Which modes and strategic moves are suitable for entering the 3D Bioprinting Market?
Table of Contents
1. Preface
- 1.1. Objectives of the Study
- 1.2. Market Segmentation & Coverage
- 1.3. Years Considered for the Study
- 1.4. Currency & Pricing
- 1.5. Language
- 1.6. Limitations
- 1.7. Assumptions
- 1.8. Stakeholders
2. Research Methodology
- 2.1. Define: Research Objective
- 2.2. Determine: Research Design
- 2.3. Prepare: Research Instrument
- 2.4. Collect: Data Source
- 2.5. Analyze: Data Interpretation
- 2.6. Formulate: Data Verification
- 2.7. Publish: Research Report
- 2.8. Repeat: Report Update
3. Executive Summary
4. Market Overview
- 4.1. Introduction
- 4.2. 3D Bioprinting Market, by Region
5. Market Insights
- 5.1. Market Dynamics
- 5.1.1. Drivers
- 5.1.1.1. Rising demand for disease modeling and tissue engineering
- 5.1.1.2. Increase in deployment of 3D bioprinting across research of drugs and pills
- 5.1.2. Restraints
- 5.1.2.1. Concern over scalability and availability of suitable printing materials
- 5.1.3. Opportunities
- 5.1.3.1. Increasing research funding provided to doctoral academic projects
- 5.1.3.2. Proliferation in advancements of 3D bioprinters and biomaterials
- 5.1.4. Challenges
- 5.1.4.1. Capital intensive to perform cell biology research
- 5.1.1. Drivers
- 5.2. Market Segmentation Analysis
- 5.3. Market Trend Analysis
- 5.4. Cumulative Impact of High Inflation
- 5.5. Porter's Five Forces Analysis
- 5.5.1. Threat of New Entrants
- 5.5.2. Threat of Substitutes
- 5.5.3. Bargaining Power of Customers
- 5.5.4. Bargaining Power of Suppliers
- 5.5.5. Industry Rivalry
- 5.6. Value Chain & Critical Path Analysis
- 5.7. Regulatory Framework
6. 3D Bioprinting Market, by Component
- 6.1. Introduction
- 6.2. 3D Bioprinters
- 6.3. Bioinks
7. 3D Bioprinting Market, by Technology
- 7.1. Introduction
- 7.2. Extrusion-based Bioprinting
- 7.3. Inkjet-based Bioprinting
- 7.4. Laser-assisted Bioprinting
8. 3D Bioprinting Market, by End-user
- 8.1. Introduction
- 8.2. Pharmaceutical & Biotechnology Companies
- 8.3. Research Organizations
9. Americas 3D Bioprinting Market
- 9.1. Introduction
- 9.2. Argentina
- 9.3. Brazil
- 9.4. Canada
- 9.5. Mexico
- 9.6. United States
10. Asia-Pacific 3D Bioprinting Market
- 10.1. Introduction
- 10.2. Australia
- 10.3. China
- 10.4. India
- 10.5. Indonesia
- 10.6. Japan
- 10.7. Malaysia
- 10.8. Philippines
- 10.9. Singapore
- 10.10. South Korea
- 10.11. Taiwan
- 10.12. Thailand
- 10.13. Vietnam
11. Europe, Middle East & Africa 3D Bioprinting Market
- 11.1. Introduction
- 11.2. Denmark
- 11.3. Egypt
- 11.4. Finland
- 11.5. France
- 11.6. Germany
- 11.7. Israel
- 11.8. Italy
- 11.9. Netherlands
- 11.10. Nigeria
- 11.11. Norway
- 11.12. Poland
- 11.13. Qatar
- 11.14. Russia
- 11.15. Saudi Arabia
- 11.16. South Africa
- 11.17. Spain
- 11.18. Sweden
- 11.19. Switzerland
- 11.20. Turkey
- 11.21. United Arab Emirates
- 11.22. United Kingdom
12. Competitive Landscape
- 12.1. FPNV Positioning Matrix
- 12.2. Market Share Analysis, By Key Player
- 12.3. Competitive Scenario Analysis, By Key Player
- 12.3.1. Agreement, Collaboration, & Partnership
- 12.3.1.1. Stratasys enters bioprinting partnership with CollPlant; announces bioprinter based on P3 technology
- 12.3.1.2. Centre of Excellence for 3D bioprinting inaugurated at IISc Bangalore
- 12.3.2. Investment & Funding
- 12.3.2.1. 3D BioFibR Raises Over USD 3.52 Million To Bring 3D Bioprinting Collagen Fiber Products To Market.
- 12.3.1. Agreement, Collaboration, & Partnership
13. Competitive Portfolio
- 13.1. Key Company Profiles
- 13.1.1. 3D BioFibR
- 13.1.2. 3D Bioprinting Solutions
- 13.1.3. 3D Systems Corporation
- 13.1.4. 3DBio Therapeutics
- 13.1.5. Advanced Solutions, Inc.
- 13.1.6. Aspect Biosystems Ltd.
- 13.1.7. Avay Biosciences Private Limited
- 13.1.8. Axolotl Biosystems Ltd.
- 13.1.9. BICO Group AB
- 13.1.10. Brinter Inc.
- 13.1.11. Cellbricks GmbH
- 13.1.12. CollPlant Biotechnologies Ltd.
- 13.1.13. Cyfuse Biomedical K.K.
- 13.1.14. Desktop Metal, Inc.
- 13.1.15. Fluicell AB
- 13.1.16. FluidForm
- 13.1.17. GE HealthCare Technologies Inc.
- 13.1.18. GeSiM
- 13.1.19. Inventia Life Science Pty Ltd.
- 13.1.20. Medprin Regenerative Medical Technologies Co., Ltd.
- 13.1.21. Organovo Holdings Inc.
- 13.1.22. Pandorum Technologies Pvt. Ltd.
- 13.1.23. Precise Bio Inc.
- 13.1.24. Prellis Biologics
- 13.1.25. REGEMAT 3D S.L.
- 13.1.26. regenHU Ltd.
- 13.1.27. Regenovo Biotechnology Co., Ltd. by Shining 3D Tech Co., Ltd.
- 13.1.28. ROKIT Healthcare Inc.
- 13.1.29. TheWell Bioscience Inc.
- 13.1.30. UpNano
- 13.2. Key Product Portfolio
14. Appendix
- 14.1. Discussion Guide
- 14.2. License & Pricing
LIST OF FIGURES
- FIGURE 1. 3D BIOPRINTING MARKET RESEARCH PROCESS
- FIGURE 2. 3D BIOPRINTING MARKET SIZE, 2023 VS 2030
- FIGURE 3. 3D BIOPRINTING MARKET SIZE, 2018-2030 (USD MILLION)
- FIGURE 4. 3D BIOPRINTING MARKET SIZE, BY REGION, 2023 VS 2030 (%)
- FIGURE 5. 3D BIOPRINTING MARKET SIZE, BY REGION, 2023 VS 2024 VS 2030 (USD MILLION)
- FIGURE 6. 3D BIOPRINTING MARKET DYNAMICS
- FIGURE 7. 3D BIOPRINTING MARKET SIZE, BY COMPONENT, 2023 VS 2030 (%)
- FIGURE 8. 3D BIOPRINTING MARKET SIZE, BY COMPONENT, 2023 VS 2024 VS 2030 (USD MILLION)
- FIGURE 9. 3D BIOPRINTING MARKET SIZE, BY TECHNOLOGY, 2023 VS 2030 (%)
- FIGURE 10. 3D BIOPRINTING MARKET SIZE, BY TECHNOLOGY, 2023 VS 2024 VS 2030 (USD MILLION)
- FIGURE 11. 3D BIOPRINTING MARKET SIZE, BY END-USER, 2023 VS 2030 (%)
- FIGURE 12. 3D BIOPRINTING MARKET SIZE, BY END-USER, 2023 VS 2024 VS 2030 (USD MILLION)
- FIGURE 13. AMERICAS 3D BIOPRINTING MARKET SIZE, BY COUNTRY, 2023 VS 2030 (%)
- FIGURE 14. AMERICAS 3D BIOPRINTING MARKET SIZE, BY COUNTRY, 2023 VS 2024 VS 2030 (USD MILLION)
- FIGURE 15. UNITED STATES 3D BIOPRINTING MARKET SIZE, BY STATE, 2023 VS 2030 (%)
- FIGURE 16. UNITED STATES 3D BIOPRINTING MARKET SIZE, BY STATE, 2023 VS 2024 VS 2030 (USD MILLION)
- FIGURE 17. ASIA-PACIFIC 3D BIOPRINTING MARKET SIZE, BY COUNTRY, 2023 VS 2030 (%)
- FIGURE 18. ASIA-PACIFIC 3D BIOPRINTING MARKET SIZE, BY COUNTRY, 2023 VS 2024 VS 2030 (USD MILLION)
- FIGURE 19. EUROPE, MIDDLE EAST & AFRICA 3D BIOPRINTING MARKET SIZE, BY COUNTRY, 2023 VS 2030 (%)
- FIGURE 20. EUROPE, MIDDLE EAST & AFRICA 3D BIOPRINTING MARKET SIZE, BY COUNTRY, 2023 VS 2024 VS 2030 (USD MILLION)
- FIGURE 21. 3D BIOPRINTING MARKET, FPNV POSITIONING MATRIX, 2023
- FIGURE 22. 3D BIOPRINTING MARKET SHARE, BY KEY PLAYER, 2023
LIST OF TABLES
- TABLE 1. 3D BIOPRINTING MARKET SEGMENTATION & COVERAGE
- TABLE 2. UNITED STATES DOLLAR EXCHANGE RATE, 2018-2023
- TABLE 3. 3D BIOPRINTING MARKET SIZE, 2018-2030 (USD MILLION)
- TABLE 4. GLOBAL 3D BIOPRINTING MARKET SIZE, BY REGION, 2018-2030 (USD MILLION)
- TABLE 5. 3D BIOPRINTING MARKET SIZE, BY COMPONENT, 2018-2030 (USD MILLION)
- TABLE 6. 3D BIOPRINTING MARKET SIZE, BY 3D BIOPRINTERS, BY REGION, 2018-2030 (USD MILLION)
- TABLE 7. 3D BIOPRINTING MARKET SIZE, BY BIOINKS, BY REGION, 2018-2030 (USD MILLION)
- TABLE 8. 3D BIOPRINTING MARKET SIZE, BY TECHNOLOGY, 2018-2030 (USD MILLION)
- TABLE 9. 3D BIOPRINTING MARKET SIZE, BY EXTRUSION-BASED BIOPRINTING, BY REGION, 2018-2030 (USD MILLION)
- TABLE 10. 3D BIOPRINTING MARKET SIZE, BY INKJET-BASED BIOPRINTING, BY REGION, 2018-2030 (USD MILLION)
- TABLE 11. 3D BIOPRINTING MARKET SIZE, BY LASER-ASSISTED BIOPRINTING, BY REGION, 2018-2030 (USD MILLION)
- TABLE 12. 3D BIOPRINTING MARKET SIZE, BY END-USER, 2018-2030 (USD MILLION)
- TABLE 13. 3D BIOPRINTING MARKET SIZE, BY PHARMACEUTICAL & BIOTECHNOLOGY COMPANIES, BY REGION, 2018-2030 (USD MILLION)
- TABLE 14. 3D BIOPRINTING MARKET SIZE, BY RESEARCH ORGANIZATIONS, BY REGION, 2018-2030 (USD MILLION)
- TABLE 15. AMERICAS 3D BIOPRINTING MARKET SIZE, BY COMPONENT, 2018-2030 (USD MILLION)
- TABLE 16. AMERICAS 3D BIOPRINTING MARKET SIZE, BY TECHNOLOGY, 2018-2030 (USD MILLION)
- TABLE 17. AMERICAS 3D BIOPRINTING MARKET SIZE, BY END-USER, 2018-2030 (USD MILLION)
- TABLE 18. AMERICAS 3D BIOPRINTING MARKET SIZE, BY COUNTRY, 2018-2030 (USD MILLION)
- TABLE 19. ARGENTINA 3D BIOPRINTING MARKET SIZE, BY COMPONENT, 2018-2030 (USD MILLION)
- TABLE 20. ARGENTINA 3D BIOPRINTING MARKET SIZE, BY TECHNOLOGY, 2018-2030 (USD MILLION)
- TABLE 21. ARGENTINA 3D BIOPRINTING MARKET SIZE, BY END-USER, 2018-2030 (USD MILLION)
- TABLE 22. BRAZIL 3D BIOPRINTING MARKET SIZE, BY COMPONENT, 2018-2030 (USD MILLION)
- TABLE 23. BRAZIL 3D BIOPRINTING MARKET SIZE, BY TECHNOLOGY, 2018-2030 (USD MILLION)
- TABLE 24. BRAZIL 3D BIOPRINTING MARKET SIZE, BY END-USER, 2018-2030 (USD MILLION)
- TABLE 25. CANADA 3D BIOPRINTING MARKET SIZE, BY COMPONENT, 2018-2030 (USD MILLION)
- TABLE 26. CANADA 3D BIOPRINTING MARKET SIZE, BY TECHNOLOGY, 2018-2030 (USD MILLION)
- TABLE 27. CANADA 3D BIOPRINTING MARKET SIZE, BY END-USER, 2018-2030 (USD MILLION)
- TABLE 28. MEXICO 3D BIOPRINTING MARKET SIZE, BY COMPONENT, 2018-2030 (USD MILLION)
- TABLE 29. MEXICO 3D BIOPRINTING MARKET SIZE, BY TECHNOLOGY, 2018-2030 (USD MILLION)
- TABLE 30. MEXICO 3D BIOPRINTING MARKET SIZE, BY END-USER, 2018-2030 (USD MILLION)
- TABLE 31. UNITED STATES 3D BIOPRINTING MARKET SIZE, BY COMPONENT, 2018-2030 (USD MILLION)
- TABLE 32. UNITED STATES 3D BIOPRINTING MARKET SIZE, BY TECHNOLOGY, 2018-2030 (USD MILLION)
- TABLE 33. UNITED STATES 3D BIOPRINTING MARKET SIZE, BY END-USER, 2018-2030 (USD MILLION)
- TABLE 34. UNITED STATES 3D BIOPRINTING MARKET SIZE, BY STATE, 2018-2030 (USD MILLION)
- TABLE 35. ASIA-PACIFIC 3D BIOPRINTING MARKET SIZE, BY COMPONENT, 2018-2030 (USD MILLION)
- TABLE 36. ASIA-PACIFIC 3D BIOPRINTING MARKET SIZE, BY TECHNOLOGY, 2018-2030 (USD MILLION)
- TABLE 37. ASIA-PACIFIC 3D BIOPRINTING MARKET SIZE, BY END-USER, 2018-2030 (USD MILLION)
- TABLE 38. ASIA-PACIFIC 3D BIOPRINTING MARKET SIZE, BY COUNTRY, 2018-2030 (USD MILLION)
- TABLE 39. AUSTRALIA 3D BIOPRINTING MARKET SIZE, BY COMPONENT, 2018-2030 (USD MILLION)
- TABLE 40. AUSTRALIA 3D BIOPRINTING MARKET SIZE, BY TECHNOLOGY, 2018-2030 (USD MILLION)
- TABLE 41. AUSTRALIA 3D BIOPRINTING MARKET SIZE, BY END-USER, 2018-2030 (USD MILLION)
- TABLE 42. CHINA 3D BIOPRINTING MARKET SIZE, BY COMPONENT, 2018-2030 (USD MILLION)
- TABLE 43. CHINA 3D BIOPRINTING MARKET SIZE, BY TECHNOLOGY, 2018-2030 (USD MILLION)
- TABLE 44. CHINA 3D BIOPRINTING MARKET SIZE, BY END-USER, 2018-2030 (USD MILLION)
- TABLE 45. INDIA 3D BIOPRINTING MARKET SIZE, BY COMPONENT, 2018-2030 (USD MILLION)
- TABLE 46. INDIA 3D BIOPRINTING MARKET SIZE, BY TECHNOLOGY, 2018-2030 (USD MILLION)
- TABLE 47. INDIA 3D BIOPRINTING MARKET SIZE, BY END-USER, 2018-2030 (USD MILLION)
- TABLE 48. INDONESIA 3D BIOPRINTING MARKET SIZE, BY COMPONENT, 2018-2030 (USD MILLION)
- TABLE 49. INDONESIA 3D BIOPRINTING MARKET SIZE, BY TECHNOLOGY, 2018-2030 (USD MILLION)
- TABLE 50. INDONESIA 3D BIOPRINTING MARKET SIZE, BY END-USER, 2018-2030 (USD MILLION)
- TABLE 51. JAPAN 3D BIOPRINTING MARKET SIZE, BY COMPONENT, 2018-2030 (USD MILLION)
- TABLE 52. JAPAN 3D BIOPRINTING MARKET SIZE, BY TECHNOLOGY, 2018-2030 (USD MILLION)
- TABLE 53. JAPAN 3D BIOPRINTING MARKET SIZE, BY END-USER, 2018-2030 (USD MILLION)
- TABLE 54. MALAYSIA 3D BIOPRINTING MARKET SIZE, BY COMPONENT, 2018-2030 (USD MILLION)
- TABLE 55. MALAYSIA 3D BIOPRINTING MARKET SIZE, BY TECHNOLOGY, 2018-2030 (USD MILLION)
- TABLE 56. MALAYSIA 3D BIOPRINTING MARKET SIZE, BY END-USER, 2018-2030 (USD MILLION)
- TABLE 57. PHILIPPINES 3D BIOPRINTING MARKET SIZE, BY COMPONENT, 2018-2030 (USD MILLION)
- TABLE 58. PHILIPPINES 3D BIOPRINTING MARKET SIZE, BY TECHNOLOGY, 2018-2030 (USD MILLION)
- TABLE 59. PHILIPPINES 3D BIOPRINTING MARKET SIZE, BY END-USER, 2018-2030 (USD MILLION)
- TABLE 60. SINGAPORE 3D BIOPRINTING MARKET SIZE, BY COMPONENT, 2018-2030 (USD MILLION)
- TABLE 61. SINGAPORE 3D BIOPRINTING MARKET SIZE, BY TECHNOLOGY, 2018-2030 (USD MILLION)
- TABLE 62. SINGAPORE 3D BIOPRINTING MARKET SIZE, BY END-USER, 2018-2030 (USD MILLION)
- TABLE 63. SOUTH KOREA 3D BIOPRINTING MARKET SIZE, BY COMPONENT, 2018-2030 (USD MILLION)
- TABLE 64. SOUTH KOREA 3D BIOPRINTING MARKET SIZE, BY TECHNOLOGY, 2018-2030 (USD MILLION)
- TABLE 65. SOUTH KOREA 3D BIOPRINTING MARKET SIZE, BY END-USER, 2018-2030 (USD MILLION)
- TABLE 66. TAIWAN 3D BIOPRINTING MARKET SIZE, BY COMPONENT, 2018-2030 (USD MILLION)
- TABLE 67. TAIWAN 3D BIOPRINTING MARKET SIZE, BY TECHNOLOGY, 2018-2030 (USD MILLION)
- TABLE 68. TAIWAN 3D BIOPRINTING MARKET SIZE, BY END-USER, 2018-2030 (USD MILLION)
- TABLE 69. THAILAND 3D BIOPRINTING MARKET SIZE, BY COMPONENT, 2018-2030 (USD MILLION)
- TABLE 70. THAILAND 3D BIOPRINTING MARKET SIZE, BY TECHNOLOGY, 2018-2030 (USD MILLION)
- TABLE 71. THAILAND 3D BIOPRINTING MARKET SIZE, BY END-USER, 2018-2030 (USD MILLION)
- TABLE 72. VIETNAM 3D BIOPRINTING MARKET SIZE, BY COMPONENT, 2018-2030 (USD MILLION)
- TABLE 73. VIETNAM 3D BIOPRINTING MARKET SIZE, BY TECHNOLOGY, 2018-2030 (USD MILLION)
- TABLE 74. VIETNAM 3D BIOPRINTING MARKET SIZE, BY END-USER, 2018-2030 (USD MILLION)
- TABLE 75. EUROPE, MIDDLE EAST & AFRICA 3D BIOPRINTING MARKET SIZE, BY COMPONENT, 2018-2030 (USD MILLION)
- TABLE 76. EUROPE, MIDDLE EAST & AFRICA 3D BIOPRINTING MARKET SIZE, BY TECHNOLOGY, 2018-2030 (USD MILLION)
- TABLE 77. EUROPE, MIDDLE EAST & AFRICA 3D BIOPRINTING MARKET SIZE, BY END-USER, 2018-2030 (USD MILLION)
- TABLE 78. EUROPE, MIDDLE EAST & AFRICA 3D BIOPRINTING MARKET SIZE, BY COUNTRY, 2018-2030 (USD MILLION)
- TABLE 79. DENMARK 3D BIOPRINTING MARKET SIZE, BY COMPONENT, 2018-2030 (USD MILLION)
- TABLE 80. DENMARK 3D BIOPRINTING MARKET SIZE, BY TECHNOLOGY, 2018-2030 (USD MILLION)
- TABLE 81. DENMARK 3D BIOPRINTING MARKET SIZE, BY END-USER, 2018-2030 (USD MILLION)
- TABLE 82. EGYPT 3D BIOPRINTING MARKET SIZE, BY COMPONENT, 2018-2030 (USD MILLION)
- TABLE 83. EGYPT 3D BIOPRINTING MARKET SIZE, BY TECHNOLOGY, 2018-2030 (USD MILLION)
- TABLE 84. EGYPT 3D BIOPRINTING MARKET SIZE, BY END-USER, 2018-2030 (USD MILLION)
- TABLE 85. FINLAND 3D BIOPRINTING MARKET SIZE, BY COMPONENT, 2018-2030 (USD MILLION)
- TABLE 86. FINLAND 3D BIOPRINTING MARKET SIZE, BY TECHNOLOGY, 2018-2030 (USD MILLION)
- TABLE 87. FINLAND 3D BIOPRINTING MARKET SIZE, BY END-USER, 2018-2030 (USD MILLION)
- TABLE 88. FRANCE 3D BIOPRINTING MARKET SIZE, BY COMPONENT, 2018-2030 (USD MILLION)
- TABLE 89. FRANCE 3D BIOPRINTING MARKET SIZE, BY TECHNOLOGY, 2018-2030 (USD MILLION)
- TABLE 90. FRANCE 3D BIOPRINTING MARKET SIZE, BY END-USER, 2018-2030 (USD MILLION)
- TABLE 91. GERMANY 3D BIOPRINTING MARKET SIZE, BY COMPONENT, 2018-2030 (USD MILLION)
- TABLE 92. GERMANY 3D BIOPRINTING MARKET SIZE, BY TECHNOLOGY, 2018-2030 (USD MILLION)
- TABLE 93. GERMANY 3D BIOPRINTING MARKET SIZE, BY END-USER, 2018-2030 (USD MILLION)
- TABLE 94. ISRAEL 3D BIOPRINTING MARKET SIZE, BY COMPONENT, 2018-2030 (USD MILLION)
- TABLE 95. ISRAEL 3D BIOPRINTING MARKET SIZE, BY TECHNOLOGY, 2018-2030 (USD MILLION)
- TABLE 96. ISRAEL 3D BIOPRINTING MARKET SIZE, BY END-USER, 2018-2030 (USD MILLION)
- TABLE 97. ITALY 3D BIOPRINTING MARKET SIZE, BY COMPONENT, 2018-2030 (USD MILLION)
- TABLE 98. ITALY 3D BIOPRINTING MARKET SIZE, BY TECHNOLOGY, 2018-2030 (USD MILLION)
- TABLE 99. ITALY 3D BIOPRINTING MARKET SIZE, BY END-USER, 2018-2030 (USD MILLION)
- TABLE 100. NETHERLANDS 3D BIOPRINTING MARKET SIZE, BY COMPONENT, 2018-2030 (USD MILLION)
- TABLE 101. NETHERLANDS 3D BIOPRINTING MARKET SIZE, BY TECHNOLOGY, 2018-2030 (USD MILLION)
- TABLE 102. NETHERLANDS 3D BIOPRINTING MARKET SIZE, BY END-USER, 2018-2030 (USD MILLION)
- TABLE 103. NIGERIA 3D BIOPRINTING MARKET SIZE, BY COMPONENT, 2018-2030 (USD MILLION)
- TABLE 104. NIGERIA 3D BIOPRINTING MARKET SIZE, BY TECHNOLOGY, 2018-2030 (USD MILLION)
- TABLE 105. NIGERIA 3D BIOPRINTING MARKET SIZE, BY END-USER, 2018-2030 (USD MILLION)
- TABLE 106. NORWAY 3D BIOPRINTING MARKET SIZE, BY COMPONENT, 2018-2030 (USD MILLION)
- TABLE 107. NORWAY 3D BIOPRINTING MARKET SIZE, BY TECHNOLOGY, 2018-2030 (USD MILLION)
- TABLE 108. NORWAY 3D BIOPRINTING MARKET SIZE, BY END-USER, 2018-2030 (USD MILLION)
- TABLE 109. POLAND 3D BIOPRINTING MARKET SIZE, BY COMPONENT, 2018-2030 (USD MILLION)
- TABLE 110. POLAND 3D BIOPRINTING MARKET SIZE, BY TECHNOLOGY, 2018-2030 (USD MILLION)
- TABLE 111. POLAND 3D BIOPRINTING MARKET SIZE, BY END-USER, 2018-2030 (USD MILLION)
- TABLE 112. QATAR 3D BIOPRINTING MARKET SIZE, BY COMPONENT, 2018-2030 (USD MILLION)
- TABLE 113. QATAR 3D BIOPRINTING MARKET SIZE, BY TECHNOLOGY, 2018-2030 (USD MILLION)
- TABLE 114. QATAR 3D BIOPRINTING MARKET SIZE, BY END-USER, 2018-2030 (USD MILLION)
- TABLE 115. RUSSIA 3D BIOPRINTING MARKET SIZE, BY COMPONENT, 2018-2030 (USD MILLION)
- TABLE 116. RUSSIA 3D BIOPRINTING MARKET SIZE, BY TECHNOLOGY, 2018-2030 (USD MILLION)
- TABLE 117. RUSSIA 3D BIOPRINTING MARKET SIZE, BY END-USER, 2018-2030 (USD MILLION)
- TABLE 118. SAUDI ARABIA 3D BIOPRINTING MARKET SIZE, BY COMPONENT, 2018-2030 (USD MILLION)
- TABLE 119. SAUDI ARABIA 3D BIOPRINTING MARKET SIZE, BY TECHNOLOGY, 2018-2030 (USD MILLION)
- TABLE 120. SAUDI ARABIA 3D BIOPRINTING MARKET SIZE, BY END-USER, 2018-2030 (USD MILLION)
- TABLE 121. SOUTH AFRICA 3D BIOPRINTING MARKET SIZE, BY COMPONENT, 2018-2030 (USD MILLION)
- TABLE 122. SOUTH AFRICA 3D BIOPRINTING MARKET SIZE, BY TECHNOLOGY, 2018-2030 (USD MILLION)
- TABLE 123. SOUTH AFRICA 3D BIOPRINTING MARKET SIZE, BY END-USER, 2018-2030 (USD MILLION)
- TABLE 124. SPAIN 3D BIOPRINTING MARKET SIZE, BY COMPONENT, 2018-2030 (USD MILLION)
- TABLE 125. SPAIN 3D BIOPRINTING MARKET SIZE, BY TECHNOLOGY, 2018-2030 (USD MILLION)
- TABLE 126. SPAIN 3D BIOPRINTING MARKET SIZE, BY END-USER, 2018-2030 (USD MILLION)
- TABLE 127. SWEDEN 3D BIOPRINTING MARKET SIZE, BY COMPONENT, 2018-2030 (USD MILLION)
- TABLE 128. SWEDEN 3D BIOPRINTING MARKET SIZE, BY TECHNOLOGY, 2018-2030 (USD MILLION)
- TABLE 129. SWEDEN 3D BIOPRINTING MARKET SIZE, BY END-USER, 2018-2030 (USD MILLION)
- TABLE 130. SWITZERLAND 3D BIOPRINTING MARKET SIZE, BY COMPONENT, 2018-2030 (USD MILLION)
- TABLE 131. SWITZERLAND 3D BIOPRINTING MARKET SIZE, BY TECHNOLOGY, 2018-2030 (USD MILLION)
- TABLE 132. SWITZERLAND 3D BIOPRINTING MARKET SIZE, BY END-USER, 2018-2030 (USD MILLION)
- TABLE 133. TURKEY 3D BIOPRINTING MARKET SIZE, BY COMPONENT, 2018-2030 (USD MILLION)
- TABLE 134. TURKEY 3D BIOPRINTING MARKET SIZE, BY TECHNOLOGY, 2018-2030 (USD MILLION)
- TABLE 135. TURKEY 3D BIOPRINTING MARKET SIZE, BY END-USER, 2018-2030 (USD MILLION)
- TABLE 136. UNITED ARAB EMIRATES 3D BIOPRINTING MARKET SIZE, BY COMPONENT, 2018-2030 (USD MILLION)
- TABLE 137. UNITED ARAB EMIRATES 3D BIOPRINTING MARKET SIZE, BY TECHNOLOGY, 2018-2030 (USD MILLION)
- TABLE 138. UNITED ARAB EMIRATES 3D BIOPRINTING MARKET SIZE, BY END-USER, 2018-2030 (USD MILLION)
- TABLE 139. UNITED KINGDOM 3D BIOPRINTING MARKET SIZE, BY COMPONENT, 2018-2030 (USD MILLION)
- TABLE 140. UNITED KINGDOM 3D BIOPRINTING MARKET SIZE, BY TECHNOLOGY, 2018-2030 (USD MILLION)
- TABLE 141. UNITED KINGDOM 3D BIOPRINTING MARKET SIZE, BY END-USER, 2018-2030 (USD MILLION)
- TABLE 142. 3D BIOPRINTING MARKET, FPNV POSITIONING MATRIX, 2023
- TABLE 143. 3D BIOPRINTING MARKET SHARE, BY KEY PLAYER, 2023
- TABLE 144. 3D BIOPRINTING MARKET LICENSE & PRICING
 2024 年 4D 生物列印全球市场报告
 3D 生物列印人体组织市场,按生物材料类型、按应用、国家和地区 - 2024-2032 年行业分析、市场规模、市场份额和预测
 3D 生物列印人体组织市场报告:2030 年趋势、预测与竞争分析
 2024 年 3D 生物列印全球市场报告
 医疗 3D 生物列印市场:按产品/解决方案、按技术、按应用、按最终用户:2023-2032 年全球机会分析和产业预测
 2023-2028 年按组件(3D 生物列印机、支架、生物材料)、应用(研究、临床)、最终用户(医院、研究组织和学术机构、生物製药公司)和地区分類的 3D 生物列印市场报告
 全球 3D 生物打印市场 - 2023-2030
 4D生物印刷市场:各技术类型,各应用领域,各终端用户,与各主要地区:产业趋势全球预测,2023年~2035年
 3D生物打印的全球市场
 3D生物打印市场:按组件、按技术、按材料、按应用、按国家、按地区 - 行业分析、市场规模、市场份额、预测 2023-2030