


 |
市场调查报告书
商品编码
1434816
沥青市场:依製造方法、应用分类 - 2024-2030 年全球预测Asphalt Market by Manufacturing Method (Cold Mix Asphalt, Hot Mix Asphalt), Application (Coating, Paving Roadways, Water Roofing) - Global Forecast 2024-2030 |
||||||
※ 本网页内容可能与最新版本有所差异。详细情况请与我们联繫。
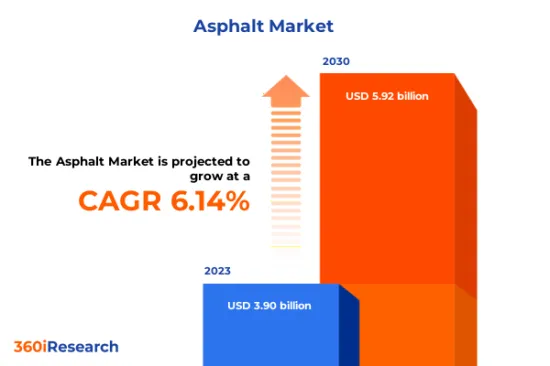
预计2023年沥青市场规模为39亿美元,预计2024年将达41.2亿美元,2030年将达59.2亿美元,复合年增长率为6.14%。
世界沥青市场
| 主要市场统计 | |
|---|---|
| 基准年[2023] | 39亿美元 |
| 预测年份 [2024] | 41.2亿美元 |
| 预测年份 [2030] | 59.2亿美元 |
| 复合年增长率(%) | 6.14% |
沥青,又称柏油,是一种半固态石油,在道路和人行道等各种基础设施的建设和维护中发挥重要作用。天然沥青是由重质原油製成的,经过数百万年的地质过程,形成富含碳氢化合物的浓稠黑色物质。另一方面,精製沥青是透过蒸馏过程生产的,该过程在高温下加热原油并将汽油和柴油等轻质成分与较重成分分离。全球沥青市场涵盖各行业各种沥青材料的生产、分销和应用。沥青主要用于道路建设,如高速公路、桥樑、机场、都市道路等。它也用于其他用途,例如屋顶和防水解决方案、隔热系统以及运动场等休閒表面。世界各地(主要是新兴经济体)加强交通基础设施的需求不断增长,推动了沥青市场的开拓。快速的都市化、工业化以及住宅和商业领域的建设活动进一步推动了这一需求。基础设施计划中的政府投资和私人倡议也为市场扩张提供了有利可图的机会。然而,原油价格的波动直接影响沥青材料的生产成本。此外,与沥青生产过程中温室气体(GHG)排放相关的环境问题导致监管审查力度加大,进一步限制了产业成长。此外,与环保替代品和改进的废弃物方法相关的技术进步预计将减少对环境的影响,同时保持各种最终用途产业所需的高性能标准。
区域洞察
在美洲,美国由于其广泛的道路网络和定期的维护和维修需求,占据了沥青市场的巨大份额。此外,包括巴西和墨西哥在内的南美洲新兴经济体正在大力投资交通基础设施计划,以支持人口和工业成长。由于永续基础设施开拓投资的增加,欧洲、中东和非洲地区的沥青市场成长潜力也很大。特别是在欧洲,我们看到了向环保建筑方法的转变,鼓励回收和使用再生路面(RAP)和温拌路面(WMA)。此趋势符合欧盟注重减少建设活动温室气体排放的法规。此外,中东国家正在大力投资大型基础设施计划,旨在增强城市内部的连结性并实现经济多元化。亚太地区正在经历快速的都市化和工业化,这推动了沥青市场的繁荣。中国和印度这两个人口最多的国家正在大力投资高速公路、机场、桥樑和港口等交通基础设施,以适应不断增长的人口和工业。此外,印尼和越南等国家也正在经历显着的经济成长,对改善交通网络的需求不断增加。因此,预计亚太地区未来几年将成为全球沥青市场成长率最高的地区。
FPNV定位矩阵
FPNV定位矩阵对于评估沥青市场至关重要。我们检视与业务策略和产品满意度相关的关键指标,以对供应商进行全面评估。这种深入的分析使用户能够根据自己的要求做出明智的决策。根据评估,供应商被分为四个成功程度不同的像限:前沿(F)、探路者(P)、利基(N)和重要(V)。
市场占有率分析
市场占有率分析是一种综合工具,可以对沥青市场中供应商的现状进行深入而详细的研究。全面比较和分析供应商在整体收益、基本客群和其他关键指标方面的贡献,以便更好地了解公司的绩效及其在争夺市场占有率时面临的挑战。此外,该分析还提供了对该行业竞争特征的宝贵见解,包括在研究基准年观察到的累积、分散主导地位和合併特征等因素。这种详细程度的提高使供应商能够做出更明智的决策并制定有效的策略,从而在市场上获得竞争优势。
该报告对以下几个方面提供了宝贵的见解:
1-市场渗透率:提供有关主要企业所服务的市场的全面资讯。
2-市场开拓:我们深入研究利润丰厚的新兴市场,并分析它们在成熟细分市场中的渗透率。
3- 市场多元化:提供有关新产品发布、开拓地区、最新发展和投资的详细资讯。
4-竞争力评估与资讯:对主要企业的市场占有率、策略、产品、认证、监管状况、专利状况、製造能力等进行全面评估。
5- 产品开发与创新:提供对未来技术、研发活动和突破性产品开发的见解。
本报告解决了以下关键问题:
1-沥青市场的市场规模和预测是多少?
2-沥青市场预测期内需要考虑投资的产品、细分市场、应用和领域有哪些?
3-沥青市场的技术趋势和法律规范是什么?
4-沥青市场主要供应商的市场占有率是多少?
5-进入沥青市场的合适型态或策略手段是什么?
目录
第一章 前言
第二章调查方法
第三章执行摘要
第四章市场概况
第五章市场洞察
- 市场动态
- 促进因素
- 增加建筑业和製造业投资
- 专注于运河和水库衬砌、大坝表面、港口和海洋工程的维护
- 环境考虑和生物沥青开发
- 抑制因素
- 极端温度和石油产品价格波动下的沥青性能限制
- 机会
- 技术进步创造高性能沥青
- 沥青生产设施投资扩大
- 任务
- 与沥青生产和回收相关的环境问题
- 促进因素
- 市场区隔分析
- 製造方法:增加基础设施开发以及维护计划中对錶面处理更好选择的需求。
- 应用程式:重要的应用程式是为满足您的特定需求和要求而量身定制的。
- 市场趋势分析
- 高通膨的累积效应
- 波特五力分析
- 价值炼和关键路径分析
- 法律规范
第六章 依製造方法分類的沥青市场
- 冷拌沥青
- 热拌沥青
第七章 沥青市场:依应用分类
- 涂层
- 铺路
- 防水屋顶
第八章 北美、南美沥青市场
- 阿根廷
- 巴西
- 加拿大
- 墨西哥
- 美国
第九章亚太地区沥青市场
- 澳洲
- 中国
- 印度
- 印尼
- 日本
- 马来西亚
- 菲律宾
- 新加坡
- 韩国
- 台湾
- 泰国
- 越南
第10章欧洲、中东、非洲沥青市场
- 丹麦
- 埃及
- 芬兰
- 法国
- 德国
- 以色列
- 义大利
- 荷兰
- 奈及利亚
- 挪威
- 波兰
- 卡达
- 俄罗斯
- 沙乌地阿拉伯
- 南非
- 西班牙
- 瑞典
- 瑞士
- 土耳其
- 阿拉伯聯合大公国
- 英国
第十一章竞争形势
- FPNV定位矩阵
- 市场占有率分析:按主要企业划分
- 主要企业竞争情境分析
- 併购
- 新产品发布和功能增强
第12章竞争产品组合
- 主要公司简介
- Alltech Group
- Boral Limited
- BP PLC
- Cement Roadstone Holdings PLC
- CEPSA Comercial Petroleo, SA
- Chevron Corporation
- Ergon, Inc.
- Exxon Mobil Corporation
- Grupa LOTOS
- HollyFrontier Corporation
- Indian Oil Corporation Ltd.
- Lukoil
- Marathon Petroleum Corporation
- NuStar Energy LP
- OMV AG
- PT Pertamina International EP
- Puma Energy
- Repsol SA
- Royal Dutch Shell PLC
- Sasol Germany GmbH
- SK Energy Co., Ltd.
- Sonatrach Petroleum Corporation
- Thai Oil Group
- Tipco Asphalt Public Company Limited
- TotalEnergies SE
- Valero Energy Corporation
- Wolf Paving
- 主要产品系列
第十三章附录
- 讨论指南
- 关于许可证和定价
[192 Pages Report] The Asphalt Market size was estimated at USD 3.90 billion in 2023 and expected to reach USD 4.12 billion in 2024, at a CAGR 6.14% to reach USD 5.92 billion by 2030.
Global Asphalt Market
| KEY MARKET STATISTICS | |
|---|---|
| Base Year [2023] | USD 3.90 billion |
| Estimated Year [2024] | USD 4.12 billion |
| Forecast Year [2030] | USD 5.92 billion |
| CAGR (%) | 6.14% |
Asphalt, also known as bitumen, is a semi-solid form of petroleum that plays a crucial role in constructing and maintaining various infrastructures, particularly roads and pavements. Natural asphalt occurs when heavy crude oil deposits undergo geological processes over millions of years, forming a thick, black substance rich in hydrocarbons. On the other hand, refined asphalt is produced through the distillation process, where crude oil is heated at high temperatures, separating the lighter components, such as gasoline and diesel, from heavier ones. The global asphalt market encompasses the production, distribution, and application of diverse bituminous materials for various industries. Asphalt is primarily used in road construction, including highways, bridges, airports, and urban roads. Additionally, it serves other purposes, such as roofing and waterproofing solutions, insulation systems, and recreational surfaces, including sports courts. Growth of the asphalt market is primarily driven by increasing demand for enhanced transportation infrastructure worldwide, particularly in developing economies. Rapid urbanization, industrialization, and construction activities in residential and commercial sectors further contribute to this demand. Government investments in infrastructure projects and private-sector initiatives also offer lucrative opportunities for market expansion. However, fluctuations in crude oil prices directly impact the cost of production of asphalt materials. Additionally, environmental concerns related to greenhouse gas (GHG) emissions during asphalt production processes have led to increased regulatory scrutiny that further constraints industry growth. Moreover, technological advancements associated with eco-friendly alternatives or improved waste disposal methods are expected to reduce environmental impacts while maintaining high-performance standards required within various end-use industries.
Regional Insights
In the Americas, the United States accounts for a substantial share of the asphalt market due to its extensive road network and recurrent need for maintenance and repair. Additionally, South America's developing economies, including Brazil and Mexico, have been investing heavily in transportation infrastructure projects to support their growing populations and industries. The EMEA region also holds considerable potential for growth in the asphalt market owing to increased investment in sustainable infrastructure development. In particular, Europe has witnessed a shift toward environmentally friendly construction practices that promote recycling and usage of reclaimed asphalt pavements (RAP) as well as warm-mix asphalt (WMA). This trend aligns with European Union regulations focused on reducing greenhouse gas emissions from construction activities. Furthermore, countries in the Middle East are investing significantly in mega-infrastructure projects aimed at enhancing connectivity within their cities while simultaneously diversifying their economies. The APAC region has been witnessing rapid urbanization and industrialization that have fueled a booming asphalt market. China and India, the two most populous nations, are making heavy investments to develop transportation infrastructure in the country, such as highways, airports, bridges, and ports, to accommodate their expanding populations and industries. In addition, countries such as Indonesia and Vietnam are experiencing substantial economic growth, which has led to increased demand for improved transportation networks. As a result, the APAC region is projected to experience the highest growth rate in the global asphalt market over the next few years.
FPNV Positioning Matrix
The FPNV Positioning Matrix is pivotal in evaluating the Asphalt Market. It offers a comprehensive assessment of vendors, examining key metrics related to Business Strategy and Product Satisfaction. This in-depth analysis empowers users to make well-informed decisions aligned with their requirements. Based on the evaluation, the vendors are then categorized into four distinct quadrants representing varying levels of success: Forefront (F), Pathfinder (P), Niche (N), or Vital (V).
Market Share Analysis
The Market Share Analysis is a comprehensive tool that provides an insightful and in-depth examination of the current state of vendors in the Asphalt Market. By meticulously comparing and analyzing vendor contributions in terms of overall revenue, customer base, and other key metrics, we can offer companies a greater understanding of their performance and the challenges they face when competing for market share. Additionally, this analysis provides valuable insights into the competitive nature of the sector, including factors such as accumulation, fragmentation dominance, and amalgamation traits observed over the base year period studied. With this expanded level of detail, vendors can make more informed decisions and devise effective strategies to gain a competitive edge in the market.
Key Company Profiles
The report delves into recent significant developments in the Asphalt Market, highlighting leading vendors and their innovative profiles. These include Alltech Group, Boral Limited, BP PLC, Cement Roadstone Holdings PLC, CEPSA Comercial Petroleo, S.A., Chevron Corporation, Ergon, Inc., Exxon Mobil Corporation, Grupa LOTOS, HollyFrontier Corporation, Indian Oil Corporation Ltd., Lukoil, Marathon Petroleum Corporation, NuStar Energy L.P., OMV AG, PT Pertamina International EP, Puma Energy, Repsol S.A., Royal Dutch Shell PLC, Sasol Germany GmbH, SK Energy Co., Ltd., Sonatrach Petroleum Corporation, Thai Oil Group, Tipco Asphalt Public Company Limited, TotalEnergies SE, Valero Energy Corporation, and Wolf Paving.
Market Segmentation & Coverage
This research report categorizes the Asphalt Market to forecast the revenues and analyze trends in each of the following sub-markets:
- Manufacturing Method
- Cold Mix Asphalt
- Hot Mix Asphalt
- Application
- Coating
- Paving Roadways
- Water Roofing
- Region
- Americas
- Argentina
- Brazil
- Canada
- Mexico
- United States
- California
- Florida
- Illinois
- New York
- Ohio
- Pennsylvania
- Texas
- Asia-Pacific
- Australia
- China
- India
- Indonesia
- Japan
- Malaysia
- Philippines
- Singapore
- South Korea
- Taiwan
- Thailand
- Vietnam
- Europe, Middle East & Africa
- Denmark
- Egypt
- Finland
- France
- Germany
- Israel
- Italy
- Netherlands
- Nigeria
- Norway
- Poland
- Qatar
- Russia
- Saudi Arabia
- South Africa
- Spain
- Sweden
- Switzerland
- Turkey
- United Arab Emirates
- United Kingdom
- Americas
The report offers valuable insights on the following aspects:
1. Market Penetration: It presents comprehensive information on the market provided by key players.
2. Market Development: It delves deep into lucrative emerging markets and analyzes the penetration across mature market segments.
3. Market Diversification: It provides detailed information on new product launches, untapped geographic regions, recent developments, and investments.
4. Competitive Assessment & Intelligence: It conducts an exhaustive assessment of market shares, strategies, products, certifications, regulatory approvals, patent landscape, and manufacturing capabilities of the leading players.
5. Product Development & Innovation: It offers intelligent insights on future technologies, R&D activities, and breakthrough product developments.
The report addresses key questions such as:
1. What is the market size and forecast of the Asphalt Market?
2. Which products, segments, applications, and areas should one consider investing in over the forecast period in the Asphalt Market?
3. What are the technology trends and regulatory frameworks in the Asphalt Market?
4. What is the market share of the leading vendors in the Asphalt Market?
5. Which modes and strategic moves are suitable for entering the Asphalt Market?
Table of Contents
1. Preface
- 1.1. Objectives of the Study
- 1.2. Market Segmentation & Coverage
- 1.3. Years Considered for the Study
- 1.4. Currency & Pricing
- 1.5. Language
- 1.6. Limitations
- 1.7. Assumptions
- 1.8. Stakeholders
2. Research Methodology
- 2.1. Define: Research Objective
- 2.2. Determine: Research Design
- 2.3. Prepare: Research Instrument
- 2.4. Collect: Data Source
- 2.5. Analyze: Data Interpretation
- 2.6. Formulate: Data Verification
- 2.7. Publish: Research Report
- 2.8. Repeat: Report Update
3. Executive Summary
4. Market Overview
- 4.1. Introduction
- 4.2. Asphalt Market, by Region
5. Market Insights
- 5.1. Market Dynamics
- 5.1.1. Drivers
- 5.1.1.1. Increasing investments in the construction and manufacturing industry
- 5.1.1.2. Emphasis on maintenance of canal and reservoir linings, dam facings, and harbor & sea works
- 5.1.1.3. Environmental consciousness and development of bio-asphalts
- 5.1.2. Restraints
- 5.1.2.1. Performance limitations of asphalts at extreme temperatures and fluctuating prices of petroleum products
- 5.1.3. Opportunities
- 5.1.3.1. Technological advancements to produce high-performing asphalt
- 5.1.3.2. Growing investments in asphalt production facilities
- 5.1.4. Challenges
- 5.1.4.1. Environmental concerns associated with the manufacturing and recycling of asphalt
- 5.1.1. Drivers
- 5.2. Market Segmentation Analysis
- 5.2.1. Manufacturing Method: Growing infrastructural development and need for an excellent choice for surface treatments in maintenance projects.
- 5.2.2. Application: Significant applications are tailored to meet specific needs and requirements
- 5.3. Market Trend Analysis
- 5.4. Cumulative Impact of High Inflation
- 5.5. Porter's Five Forces Analysis
- 5.5.1. Threat of New Entrants
- 5.5.2. Threat of Substitutes
- 5.5.3. Bargaining Power of Customers
- 5.5.4. Bargaining Power of Suppliers
- 5.5.5. Industry Rivalry
- 5.6. Value Chain & Critical Path Analysis
- 5.7. Regulatory Framework
6. Asphalt Market, by Manufacturing Method
- 6.1. Introduction
- 6.2. Cold Mix Asphalt
- 6.3. Hot Mix Asphalt
7. Asphalt Market, by Application
- 7.1. Introduction
- 7.2. Coating
- 7.3. Paving Roadways
- 7.4. Water Roofing
8. Americas Asphalt Market
- 8.1. Introduction
- 8.2. Argentina
- 8.3. Brazil
- 8.4. Canada
- 8.5. Mexico
- 8.6. United States
9. Asia-Pacific Asphalt Market
- 9.1. Introduction
- 9.2. Australia
- 9.3. China
- 9.4. India
- 9.5. Indonesia
- 9.6. Japan
- 9.7. Malaysia
- 9.8. Philippines
- 9.9. Singapore
- 9.10. South Korea
- 9.11. Taiwan
- 9.12. Thailand
- 9.13. Vietnam
10. Europe, Middle East & Africa Asphalt Market
- 10.1. Introduction
- 10.2. Denmark
- 10.3. Egypt
- 10.4. Finland
- 10.5. France
- 10.6. Germany
- 10.7. Israel
- 10.8. Italy
- 10.9. Netherlands
- 10.10. Nigeria
- 10.11. Norway
- 10.12. Poland
- 10.13. Qatar
- 10.14. Russia
- 10.15. Saudi Arabia
- 10.16. South Africa
- 10.17. Spain
- 10.18. Sweden
- 10.19. Switzerland
- 10.20. Turkey
- 10.21. United Arab Emirates
- 10.22. United Kingdom
11. Competitive Landscape
- 11.1. FPNV Positioning Matrix
- 11.2. Market Share Analysis, By Key Player
- 11.3. Competitive Scenario Analysis, By Key Player
- 11.3.1. Merger & Acquisition
- 11.3.1.1. Saint-Gobain Acquires Asphalt Shingle Recycling Technology, Advancing Its Commitment to Waste Reduction
- 11.3.2. New Product Launch & Enhancement
- 11.3.2.1. NAPA and XBE Launch AI Powered Tool For Asphalt Professionals
- 11.3.2.2. CEMEX Launch Rubbermix Asphalt
- 11.3.1. Merger & Acquisition
12. Competitive Portfolio
- 12.1. Key Company Profiles
- 12.1.1. Alltech Group
- 12.1.2. Boral Limited
- 12.1.3. BP PLC
- 12.1.4. Cement Roadstone Holdings PLC
- 12.1.5. CEPSA Comercial Petroleo, S.A.
- 12.1.6. Chevron Corporation
- 12.1.7. Ergon, Inc.
- 12.1.8. Exxon Mobil Corporation
- 12.1.9. Grupa LOTOS
- 12.1.10. HollyFrontier Corporation
- 12.1.11. Indian Oil Corporation Ltd.
- 12.1.12. Lukoil
- 12.1.13. Marathon Petroleum Corporation
- 12.1.14. NuStar Energy L.P.
- 12.1.15. OMV AG
- 12.1.16. PT Pertamina International EP
- 12.1.17. Puma Energy
- 12.1.18. Repsol S.A.
- 12.1.19. Royal Dutch Shell PLC
- 12.1.20. Sasol Germany GmbH
- 12.1.21. SK Energy Co., Ltd.
- 12.1.22. Sonatrach Petroleum Corporation
- 12.1.23. Thai Oil Group
- 12.1.24. Tipco Asphalt Public Company Limited
- 12.1.25. TotalEnergies SE
- 12.1.26. Valero Energy Corporation
- 12.1.27. Wolf Paving
- 12.2. Key Product Portfolio
13. Appendix
- 13.1. Discussion Guide
- 13.2. License & Pricing
LIST OF FIGURES
- FIGURE 1. ASPHALT MARKET RESEARCH PROCESS
- FIGURE 2. ASPHALT MARKET SIZE, 2023 VS 2030
- FIGURE 3. ASPHALT MARKET SIZE, 2018-2030 (USD MILLION)
- FIGURE 4. ASPHALT MARKET SIZE, BY REGION, 2023 VS 2030 (%)
- FIGURE 5. ASPHALT MARKET SIZE, BY REGION, 2023 VS 2024 VS 2030 (USD MILLION)
- FIGURE 6. ASPHALT MARKET DYNAMICS
- FIGURE 7. ASPHALT MARKET SIZE, BY MANUFACTURING METHOD, 2023 VS 2030 (%)
- FIGURE 8. ASPHALT MARKET SIZE, BY MANUFACTURING METHOD, 2023 VS 2024 VS 2030 (USD MILLION)
- FIGURE 9. ASPHALT MARKET SIZE, BY APPLICATION, 2023 VS 2030 (%)
- FIGURE 10. ASPHALT MARKET SIZE, BY APPLICATION, 2023 VS 2024 VS 2030 (USD MILLION)
- FIGURE 11. AMERICAS ASPHALT MARKET SIZE, BY COUNTRY, 2023 VS 2030 (%)
- FIGURE 12. AMERICAS ASPHALT MARKET SIZE, BY COUNTRY, 2023 VS 2024 VS 2030 (USD MILLION)
- FIGURE 13. UNITED STATES ASPHALT MARKET SIZE, BY STATE, 2023 VS 2030 (%)
- FIGURE 14. UNITED STATES ASPHALT MARKET SIZE, BY STATE, 2023 VS 2024 VS 2030 (USD MILLION)
- FIGURE 15. ASIA-PACIFIC ASPHALT MARKET SIZE, BY COUNTRY, 2023 VS 2030 (%)
- FIGURE 16. ASIA-PACIFIC ASPHALT MARKET SIZE, BY COUNTRY, 2023 VS 2024 VS 2030 (USD MILLION)
- FIGURE 17. EUROPE, MIDDLE EAST & AFRICA ASPHALT MARKET SIZE, BY COUNTRY, 2023 VS 2030 (%)
- FIGURE 18. EUROPE, MIDDLE EAST & AFRICA ASPHALT MARKET SIZE, BY COUNTRY, 2023 VS 2024 VS 2030 (USD MILLION)
- FIGURE 19. ASPHALT MARKET, FPNV POSITIONING MATRIX, 2023
- FIGURE 20. ASPHALT MARKET SHARE, BY KEY PLAYER, 2023
LIST OF TABLES
- TABLE 1. ASPHALT MARKET SEGMENTATION & COVERAGE
- TABLE 2. UNITED STATES DOLLAR EXCHANGE RATE, 2018-2023
- TABLE 3. ASPHALT MARKET SIZE, 2018-2030 (USD MILLION)
- TABLE 4. GLOBAL ASPHALT MARKET SIZE, BY REGION, 2018-2030 (USD MILLION)
- TABLE 5. ASPHALT MARKET SIZE, BY MANUFACTURING METHOD, 2018-2030 (USD MILLION)
- TABLE 6. ASPHALT MARKET SIZE, BY COLD MIX ASPHALT, BY REGION, 2018-2030 (USD MILLION)
- TABLE 7. ASPHALT MARKET SIZE, BY HOT MIX ASPHALT, BY REGION, 2018-2030 (USD MILLION)
- TABLE 8. ASPHALT MARKET SIZE, BY APPLICATION, 2018-2030 (USD MILLION)
- TABLE 9. ASPHALT MARKET SIZE, BY COATING, BY REGION, 2018-2030 (USD MILLION)
- TABLE 10. ASPHALT MARKET SIZE, BY PAVING ROADWAYS, BY REGION, 2018-2030 (USD MILLION)
- TABLE 11. ASPHALT MARKET SIZE, BY WATER ROOFING, BY REGION, 2018-2030 (USD MILLION)
- TABLE 12. AMERICAS ASPHALT MARKET SIZE, BY MANUFACTURING METHOD, 2018-2030 (USD MILLION)
- TABLE 13. AMERICAS ASPHALT MARKET SIZE, BY APPLICATION, 2018-2030 (USD MILLION)
- TABLE 14. AMERICAS ASPHALT MARKET SIZE, BY COUNTRY, 2018-2030 (USD MILLION)
- TABLE 15. ARGENTINA ASPHALT MARKET SIZE, BY MANUFACTURING METHOD, 2018-2030 (USD MILLION)
- TABLE 16. ARGENTINA ASPHALT MARKET SIZE, BY APPLICATION, 2018-2030 (USD MILLION)
- TABLE 17. BRAZIL ASPHALT MARKET SIZE, BY MANUFACTURING METHOD, 2018-2030 (USD MILLION)
- TABLE 18. BRAZIL ASPHALT MARKET SIZE, BY APPLICATION, 2018-2030 (USD MILLION)
- TABLE 19. CANADA ASPHALT MARKET SIZE, BY MANUFACTURING METHOD, 2018-2030 (USD MILLION)
- TABLE 20. CANADA ASPHALT MARKET SIZE, BY APPLICATION, 2018-2030 (USD MILLION)
- TABLE 21. MEXICO ASPHALT MARKET SIZE, BY MANUFACTURING METHOD, 2018-2030 (USD MILLION)
- TABLE 22. MEXICO ASPHALT MARKET SIZE, BY APPLICATION, 2018-2030 (USD MILLION)
- TABLE 23. UNITED STATES ASPHALT MARKET SIZE, BY MANUFACTURING METHOD, 2018-2030 (USD MILLION)
- TABLE 24. UNITED STATES ASPHALT MARKET SIZE, BY APPLICATION, 2018-2030 (USD MILLION)
- TABLE 25. UNITED STATES ASPHALT MARKET SIZE, BY STATE, 2018-2030 (USD MILLION)
- TABLE 26. ASIA-PACIFIC ASPHALT MARKET SIZE, BY MANUFACTURING METHOD, 2018-2030 (USD MILLION)
- TABLE 27. ASIA-PACIFIC ASPHALT MARKET SIZE, BY APPLICATION, 2018-2030 (USD MILLION)
- TABLE 28. ASIA-PACIFIC ASPHALT MARKET SIZE, BY COUNTRY, 2018-2030 (USD MILLION)
- TABLE 29. AUSTRALIA ASPHALT MARKET SIZE, BY MANUFACTURING METHOD, 2018-2030 (USD MILLION)
- TABLE 30. AUSTRALIA ASPHALT MARKET SIZE, BY APPLICATION, 2018-2030 (USD MILLION)
- TABLE 31. CHINA ASPHALT MARKET SIZE, BY MANUFACTURING METHOD, 2018-2030 (USD MILLION)
- TABLE 32. CHINA ASPHALT MARKET SIZE, BY APPLICATION, 2018-2030 (USD MILLION)
- TABLE 33. INDIA ASPHALT MARKET SIZE, BY MANUFACTURING METHOD, 2018-2030 (USD MILLION)
- TABLE 34. INDIA ASPHALT MARKET SIZE, BY APPLICATION, 2018-2030 (USD MILLION)
- TABLE 35. INDONESIA ASPHALT MARKET SIZE, BY MANUFACTURING METHOD, 2018-2030 (USD MILLION)
- TABLE 36. INDONESIA ASPHALT MARKET SIZE, BY APPLICATION, 2018-2030 (USD MILLION)
- TABLE 37. JAPAN ASPHALT MARKET SIZE, BY MANUFACTURING METHOD, 2018-2030 (USD MILLION)
- TABLE 38. JAPAN ASPHALT MARKET SIZE, BY APPLICATION, 2018-2030 (USD MILLION)
- TABLE 39. MALAYSIA ASPHALT MARKET SIZE, BY MANUFACTURING METHOD, 2018-2030 (USD MILLION)
- TABLE 40. MALAYSIA ASPHALT MARKET SIZE, BY APPLICATION, 2018-2030 (USD MILLION)
- TABLE 41. PHILIPPINES ASPHALT MARKET SIZE, BY MANUFACTURING METHOD, 2018-2030 (USD MILLION)
- TABLE 42. PHILIPPINES ASPHALT MARKET SIZE, BY APPLICATION, 2018-2030 (USD MILLION)
- TABLE 43. SINGAPORE ASPHALT MARKET SIZE, BY MANUFACTURING METHOD, 2018-2030 (USD MILLION)
- TABLE 44. SINGAPORE ASPHALT MARKET SIZE, BY APPLICATION, 2018-2030 (USD MILLION)
- TABLE 45. SOUTH KOREA ASPHALT MARKET SIZE, BY MANUFACTURING METHOD, 2018-2030 (USD MILLION)
- TABLE 46. SOUTH KOREA ASPHALT MARKET SIZE, BY APPLICATION, 2018-2030 (USD MILLION)
- TABLE 47. TAIWAN ASPHALT MARKET SIZE, BY MANUFACTURING METHOD, 2018-2030 (USD MILLION)
- TABLE 48. TAIWAN ASPHALT MARKET SIZE, BY APPLICATION, 2018-2030 (USD MILLION)
- TABLE 49. THAILAND ASPHALT MARKET SIZE, BY MANUFACTURING METHOD, 2018-2030 (USD MILLION)
- TABLE 50. THAILAND ASPHALT MARKET SIZE, BY APPLICATION, 2018-2030 (USD MILLION)
- TABLE 51. VIETNAM ASPHALT MARKET SIZE, BY MANUFACTURING METHOD, 2018-2030 (USD MILLION)
- TABLE 52. VIETNAM ASPHALT MARKET SIZE, BY APPLICATION, 2018-2030 (USD MILLION)
- TABLE 53. EUROPE, MIDDLE EAST & AFRICA ASPHALT MARKET SIZE, BY MANUFACTURING METHOD, 2018-2030 (USD MILLION)
- TABLE 54. EUROPE, MIDDLE EAST & AFRICA ASPHALT MARKET SIZE, BY APPLICATION, 2018-2030 (USD MILLION)
- TABLE 55. EUROPE, MIDDLE EAST & AFRICA ASPHALT MARKET SIZE, BY COUNTRY, 2018-2030 (USD MILLION)
- TABLE 56. DENMARK ASPHALT MARKET SIZE, BY MANUFACTURING METHOD, 2018-2030 (USD MILLION)
- TABLE 57. DENMARK ASPHALT MARKET SIZE, BY APPLICATION, 2018-2030 (USD MILLION)
- TABLE 58. EGYPT ASPHALT MARKET SIZE, BY MANUFACTURING METHOD, 2018-2030 (USD MILLION)
- TABLE 59. EGYPT ASPHALT MARKET SIZE, BY APPLICATION, 2018-2030 (USD MILLION)
- TABLE 60. FINLAND ASPHALT MARKET SIZE, BY MANUFACTURING METHOD, 2018-2030 (USD MILLION)
- TABLE 61. FINLAND ASPHALT MARKET SIZE, BY APPLICATION, 2018-2030 (USD MILLION)
- TABLE 62. FRANCE ASPHALT MARKET SIZE, BY MANUFACTURING METHOD, 2018-2030 (USD MILLION)
- TABLE 63. FRANCE ASPHALT MARKET SIZE, BY APPLICATION, 2018-2030 (USD MILLION)
- TABLE 64. GERMANY ASPHALT MARKET SIZE, BY MANUFACTURING METHOD, 2018-2030 (USD MILLION)
- TABLE 65. GERMANY ASPHALT MARKET SIZE, BY APPLICATION, 2018-2030 (USD MILLION)
- TABLE 66. ISRAEL ASPHALT MARKET SIZE, BY MANUFACTURING METHOD, 2018-2030 (USD MILLION)
- TABLE 67. ISRAEL ASPHALT MARKET SIZE, BY APPLICATION, 2018-2030 (USD MILLION)
- TABLE 68. ITALY ASPHALT MARKET SIZE, BY MANUFACTURING METHOD, 2018-2030 (USD MILLION)
- TABLE 69. ITALY ASPHALT MARKET SIZE, BY APPLICATION, 2018-2030 (USD MILLION)
- TABLE 70. NETHERLANDS ASPHALT MARKET SIZE, BY MANUFACTURING METHOD, 2018-2030 (USD MILLION)
- TABLE 71. NETHERLANDS ASPHALT MARKET SIZE, BY APPLICATION, 2018-2030 (USD MILLION)
- TABLE 72. NIGERIA ASPHALT MARKET SIZE, BY MANUFACTURING METHOD, 2018-2030 (USD MILLION)
- TABLE 73. NIGERIA ASPHALT MARKET SIZE, BY APPLICATION, 2018-2030 (USD MILLION)
- TABLE 74. NORWAY ASPHALT MARKET SIZE, BY MANUFACTURING METHOD, 2018-2030 (USD MILLION)
- TABLE 75. NORWAY ASPHALT MARKET SIZE, BY APPLICATION, 2018-2030 (USD MILLION)
- TABLE 76. POLAND ASPHALT MARKET SIZE, BY MANUFACTURING METHOD, 2018-2030 (USD MILLION)
- TABLE 77. POLAND ASPHALT MARKET SIZE, BY APPLICATION, 2018-2030 (USD MILLION)
- TABLE 78. QATAR ASPHALT MARKET SIZE, BY MANUFACTURING METHOD, 2018-2030 (USD MILLION)
- TABLE 79. QATAR ASPHALT MARKET SIZE, BY APPLICATION, 2018-2030 (USD MILLION)
- TABLE 80. RUSSIA ASPHALT MARKET SIZE, BY MANUFACTURING METHOD, 2018-2030 (USD MILLION)
- TABLE 81. RUSSIA ASPHALT MARKET SIZE, BY APPLICATION, 2018-2030 (USD MILLION)
- TABLE 82. SAUDI ARABIA ASPHALT MARKET SIZE, BY MANUFACTURING METHOD, 2018-2030 (USD MILLION)
- TABLE 83. SAUDI ARABIA ASPHALT MARKET SIZE, BY APPLICATION, 2018-2030 (USD MILLION)
- TABLE 84. SOUTH AFRICA ASPHALT MARKET SIZE, BY MANUFACTURING METHOD, 2018-2030 (USD MILLION)
- TABLE 85. SOUTH AFRICA ASPHALT MARKET SIZE, BY APPLICATION, 2018-2030 (USD MILLION)
- TABLE 86. SPAIN ASPHALT MARKET SIZE, BY MANUFACTURING METHOD, 2018-2030 (USD MILLION)
- TABLE 87. SPAIN ASPHALT MARKET SIZE, BY APPLICATION, 2018-2030 (USD MILLION)
- TABLE 88. SWEDEN ASPHALT MARKET SIZE, BY MANUFACTURING METHOD, 2018-2030 (USD MILLION)
- TABLE 89. SWEDEN ASPHALT MARKET SIZE, BY APPLICATION, 2018-2030 (USD MILLION)
- TABLE 90. SWITZERLAND ASPHALT MARKET SIZE, BY MANUFACTURING METHOD, 2018-2030 (USD MILLION)
- TABLE 91. SWITZERLAND ASPHALT MARKET SIZE, BY APPLICATION, 2018-2030 (USD MILLION)
- TABLE 92. TURKEY ASPHALT MARKET SIZE, BY MANUFACTURING METHOD, 2018-2030 (USD MILLION)
- TABLE 93. TURKEY ASPHALT MARKET SIZE, BY APPLICATION, 2018-2030 (USD MILLION)
- TABLE 94. UNITED ARAB EMIRATES ASPHALT MARKET SIZE, BY MANUFACTURING METHOD, 2018-2030 (USD MILLION)
- TABLE 95. UNITED ARAB EMIRATES ASPHALT MARKET SIZE, BY APPLICATION, 2018-2030 (USD MILLION)
- TABLE 96. UNITED KINGDOM ASPHALT MARKET SIZE, BY MANUFACTURING METHOD, 2018-2030 (USD MILLION)
- TABLE 97. UNITED KINGDOM ASPHALT MARKET SIZE, BY APPLICATION, 2018-2030 (USD MILLION)
- TABLE 98. ASPHALT MARKET, FPNV POSITIONING MATRIX, 2023
- TABLE 99. ASPHALT MARKET SHARE, BY KEY PLAYER, 2023
- TABLE 100. ASPHALT MARKET LICENSE & PRICING
 2024-2032 年按产品、沥青类型、应用、最终用途部门和地区分類的沥青市场报告
 沥青瓦全球市场规模、份额、成长分析、按产品类型、分销管道、按应用划分 - 2023-2030 年行业预测
 沥青改质剂 - 市场占有率分析、产业趋势与统计、成长预测(2024 - 2029 年)
 沥青添加剂市场报告:2030 年趋势、预测与竞争分析
 2024 年沥青瓦世界市场报告
 沥青改质剂市场:按类型、来源、技术、销售管道、最终用户划分 - 全球预测 2024-2030
 沥青添加剂市场:按类型、技术和应用划分 - 2024-2030 年全球预测
 全球沥青瓦市场评估:按材料类型、按产品类型、按建筑类型、按应用、按地区、机会、预测(2016-2030)
 2024 年沥青添加剂全球市场报告
 2024 年沥青、润滑油和润滑脂全球市场报告