


 |
市场调查报告书
商品编码
1494936
VLEO卫星的全球市场:2024-2030年Global VLEO Satellites Market: 2024-2030 |
||||||
| 主要统计 | |
|---|---|
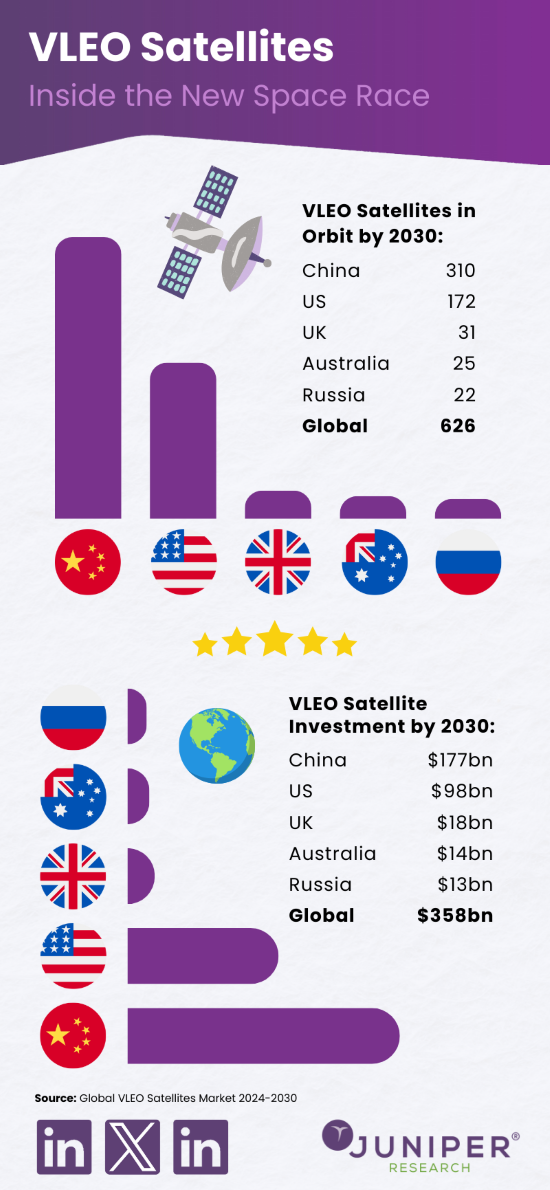
| 2030年的轨道上的VLEO卫星数: | 626 |
| 2024年的VLEO卫星发射的投资额: | 172亿美元 |
| 市场成长率 (2024~2030年): | 66% |
| 预测期间: | 2024-2030年 |
本研究包调查了全球 VLEO 卫星市场,并提供了有关主要趋势、当前用例、未来成长机会、主要挑战和对策/建议、按应用和地区划分的卫星总数趋势和预测以及主要供应商的资讯。竞争力的排行榜等。
市场资料、预测
- 轨道上的LEO卫星的总数
- 轨道上的VLEO卫星的总数:
- 公共
- 商业
- 政府机关
- 军队
- 每VLEO卫星发射1次的平均成本
- VLEO卫星发射的投资总额
样本图
市场趋势、预测 (PDF报告)

目前的市场情势综合分析,策略性的刊载建议和预测的walk-through
目录
第1章 重要点、策略性推荐事项
- VLEO卫星:重要点
- VLEO卫星:策略性推荐事项
第2章 今后的市场预测
- 简介
- VLEO卫星的开发
- VLEO卫星和LEO卫星及MEO卫星
- 今后的市场预测
- VLEO卫星的优点
- 降低轨道上碎片碰撞的风险
- 降低成本
- 低延迟
- 地球影像
- 主动系统
- 被动系统
- VLEO卫星引进的受益者和优点
- 农业
- 环境监测
- 城市计划、开发
- 灾害支援、管理
- 防卫、安全保障
- 资源管理
- 科学研究
- 收益化的机会
- 海上监视/连接
- VLEO卫星的实行
- 收益化的机会
- 机内监视、连接
- VLEO卫星的实行
- 收益化的机会
- 国际保全
- VLEO卫星的实行
- 收益化的机会
- 环境监测
- VLEO卫星的实行
- 收益化的机会
- 月额利用费
- GPS导航
- VLEO卫星的实行
- 收益化的机会
- 天体物理学的应用
- VLEO卫星的实行
- 收益化的机会
- VLEO卫星通讯及连接市场给予的影响
- IoT连接
- 5G对VLEO连接的影响
- 设备直接/电池单元直接
- VLEO卫星相关的课题
- 大气反抗
- i.环境压力
- 宇宙环境的永续性
- i.宇宙太阳能
- 卫星存取的伦理
- 大气反抗
- 法规和市场动态对VLEO卫星服务引进的影响
第3章 各国准备指数
- 各国准备指数:概要
- 重点市场
- CASIC
- CNSA (China National Space Administration)
- DARPA (Defense Advanced Research Projects Agency)
- The UK Space Agency
- LEO2VLEO
- DISCOVERER Project
- 香港
- 成长市场
- 新兴国家市场
第4章 Future Leader Index
- 读本报告的理由
- Albedo
- Blue Canyon Technologies
- Cspace Intelligent Technology
- EOI Space
- LeoLabs
- Space Forge
- Thales Alenia
- Tyvak International
- Juniper Research排行榜评估手法
- 限制与解释
第5章 市场预测、重要点
- VLEO卫星预测:简介
- 被发射的VLEO卫星的总数
- 对VLEO卫星发射的整体投资额
- 主要商业用途为目的VLEO卫星的总数
- 主要民间用途所使用的VLEO卫星的总数
- 主要政府用途所使用的VLEO卫星的总数
- 主要军事用途所使用的VLEO卫星的总数
| KEY STATISTICS | |
|---|---|
| VLEO satellites in orbit by 2030: | 626 |
| Investment into VLEO satellite launches in 2024: | $17.2bn |
| 2024 to 2030 market growth: | 66% |
| Forecast period: | 2024-2030 |
Overview
Our "VLEO (Very Low Earth Orbit) Satellites" research suite provides a detailed and insightful perspective into this upcoming lucrative space industry market; enabling stakeholders from operators, satellite network operators and technology vendors to understand its future growth opportunities in technological space capabilities (both on a country and global level), key trends, and the competitive environment in the commercial space. This space technology research assesses the current use cases providing the most immediate revenue opportunities (such as continuous coverage for telecommunications), as well as the use cases proving long-term investment opportunities, with adjacent markets such as LEO orbits also being considered. Additionally, it provides insight into the major challenges (including space environment, launch costs, atmospheric drag, sustainability and ethics) in the VLEO satellite market with bespoke recommendations on how to mitigate these challenges in the space economy.
From single satellite launches to full satellite constellations, this space economy research suite provides a thorough assessment of the VLEO satellite market and includes both a data deliverable; sizing the market, and providing key forecast data across 60 countries, as well as a Strategy & Trends document which gives a complete assessment of key trends, challenges, and recommendations for stakeholders. Collectively, the primary advantages of this data are in providing a critical tool for understanding this rapidly emerging market; supporting operators, OEMs, technology partners and satellite network operators to shape their future market strategy in space technology.
Key Features
- Market Dynamics: Insights into key trends and market expansion within the VLEO satellites market; addressing challenges posed by the highly technical nature of VLEO satellites, atmospheric conditions, and the potential use cases of increasing VLEO satellite deployment. Additionally, our VLEO satellite market research includes a regional market growth analysis on the current technological development and segment growth of VLEO satellites in 60 countries, as well as providing a future outlook.
- Key Takeaways & Strategic Recommendations: In-depth analysis of key development opportunities and findings within the VLEO satellites market; accompanied by strategic recommendations for stakeholders.
- Benchmark Industry Forecasts: Comprehensive forecast data including total number of VLEO satellite launches, split by four key use cases including commercial, civil, government, and military, as well as total and cumulative investments into VLEO satellite launches.
- Juniper Research Future Leader Index: Key player capability and capacity assessment for nine leading VLEO satellite vendors in the market space, via the Juniper Research Future Leaders Index, featuring corporate capabilities, innovation and future prospects.
- Albedo
- Blue Canyon Technologies
- Cspace Intelligent Technology
- Earth Observant (EOI Space)
- LeoLabs
- Redwire
- Space Forge
- Thales Alenia Space
- Tyvak International
Additionally, it includes a forecast summary of the total investment into VLEO satellite launches in 2030.
Market Data & Forecasts
The market-leading research suite for the VLEO satellites market includes access to the full set of forecast data of 20 tables and over 8,600 datapoints. Key metrics in the research suite include:
- Total Number of LEO (Low Earth Orbit) Satellites in Orbit
- Total Number of VLEO Satellites in Orbit, also split by:
- Civil
- Commercial
- Government Agencies
- Military
- Average Cost per VLEO Satellite Launch
- Total Investment into VLEO Satellite Launches
Juniper Research's Interactive Forecast Excel contains the following functionality:
- Statistics Analysis: Users benefit from the ability to search for specific metrics, displayed for all regions and countries across the data period. Graphs are easily modified and can be exported to the clipboard.
- Country Data Tool: This tool lets users look at metrics for all regions and countries in the forecast period. Users can refine the metrics displayed via a search bar.
- Country Comparison Tool: Users can select and compare specific countries. The ability to export graphs is included in this tool.
- What-if Analysis: Here, users can compare forecast metrics against their own assumptions, via 5 interactive scenarios.
A comprehensive analysis of the current market landscape, alongside strategic recommendations and a walk-through of the forecasts.
Table of Contents
1. Key Takeaways & Strategic Recommendations
- 1.1. VLEO Satellites: Key Takeaways
- 1.2. VLEO Satellites: Strategic Recommendations
2. Future Market Outlook
- 2.1. Introduction
- Figure 2.1: Satellite Orbits (Image not to Scale)
- 2.1.1. Development of VLEO Satellites
- 2.1.2. VLEO vs LEO and MEO Satellites
- i. LEO Satellites
- ii. MEO Satellites
- iii. VLEO Satellites
- 2.1.3. Future Market Prospects
- Figure 2.2: Total VLEO Satellite Launches, Split by 8 Key Regions, 2024-2030
- 2.2. Benefits of VLEO Satellites
- 2.2.1. Reduction in Orbital Debris Collision Risk
- 2.2.2. Lower Costs
- Figure 2.3: Van Allen Belt
- 2.2.3. Lower Latency
- Figure 2.4: M2M Use Cases and their Latency
- 2.3. Earth Imaging
- i. Active Systems
- ii. Passive Systems
- 2.3.2. Beneficiaries and Benefits of VLEO Satellite Implementation
- i. Agriculture
- ii. Environmental Monitoring
- iii. Urban Planning and Development
- iv. Disaster Response and Management
- v. Defence and Security
- vi. Resource Management
- vii. Scientific Research
- 2.3.3. Monetisation Opportunities
- 2.4. Maritime Surveillance/Connectivity
- 2.4.1. VLEO Satellite Implementation
- 2.4.2. Monetisation Opportunities
- 2.5. Inflight Surveillance & Connectivity
- 2.5.1. VLEO Satellite Implementation
- 2.5.2. Monetisation Opportunities
- 2.6. National Security
- 2.6.1. VLEO Satellite Implementation
- 2.6.2. Monetisation Opportunities
- 2.7. Environmental Monitoring
- 2.7.1. VLEO Satellite Implementation
- 2.7.2. Monetisation Opportunities
- i. Monthly Subscription Fee
- 2.8. GPS Navigation
- 2.8.1. VLEO Satellite Implementation
- 2.8.2. Monetisation Opportunities
- 2.9. Astrophysics Applications
- 2.9.1. VLEO Satellite Implementation
- 2.9.2. Monetisation Opportunities
- 2.10. Impact of VLEO Satellites on the Telecommunications and Connectivity Markets
- 2.10.1. IoT Connectivity
- Figure 2.5: Total Number of Cellular IoT Connections (m), Split by 8 Key Regions, 2024-2028
- 2.10.2. Impact of 5G on VLEO Connectivity
- Figure 2.6: Global Mobile 5G Active Connections (m), Split by 8 Key Regions, 2024-2029
- Figure 2.7: Spectrum Bands for Satellite Communications
- 2.10.3. Direct-to-Device/Direct-to-Cell
- 2.10.1. IoT Connectivity
- 2.11. Challenges Associated with VLEO Satellites
- 2.11.1. Atmospheric Drag
- i. Environmental Stress
- 2.11.2. Sustainability of the Space Environment
- i. Space-based Solar Energy
- 2.11.3. Ethics of Satellite Access
- 2.11.1. Atmospheric Drag
- 2.12. The Impact of Regulatory and Market Dynamics on the Adoption of VLEO Satellite Services
3. Country Readiness Index
- 3.1. Introduction to the Country Readiness Index
- Figure 3.1: VLEO Satellites Country Readiness Index Regional Definitions
- Table 3.2: Juniper Research Country Readiness Index Scoring Criteria: VLEO Satellites
- Figure 3.3: Juniper Research Country Readiness Index: VLEO Satellites
- Table 3.4: VLEO Satellites Country Readiness Index: Market Segmentation
- 3.2. Focus Markets
- Figure 3.5: Map Displaying VLEO Satellite Launches in 2030
- i. CASIC
- ii. CNSA (China National Space Administration)
- iii. DARPA (Defense Advanced Research Projects Agency)
- iv. The UK Space Agency
- v. LEO2VLEO
- vi. DISCOVERER Project
- vii. Hong Kong
- 3.3. Growth Markets
- Figure 3.6: Total Number of Cellular IoT Connections in Growth Markets in 2028 (m), Split by 7 Key Countries
- 3.4. Developing Markets
- Table 3.7: VLEO Satellites Country Readiness Index: North America
- Table 3.8: VLEO Satellites Country Readiness Index: Latin America
- Table 3.9: VLEO Satellites Country Readiness Index: West Europe
- Table 3.10: VLEO Satellites Country Readiness Index: Central & Eastern Europe
- Table 3.11: VLEO Satellites Country Readiness Index: Far East & China
- Table 3.12: VLEO Satellites Country Readiness Index: Indian Subcontinent
- Table 3.13: VLEO Satellites Country Readiness Index: Rest of Asia Pacific
- Table 3.14: VLEO Satellites Country Readiness Index: Africa & Middle East
4. Future Leader Index
- 4.1. Why Read this Report
- Table 4.1: Juniper Research Future Leader Index: VLEO Vendor Solutions (Part 1)
- Table 4.2: Juniper Research Future Leader Index: VLEO Vendor Solutions (Part 2)
- Figure 4.3: Juniper Research Future Leader Index: VLEO Satellites Vendors
- Table 4.4: Juniper Research VLEO Satellites Vendors Ranking
- Table 4.5: Juniper Research Future Leader Index Heatmap: VLEO Satellite Vendors
- 4.2. Albedo
- i. Corporate Information
- ii. Geographical Spread
- iii. Key Clients & Strategic Partnerships
- iv. High-level View of Offerings
- v. Juniper Research's View: Key Strengths & Strategic Opportunities
- 4.3. Blue Canyon Technologies
- i. Corporate Information
- ii. Geographical Spread
- iii. Key Clients & Strategic Partnerships
- iv. High-level View of Offerings
- v. Juniper Research's View: Key Strengths & Strategic Opportunities
- 4.4. Cspace Intelligent Technology
- i. Corporate Information
- ii. Geographical Spread
- iii. Key Clients & Strategic Partnerships
- iv. High-level View of Offerings
- v. Juniper Research's View: Key Strengths & Strategic Opportunities
- 4.5. EOI Space
- i. Corporate Information
- ii. Geographical Spread
- iii. Key Clients & Strategic Partnerships
- iv. High-level of Offerings
- v. Juniper Research's View: Key Strengths & Strategic Opportunities
- 4.6. LeoLabs
- i. Corporate Information
- ii. Geographical Spread
- iii. High-level View of Offerings
- iv. Juniper Research's View: Key Strengths & Strategic Opportunities
- 4.7. Space Forge
- i. Corporate Information
- ii. Geographical Spread
- iii. Key Clients & Strategic Partnerships
- iv. High-level View of Offerings
- v. Juniper Research's View: Key Strengths & Strategic Opportunities
- 4.8. Thales Alenia
- i. Corporate Information
- ii. Geographical Spread
- iii. Key Clients & Strategic Partnerships
- iv. High-level View of Offerings
- v. Juniper Research's View: Key Strengths & Strategic Opportunities
- 4.9. Tyvak International
- i. Corporate Information
- ii. Geographical Spread
- iii. Key Clients & Strategic Partnerships
- iv. High-level View of Offerings
- v. Juniper Research's View: Key Strengths & Strategic Opportunities
- 4.10. Redwire
- i. Corporate Information
- ii. Geographical Spread
- iii. Key Clients & Strategic Partnerships
- iv. High-level View of Offerings
- v. Juniper Research's View: Key Strengths & Strategic Opportunities
- 4.1. Juniper Research Leaderboard Assessment Methodology
- 4.2. Limitations & Interpretations
- Table 4.6: Juniper Research Future Leader Index Criteria Table: VLEO Satellites
5. Market Forecasts and Key Takeaways
- 5.1. Introduction to VLEO Satellite Forecasts
- Figure 5.1: VLEO Satellites Forecast Methodology
- 5.2. Total Number of VLEO Satellites Launched
- Figure & Table 5.2: Total Number of VLEO Satellites Launched, Split by 8 Key Regions, 2024-2030
- 5.3. Total Investment into VLEO Satellite Launches
- Figure & Table 5.3: Total Investment into VLEO Satellite Launches ($m), Split by 8 Key Regions, 2024-2030
- Table 5.4: Cumulative Total Investment into VLEO Satellite Launches ($m), Split by 8 Key Regions, 2024-2030
- 5.4. Total VLEO Satellites Primarily for Used Commercial Applications
- Figure & Table 5.5: Total Number of VLEO Satellites Primarily Used for Commercial Applications, Split by 8 Key Regions, 2024-2030
- 5.5. Total VLEO Satellites Primarily Used for Civil Applications
- Figure & Table 5.6: Total Number of VLEO Satellites Primarily Used for Civil Applications, Split by 8 Key Regions, 2024-2030
- 5.6. Total VLEO Satellites Primarily Used for Government Applications
- Figure & Table 5.7: Total Number of VLEO Satellites Primarily Used for Government Applications, Split by 8 Key Regions, 2024-2030
- 5.7. Total VLEO Satellites Primarily Used for Military Applications
- Figure & Table 5.8: Total Number of VLEO Satellites Primarily Used for Military Applications, Split by 8 Key Regions, 2024-2030
 低地球轨道卫星市场:依卫星品质、应用、轨道高度、频段及最终用途划分-全球预测至2036年
 2026-2030年全球低地球轨道卫星市场
 低地球轨道卫星市场规模、份额和成长分析(按卫星类型、应用、组件、最终用途、部署方式和地区划分)—2026-2033年产业预测
 低地球轨道卫星市场-全球产业规模、份额、趋势、机会与预测:规模、子系统、应用、频率、最终用途、区域和竞争格局,2021-2031年
 全球低地球轨道卫星市场-按应用、产品和地区分類的分析和预测(2025-2035 年)
 低地球轨道(LEO)卫星市场规模、份额和成长分析(按品质、频段、推进方式、应用、最终用途和地区划分)-2026-2033年产业预测
 低地球轨道卫星市场规模、占有率、成长及全球产业分析:依类型、应用和地区划分的洞察与预测(2024-2032 年)
 LEO设备市场按设备类型、应用、最终用户、频段和技术类型划分 - 全球预测 2025-2032全球低地球轨道卫星市场(按卫星类型、子系统、卫星尺寸、频段和最终用户划分)预测 2025-2030
 2025年低地球轨道(LEO)卫星全球市场报告