


 |
市场调查报告书
商品编码
1848179
数位ID市场:2025-2030年Digital Identity Market: 2025-2030 |
||||||
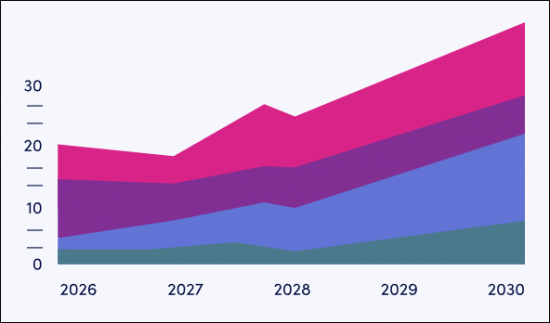
到2030年,全球数位身分市场规模将超过800亿美元:更严格的监管和混合策略推动成长
| 主要统计 | |
|---|---|
| 2025年的市场收益: | 515亿美元 |
| 2030年的市场收益: | 805亿美元 |
| 从2025年开始2030年的市场成长率 | 56% |
| 预测期间: | 2025-2030年 |
本研究报告对数位身分市场进行了全面而深入的分析,帮助包括数位身分平台提供者、数位身分验证提供者、政府机构和银行在内的利害关係人了解未来发展趋势。 成长、关键趋势和竞争格局。
本研究套件包含多个可单独购买的选项。 "市场趋势与策略" 涵盖新兴的数位身分法规及相关产业趋势。 "国家准备度指数" 提供61个不同地区目前及未来数位身分机会的国家级分析。
"数据与预测" 包含未来五年数位身分市场采用情况及成长趋势的数据,并按第三方和政府主导的数位身分应用程式、数位身分证和数位身分应用程式进行细分。
此外, "竞争格局排行榜" 对20家数位身分市场领导者进行了深入分析,根据各供应商的能力、产能及产品组合进行定位。
所有报告内容均为英文。
主要特点
- 主要结论与策略建议: 本报告深入分析了关键发展机会、主要发现以及针对服务提供者、发卡机构、认证机构和银行的关键策略建议。
- 市场展望: 本报告深入分析了数位身分市场的关键趋势和成长挑战,并确定了公共和私营部门关注的领域,包括相关应用案例。报告还分析了新兴趋势,例如教育领域的数位身分。此外,报告还提供了61个主要国家/地区数位身分市场当前发展和成长领域的国家准备度指数,并展望了未来发展前景。
- 产业基准预测: 本报告对数位卡和应用程式发行的数位身分的总市场规模和发行量进行了全面预测,并进一步细分为第三方发卡机构、政府发卡机构和基于区块链的身份。
- Juniper Research 竞争格局排行榜: 本报告评估了 20 家领先的数位身分平台供应商的能力。
样品view
市场资料·预测报告
样品报告
市场趋势与策略报告
市场数据与预测报告
本研究套件包含49个表格和超过30,000个资料点的完整预测资料集。此研究套件包含以下指标:
- 数位身分应用程式总安装量
- 数位身分总收入
- 年度数字身份验证检查总数
- 数位身分应用总收入和平均收入:
- 第三方身分应用
- 政府核发的身份应用
Juniper Research 互动式预测(Excel 版)包含以下功能:
- 统计分析:统计分析:显示资料期间所有地区和国家的统计分析,使用者可以搜寻特定指标。图表可以轻鬆修改并汇出到剪贴簿。
- 国家/地区资料工具:此工具可让您查看预测期间所有地区和国家的指标。您可以使用搜寻栏缩小查看的指标范围。
- 国家比较工具:您可以选择要比较的国家。此工具支援汇出图表。
- 假设分析:透过五个互动式场景,使用者可以比较不同的预测假设。
竞争对手排行榜报告
目标供应商为以下 20 家公司:
|
|
目录
市场趋势·策略
第1章 重要点和策略性建议
- 重要点
- 策略性建议
第2章 市场形势
- 数位ID的形态
- 中央集权型ID
- 联合型ID
- 分散式ID
- 主要趋势
- eIDAS 2.0
- 週边各国的数位ID制度
- 单一登录
- 零信任
- 自我主权型ID
- 量子支援加密
- 相关规格
第3章 市场区隔分析
- Onboarding
- 数位旅行认证
- 电子政府 (eGovernment)
- 电子签章 (eSigning)
- 医疗领域
- 医疗记录的点阅存取
- 医疗服务的点阅存取
- 健康证明书
- 教育
- 教育服务的点阅存取
- 学历·资格证明
第4章 各国准备指数
- 焦点市场
- 成长市场
- 饱和市场
- 新兴国家市场
竞争排行榜
第1章 Juniper Research的竞争排行榜
第2章 企业简介
- 业者简介
- Civic Technologies
- Digidentity
- Dock Labs
- Entrust
- IBM
- ID&Trust
- Indicio
- IN Groupe
- Midy
- OneID
- Ping Identity
- SICPA
- Signaturit Group
- TECH5
- Tessi
- Thales
- Tinexta InfoCert
- TOPPAN Security
- Veridos and G+D (Giesecke+Devrient)
- Yoti
- 评估手法
- 相关调查
资料·预测
第1章 简介与调查手法
第2章 预测摘要
- 数位ID应用程式
- 数位ID收益
- 数位ID收益 (收益各领域)
第3章 数位ID基础设施的收益
- 数位ID平台的总支出
- 数位ID卡基础设施支出
- 行政ID应用程式的收益
- 第三方ID应用程式的收益
第4章 第三方数位ID
- 第三方的数位ID应用程式
- 区块链为基础的第三方ID应用程式
第5章 行政数位ID
- 数位身分证
- 行政数位ID卡
- 行政ID应用程式
'Digital Identity Market to Exceed $80 Billion by 2030 Globally, Accelerated by Regulation & Hybrid Strategies'
| KEY STATISTICS | |
|---|---|
| Total market revenue in 2025: | $51.5bn |
| Total market revenue in 2030: | $80.5bn |
| 2025 to 2030 market growth: | 56% |
| Forecast period: | 2025-2030 |
Overview
Juniper Research's "Digital Identity" research suite provides a comprehensive and insightful analysis of this market; enabling stakeholders, including digital identity platform providers, digital identity verification providers, government agencies, banks, and many others, to understand future growth, key trends, and the competitive environment.
The research suite includes several different options that can be purchased separately. The Market Trends & Strategies element includes an insightful analysis of the key areas of development and interest within digital identity, including new digital identity regulations and sectors. Additionally, it features Juniper Research's Country Readiness Index, which provides a country-level analysis of the current and future opportunities for digital identity in 61 different geographies.
The Data & Forecasting element includes access to data mapping the adoption and future growth of the digital identity market over the next five years; split by third-party and civic digital identity apps, and by digital identity cards and digital identity apps.
Additionally, the Competitor Leaderboard document features an extensive analysis of the 20 market leaders in the digital identity space, positioning them based on capability and capacity, as well as on their product offering itself; offering a robust analysis of each vendor.
The coverage can also be purchased as a full research suite containing the Market Trends & Strategies, Data & Forecasting, and Competitor Leaderboard, and at a substantial discount.
Collectively, these documents provide a critical tool for understanding this important market. They allow digital identity issuance providers and digital identity verification companies to shape their future strategies; capitalising on future growth opportunities. The research suite's extensive coverage makes it a valuable tool for navigating this high-growth market.
All report content is delivered in the English language.
Key Features
- Key Takeaways & Strategic Recommendations: In-depth analysis of key development opportunities, key findings, and key strategic recommendations for digital identity platforms, issuers, verifiers, and banks.
- Market Outlook: Insights into key trends and market expansion challenges within the digital identity market; identifying areas of interest in both public and private sectors, including relevant use cases. Furthermore, the report includes analysis of new trends, such as digital identity in the education sector. The research also features a Country Readiness Index on the current development and segment growth of the digital identity market across 61 key countries, as well as providing a future outlook.
- Benchmark Industry Forecasts: Extensive forecasts for the total value and number of issued digital identities, across both digital cards and apps, further split by third-party issuers, civic identity issuers, and blockchain-based identities.
- Juniper Research Competitor Leaderboard: Key player capability and capacity assessment for 20 digital identity platforms, via the Juniper Research Competitor Leaderboard.
SAMPLE VIEW
Market Data & Forecasting Report
The numbers tell you what's happening, but our written report details why, alongside the methodologies.
SAMPLE VIEW
Market Trends & Strategies Report
A comprehensive analysis of the current market landscape, alongside strategic recommendations.
Market Data & Forecasting Report
The market-leading research suite for the "Digital Identity" market includes access to the full set of forecast data of 49 tables and over 30,000 datapoints. Metrics in the research suite include:
- Total Number of Digital Identity Apps Installed
- Total Digital Identity Revenue
- Total Volume of Digital Identity Verification Checks per annum
- Total and Average Platform Revenue from Digital Identity Apps, split by:
- Third-party Identity Apps
- Civic Identity Apps
Juniper Research Interactive Forecast Excel contains the following functionality:
- Statistics Analysis: Users benefit from the ability to search for specific metrics; displayed for all regions and countries across the data period. Graphs are easily modified and can be exported to the clipboard.
- Country Data Tool: This tool enables users to look at metrics for all regions and countries in the forecast period. Users can refine the metrics displayed via a search bar.
- Country Comparison Tool: Users can select and compare countries. The ability to export graphs is included in this tool.
- What-if Analysis: Here, users can compare forecast metrics against their own assumptions, via 5 interactive scenarios.
Market Trends & Strategies Report
This report examines the "Digital Identity" market landscape in detail; assessing market trends and factors shaping the evolution of this transforming market. It delivers comprehensive analysis of the strategic opportunities in the digital identity landscape; assessing ways in which the digital identity market is changing, and what this means for overall market growth. The report also examines major challenges and opportunities, as well as providing an evaluation of key country-level opportunities for digital identity growth via a Country Readiness Index. Combined, the report provides an insightful resource for key stakeholders.
Competitor Leaderboard Report
The Competitor Leaderboard report provides coverage of 20 leading digital identity vendors, positioning them as an established leader, leading challenger, or disruptors and challenger based on capacity and capability assessments.
The 20 vendors included are:
|
|
The Competitor Leaderboard gives a comprehensive guide to the competitive landscape within digital identity; providing an important resource for stakeholders.
Table of Contents
Market Trends & Strategies
1. Key Takeaways & Strategic Recommendations
- 1.1. Key Takeaways
- 1.2. Strategic Recommendations
2. Market Landscape
- 2.1. Introduction
- 2.2. Forms of Digital Identity
- 2.2.1. Centralised Identity
- 2.2.2. Federated Identity
- Figure 2.1: Federated Identity Model
- 2.2.3. Decentralised Identity
- Figure 2.2: Decentralised Identity Systems
- 2.3. Key Trends
- 2.3.1. eIDAS 2.0
- 2.3.2. Neighbouring Country Digital ID Schemes
- 2.3.3. Single Sign-On
- 2.3.4. Zero Trust
- 2.3.5. Self-Sovereign Identity
- 2.3.6. Quantum-ready Encryption
- 2.3.7. Standards
- i. ISO/IEC 18013-5
- ii. ISO/IEC 18013-7
- iii. ICAO Doc 9303
- iv. ETSI TS119 461
- v. W3C DID V1.1
- Figure 2.3: Overview of DID Architecture and the Relationship of Basic Components
3. Segment Analysis
- 3.1. Onboarding
- 3.2. Digital Travel Credentials
- 3.3. eGovernment
- Figure 3.1: eGovernment Use Cases
- 3.4. eSigning
- 3.5. Healthcare
- 3.5.1. Access to Records
- 3.5.2. Access to Services
- 3.5.3. Health Credentials
- 3.6. Education
- 3.6.1. Access to Services
- 3.6.2. Educational Credentials
4. Country Readiness Index
- 4.1. Introduction
- Figure 4.1: Juniper Research Country Readiness Index Regional Definitions
- Table 4.2: Juniper Research Country Readiness Index Scoring Criteria: Digital Identity
- Figure 4.3: Juniper Research Country Readiness Index: Digital Identity
- Table 4.4: Juniper Research Digital Identity Country Readiness Index: Market Segments
- 4.2. Focus Markets
- 4.2.1. National ID Card Digitisation
- 4.2.2. Demographic and Cultural Interest
- 4.2.3. Country-level Assessment: Argentina
- 4.3. Growth Markets
- 4.3.1. Regulatory Barriers and Opportunities
- 4.3.2. Blockchain Utilisation
- 4.3.3. Country-level Assessment: The UK
- 4.4. Saturated Markets
- 4.4.1. Mature ID Systems Require Interoperability
- 4.4.2. Country-level Assessment: The Netherlands
- 4.5. Developing Markets
- 4.5.1. Fragmented Infrastructure
- 4.5.2. Country-level Assessment: Peru
- Table 4.5: Juniper Research Country Readiness Index Heatmap: North America
- Table 4.6: Juniper Research Country Readiness Index Heatmap: Latin America Table 4.7: Juniper Research Country Readiness Index Heatmap: West Europe
- Table 4.8: Juniper Research Country Readiness Index Heatmap: Central & East Europe
- Table 4.9: Juniper Research Country Readiness Index Heatmap: Far East & China
- Table 4.10: Juniper Research Country Readiness Index Heatmap: Indian Subcontinent
- Table 4.11: Juniper Research Country Readiness Index Heatmap: Rest of Asia Pacific
- Figure 4.12: Juniper Research Country Readiness Index Heatmap: Africa & Middle East
Competitor Leaderboard
1. Juniper Research Competitor Leaderboard
- 1.1. Why Read This Report
- Table 1.1: Juniper Research Competitor Leaderboard Digital Identity Vendors Included & Product Portfolios
- Figure 1.2: Juniper Research Competitor Leaderboard: Digital Identity
- Table 1.3: Juniper Research Competitor Leaderboard Digital Identity Vendors & Positioning
- Table 1.4: Juniper Research Competitor Leaderboard Heatmap: Digital Identity Vendors (1 of 2)
- Table 1.4: Juniper Research Competitor Leaderboard Heatmap: Digital Identity Vendors (2 of 2)
2. Company Profiles
- 2.1. Vendor Profiles
- 2.1.1. Civic Technologies
- i. Corporate
- Figure 2.1: Civic's Rounds of Funding ($m), 2016-2017
- ii. Geographical Spread
- iii. Key Clients & Strategic Partnerships
- iv. High-level View of Offerings
- v. Juniper Research's View: Key Strengths & Strategic Development Opportunities
- i. Corporate
- 2.1.2. Digidentity
- i. Corporate
- ii. Geographical Spread
- iii. Key Clients & Strategic Partnerships
- iv. High-level View of Offerings
- v. Juniper Research's View: Key Strengths & Strategic Development Opportunities
- 2.1.3. Dock Labs
- i. Corporate
- ii. Geographical Spread
- iii. Key Clients & Strategic Partnerships
- iv. High-level View of Offerings
- v. Juniper Research's View: Key Strengths & Strategic Development Opportunities
- 2.1.4. Entrust
- i. Corporate
- ii. Geographical Spread
- iii. Key Clients & Strategic Partnerships
- iv. High-level View of Offerings
- v. Juniper Research's View: Key Strengths & Strategic Development Opportunities
- 2.1.5. IBM
- i. Corporate
- Table 2.2: IBM's Financial Snapshot ($m), 2022-2024
- ii. Geographical Spread
- iii. Key Clients & Strategic Partnerships
- iv. High-level View of Offerings
- v. Juniper Research's View: Key Strengths & Strategic Development Opportunities
- i. Corporate
- 2.1.6. ID&Trust
- i. Corporate
- ii. Geographical Spread
- iii. Key Clients & Strategic Partnerships
- iv. High-level View of Offerings
- v. Juniper Research's View: Key Strengths & Strategic Development Opportunities
- 2.1.7. Indicio
- i. Corporate
- ii. Geographical Spread
- iii. Key Clients & Strategic Partnerships
- iv. High-level View of Offerings
- v. Juniper Research's View: Key Strengths & Strategic Development Opportunities
- 2.1.8. IN Groupe
- i. Corporate
- ii. Geographical Spread
- iii. Key Clients & Strategic Partnerships
- iv. High-level View of Offerings
- v. Juniper Research's View: Key Strengths & Strategic Development Opportunities
- 2.1.9. Midy
- i. Corporate
- ii. Geographical Spread
- iii. Key Clients & Strategic Partnerships
- iv. High-level View of Offerings
- v. Juniper Research's View: Key Strengths & Strategic Development Opportunities
- 2.1.10. OneID
- i. Corporate
- ii. Geographical Spread
- iii. Key Clients & Strategic Partnerships
- iv. High-level View of Offerings
- v. Juniper Research's View: Key Strengths & Strategic Development Opportunities
- 2.1.11. Ping Identity
- i. Corporate
- ii. Geographical Spread
- iii. Key Clients & Strategic Partnerships
- iv. High-level View of Offerings
- v. Juniper Research's View: Key Strengths & Strategic Development Opportunities
- 2.1.12. SICPA
- i. Corporate
- ii. Geographical Spread
- iii. Key Clients & Strategic Partnerships
- iv. High-level View of Offerings
- v. Juniper Research's View: Key Strengths & Strategic Development Opportunities
- 2.1.13. Signaturit Group
- i. Corporate
- ii. Geographical Spread
- iii. Key clients & Strategic Partnerships
- iv. High-level View of Offerings
- v. Juniper Research's View: Key Strengths & Strategic Development Opportunities
- 2.1.14. TECH5
- i. Corporate
- Figure 2.3: TECH5's Rounds of Funding ($m), 2021-2022
- ii. Geographical Spread
- iii. Key Clients & Strategic Partnerships
- iv. High-level View of Offerings
- v. Juniper Research's View: Key Strengths & Strategic Development Opportunities
- i. Corporate
- 2.1.15. Tessi
- i. Corporate
- ii. Geographical Spread
- iii. Key Clients & Strategic Partnerships
- iv. High-level View of Offerings
- v. Juniper Research's View: Key Strengths & Strategic Development Opportunities
- 2.1.16. Thales
- i. Corporate
- ii. Geographical Spread
- iii. Key Clients & Strategic Partnerships
- iv. High-level View of Offerings
- v. Juniper Research's View: Key Strengths & Strategic Development Opportunities
- 2.1.17. Tinexta InfoCert
- i. Corporate
- ii. Geographical Spread
- iii. Key Clients & Strategic Partnerships
- iv. High-level View of Offerings
- v. Juniper Research's View: Key Strengths & Strategic Development Opportunities
- 2.1.18. TOPPAN Security
- i. Corporate
- ii. Geographical Spread
- iii. Key Clients & Strategic Partnerships
- iv. High-level View of Offerings
- v. Juniper Research's View: Key Strengths & Strategic Development Opportunities
- 2.1.19. Veridos and G+D (Giesecke+Devrient)
- i. Corporate
- Table 2.4: G+D's Financial Snapshot ($m), 2022-2024
- ii. Geographical Spread
- iii. Key Clients & Strategic Partnerships
- iv. High-level View of Offerings
- Figure 2.5: Verigo Mobile TravelAssist
- v. Juniper Research's View: Key Strengths & Strategic Development Opportunities
- i. Corporate
- 2.1.20. Yoti
- i. Corporate
- ii. Geographical Spread
- iii. Key Clients & Strategic Partnerships
- iv. High-level View of Offerings
- v. Juniper Research's View: Key Strengths & Strategic Development Opportunities
- 2.1.1. Civic Technologies
- 2.2. Juniper Research Competitor Leaderboard Assessment Methodology
- 2.2.1. Limitations & Interpretations
- Table 2.6: Juniper Research Competitor Leaderboard Scoring Criteria - Digital Identity
- 2.2.1. Limitations & Interpretations
- 2.3. Related Research
Data & Forecasting
1. Introduction & Methodology
- 1.1. Introduction
- 1.2. Methodology & Assumptions
- Figure 1.1: Digital Identity Apps Forecast Methodology
- Figure 1.2: Civic Digital Identity Forecast Methodology
- Figure 1.3: MSISDN-based Mobile ID Forecast Methodology
- Figure 1.4: Digital Identity Revenue Forecast Methodology
2. Forecast Summary
- 2.1. Digital Identity Apps
- Figure & Table 2.1: Number of Digital Identity Apps Installed (m), Split by 8 Key Regions, 2025-2030
- 2.2. Digital Identity Revenue
- Figure & Table 2.2: Total Digital Identity Revenue per annum ($m), Split by 8 Key Regions, 2025-2030
- 2.3. Digital Identity Revenue, by Revenue Area
- Figure & Table 2.3: Total Digital Identity Revenue per annum ($m), Split by Revenue Area, 2025-2030
- Table 2.4: Total Digital Identity Revenue per annum (%), Split by Revenue Area, 2025-2030
3. Digital Identity Infrastructure Revenue
- 3.1. Total Digital Identity Platform Spend
- Figure & Table 3.1: Total Digital Identity Platform Spend per annum ($m), Split by 8 Key Regions, 2025-2030
- 3.2. Digital Identity Card Infrastructure Spend
- Figure & Table 3.2: Total Digital Identity Card Infrastructure Spend per annum ($m), Split by 8 Key Regions, 2025-2030
- 3.3. Civic Identity App Revenue
- Figure & Table 3.3: Total Platform Revenue from Civic Identity Apps per annum ($m), Split by 8 Key Regions, 2025-2030
- 3.4. Third-party Identity App Revenue
- Figure & Table 3.4: Total Platform Revenue from Third-party Identity Apps per annum ($m), Split by 8 Key Regions, 2025-2030
4. Third-party Digital Identity
- 4.1. Third-party Digital Identity Apps
- Figure & Table 4.1: Number of Third-party Digital ID Apps Installed per annum (m), Split by 8 Key Regions, 2025-2030
- 4.2. Blockchain-based Third-party Identity Apps
- Figure & Table 4.2: Number of Blockchain-based Third-party Digital ID Apps Installed per annum (m), Split by 8 Key Regions, 2025-2030
5. Civic Digital Identity
- 5.1. Digital Identity Documents
- Figure & Table 5.1: Number of People with Digital Identity Documents (m), Split by 8 Key Regions, 2025-2030
- 5.2. Civil Digital Identity Cards
- Figure & Table 5.2: Number of People with Digital Identity Cards (m), Split by 8 Key Regions, 2025-2030
- 5.3. Civil Identity Apps
- Figure & Table 5.3: Number of People with Digital Identity Documents That Have Civil Identity Apps (m), Split by 8 Key Regions, 2025-2030
 2026年量子安全身分整合全球市场报告2026年全球数位身分验证市场报告2026年全球数位认证管理软体市场报告2026年全球数位身分市场报告2026年全球地址验证软体市场报告
 医疗保健领域数位身分市场—全球产业规模、份额、趋势、机会和预测:病患身分、药房和製药、医疗服务提供者身分、区域和竞争格局,2021-2031年教育数位身分市场 - 全球产业规模、份额、趋势、机会、预测:产品、解决方案类型、身分类型、区域及竞争格局(2021-2031年)数位认证管理软体市场-全球产业规模、份额、趋势、机会、预测:按组件、类型、应用、地区和竞争格局划分,2021-2031年数位身分市场-全球产业规模、份额、趋势、机会和预测:按身分类型、组织规模、产业垂直领域、地区和竞争格局划分,2021-2031年金融、保险和银行业数位身分市场-全球产业规模、份额、趋势、机会和预测:产品、部署方式、身分类型、组织规模、区域和竞争格局(2021-2031)