


 |
市场调查报告书
商品编码
1581327
CBDC (中央银行数位货币) 及稳定币的全球市场:2024-2031年Global CBDCs & Stablecoins Market: 2024-2031 |
||||||
"CBDC (中央银行数位货币) 的交易数2031年预计达到78亿"
| 主要统计 | |
|---|---|
| 2024年的交易额 | 2,252亿美元 |
| 2031年的交易额 | 1兆6,000亿美元 |
| 从2024年开始2031年的市场成长率 | 612% |
| 预测期间 | 2024-2031年 |
我们的研究套件对不断发展的 CBDC(中央银行数位货币)和稳定币市场提供了深入而深刻的分析。利害关係人,包括中央银行、商业银行、稳定币发行者和支付服务供应商,可以了解未来的成长、主要趋势和竞争格局。这包括对 CBDC 开发的潜在设计选项以及世界各地数位货币监管框架的现状的分析。它还讨论了批发 CBDC 如何加强货币主权,以及零售 CBDC 如何增加金融包容性并促进无银行帐户者更多地参与数位金融。
该套件包含几个可单独购买的选项,包括存取映射 CBDC 和稳定币交易未来成长的数据,以及揭示金融市场最新趋势和机会的深刻研究。它还包括对 CBDC 领域 14 位市场领导者的广泛分析。
主要特点
- 市场动态:包括 CBDC 和稳定币采用的推动因素和障碍、对市场扩张的主要趋势和课题的见解、跨境支付面临的交易成本课题、在构建 CBDC 时建立互通性的重要性,以及 CBDC 和稳定币在金融市场中的互动。它还针对八个主要地区的当前发展和成长领域提供了针对特定国家的准备指标,以着眼于未来。
- 关键要点和策略建议:深入分析 CBDC 和稳定币市场中的关键发展机会和见解,并为利害关係人提供策略建议。
- 基准产业预测:CBDC 和稳定币资料集包括市场规模预测,包括使用这些支付方式的预期节省总额以及各个细分市场的交易数量。
- Juniper Research 竞赛排行榜:确定 CBDC 开发行业主要参与者的市场规模,并评估 14 家领先的 CBDC 供应商的能力。
样品view
市场资料·预测报告:
市场趋势·策略报告:
市场数据及预测报告
研究套件包括一整套 95 个表格和预测,包含 45,600 个数据点。该调查套件包括以下指标:
- CBDC 市场的交易总数、交易总价值和总储蓄
- 稳定币市场的交易总数、交易总价值和总储蓄
- 按 CBDC 和稳定币细分市场划分的总交易量和交易金额:
- 国内消费者交易
- 国内 B2B 交易
- 跨国消费者交易
- 跨国 B2B 交易
Juniper Research Interactive Forecast Excel 提供以下功能:
- 统计分析:您可以搜寻资料期间内所有地区和国家显示的特定指标。图表可以轻鬆修改并汇出到剪贴簿。
- 国家资料工具:此工具可让您查看预测期间内所有地区和国家的指标。您可以使用搜寻栏缩小显示的指标范围。
- 国家比较工具:您可以选择特定的国家进行比较。该工具具有汇出图表的功能。
- 假设分析:五种互动式场景让使用者可以比较预测假设。
目录
市场趋势·策略
第1章 重要点·策略性推荐事项
- 重要点
- 策略性推荐事项
第2章 市场形势
- CBDC及稳定币的历史
- 主要趋势与推动因素
- 稳定币的使用将对金融格局产生重大颠覆性影响
- 监管在引导数位货币方面的作用
- 新兴经济体将从 rCBDC 的发展中获益最多
- 隐私保护需要先进的加密方法
- 智能合约如何改变经济?
第3章 市场区隔分析
- 零售CBDC
- 批发CBDC
- 稳定币
- 稳定币和CBDC的相互作用
第4章 各国准备指数
- 各国准备指数:简介
- 关注的市场
- 成长市场
- 饱和市场
- 新兴国家市场
竞争的排行榜
第1章 Juniper Research的竞争排行榜
- 读该报告的理由
- CBDC业者简介
- Accenture
- Bitt
- Consensys
- eCurrency
- EMTECH
- FIS
- Giesecke + Devrient
- IDEMIA
- Mastercard
- Nahmii
- R3
- Ripple
- Soramitsu
- Stellar
资料·预测
第1章 市场概要
- 调查手法·前提
第2章 预测概要
- CBDC及稳定币的整体交易数
- 稳定币和CBDC的整体交易额
- CBDC及稳定币的整体储蓄额
第3章 CBDC:市场预测
- CBDC整体交易数:主要8大地区
- CBDC整体交易数:市场部门别
- CBDC整体交易额:主要8大地区
- CBDC整体交易额:市场部门别
- 由于CBDC的潜在的整体储蓄额:主要8大地区
- 由于CBDC的潜在的整体储蓄额:市场部门别
第4章 稳定币:市场预测
- 稳定币整体交易数:主要8大地区
- 稳定币整体交易数:市场部门别
- 稳定币整体交易额:主要8大地区
- 稳定币整体交易额:市场部门别
- 由于稳定币的潜在的整体储蓄额:主要8大地区
- 由于稳定币的潜在的整体储蓄额:市场部门别
'CBDC Transaction Volume to Reach 7.8 Billion by 2031'
| KEY STATISTICS | |
|---|---|
| Transaction value in 2024: | $225.2bn |
| Transaction value in 2031: | $1.6tn |
| 2024 to 2031 market growth: | 612% |
| Forecast period: | 2024-2031 |
Overview
Our CBDCs (Central Bank Digital Currency) & Stablecoin research suite provides a detailed and insightful analysis of this evolving market; enabling stakeholders such as central banks, commercial banks, stablecoin issuers and payment service providers to understand future growth, key trends and the competitive environment. This includes an analysis of possible design choices in the development of CBDCs and the current state of digital currency regulatory frameworks around the globe. The report also discusses how wholesale CBDCs can strengthen monetary sovereignty and how retail CBDCs can increase financial inclusion and facilitate participation in digital finance among unbanked populations.
The suite includes several different options that can be purchased separately, including access to data mapping the future growth of CBDC & stablecoin transactions; an insightful study uncovering the latest trends and opportunities within the financial markets. It also includes a document containing extensive analysis of the 14 market leaders in the CBDC space. The coverage can also be purchased as a Full Research Suite, containing all of these elements, at a substantial discount.
Collectively, they provide a critical tool for understanding this rapidly emerging market; allowing stakeholders in the CBDC and stablecoins market to shape their future strategy. Its unparalleled coverage makes this research suite an incredibly useful resource for charting the future of such an uncertain and fast-growing market.
Key Features
- Market Dynamics: Insights into key trends and market expansion challenges within the CBDC & stablecoin market, including drivers and barriers for CBDC and stablecoin adoption. The report addresses the challenges that the cross-border payments sector faces regarding transaction costs; how incorporating interoperability is key when building CBDCs; and the interplay between CBDCs and stablecoins in financial markets. The research also features a Country Readiness Index on the current development and segment growth of the CBDC & stablecoins market across 8 key regions, as well as providing a future outlook.
- Key Takeaways & Strategic Recommendations: In-depth analysis of key development opportunities and findings within the CBDC & stablecoins market, accompanied by strategic recommendations for stakeholders.
- Benchmark Industry Forecasts: The CBDC & stablecoins dataset includes forecasts for total value of the CBDC & stablecoin market, including the total expected savings that can be gained using these payments method, and the transaction volume of various market segments.
- Juniper Research Competitor Leaderboard: Key market player capability and capacity assessment for 14 CBDC vendors, via the Juniper Research Competitor Leaderboard; featuring market size for major players in the CBDC development industry.
SAMPLE VIEW
Market Data & Forecasting Report:
The numbers tell you what's happening, but our written report details why, alongside the methodologies.
Market Trends & Strategies Report:
A comprehensive analysis of the current market landscape, alongside strategic recommendations.
Market Data & Forecasting Report
The market-leading research suite for the CBDCs and Stablecoin market includes access to the full set of forecast data of 95 tables and 45,600 datapoints. Metrics in the research suite include:
- Total Transaction Volume, Value, and Savings Received from the CBDC Market
- Total Transaction Volume, Value, and Savings Received from the Stablecoin Market
- Total Transaction Volume and Value of the CBDC and Stablecoin Market, Split by the following Market Segments:
- Domestic Consumer Transactions
- Domestic B2B Transactions
- Cross-border Consumer Transactions
- Cross-Border B2B Transactions
Juniper Research Interactive Forecast Excel contains the following functionality:
- Statistics Analysis: Users benefit from the ability to search for specific metrics, displayed for all regions and countries across the data period. Graphs are easily modified and can be exported to the clipboard.
- Country Data Tool: This tool lets users look at metrics for all regions and countries in the forecast period. Users can refine the metrics displayed via a search bar.
- Country Comparison Tool: Users can select and compare specific countries. The ability to export graphs is included in this tool.
- What-if Analysis: Here, users can compare forecast metrics against their own assumptions, via five interactive scenarios.
Market Trends & Strategies Report
This report examines the CBDC & Stablecoin market landscape in detail; assessing trends and factors shaping the evolution of this rapidly growing market. The report delivers comprehensive analysis of the strategic opportunities for CBDC vendors; addressing key verticals and developing challenges, and highlighting how stakeholders should navigate these. It also includes evaluation of key country-level opportunities for stakeholders in the CBDC & stablecoins market.
Competitor Leaderboard Report
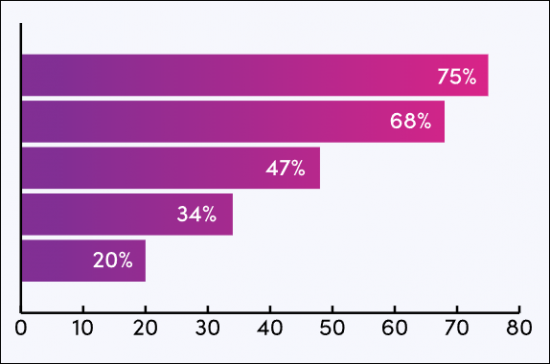
The Competitor Leaderboard report provides a detailed evaluation and market positioning for 14 leading vendors in the CBDC space. The vendors are positioned as established leaders, leading challengers, or disruptors and challengers, based on capacity and capability assessments:
|
|
This document is centred around the Juniper Research Competitor Leaderboard; a vendor positioning tool that provides an at-a-glance view of the competitive landscape in a market, backed by a robust methodology.
Table of Contents
Market Trends & Strategies
1. Key Takeaways & Strategic Recommendations
- 1.1. Key Takeaways
- 1.2. Strategic Recommendations
2. Market Landscape
- 2.1. Introduction
- 2.2. History of CBDCs and Stablecoins
- 2.3. Key Trends and Drivers
- 2.3.1. Stablecoin Use has an Outsized Disruptive Impact on the Financial Landscape
- 2.3.2. The Role of Regulations in Guiding Digital Currencies
- 2.3.3. Emerging Nations Have the Most to Gain from Developing rCBDCs
- 2.3.4. Advanced Cryptographic Methods Necessary to Preserve Privacy
- 2.3.5. How Could Smart Contracts Transform the Economy?
- i. Subscriptions
- ii. Liquidity Management
- iii. DvP (Delivery Versus Payment)
- iv. (PVP) Payment Versus Payment
- v. M2M (Machine-to-Machine) Payments
3. Segment Analysis
- 3.1. Retail CBDCs
- Figure 3.1: The Status of Retail CBDCs Worldwide as of September 2024
- 3.1.1. Why Develop a Retail CBDC?
- Figure 3.2: Potential Goals of Retail CBDC Development
- 3.1.2. Potential Goals/Motives of CBDC Development
- i. Geopolitics
- ii. Enhance Cross-border Payments
- iii. Financial Inclusion in the Digital Economy
- iv. Retaining Monetary Sovereignty
- Figure 3.3: Design Principles for a Digital Pound
- 3.1.3. High-level Technological Analysis: Design Choices for CBDCs
- 3.1.4. What Are the Potential Barriers to Adoption?
- Figure 3.4: CBDC Features Compared to Physical Cash
- 3.2. Wholesale CBDCs
- Figure 3.5: Status of Wholesale CBDCs Worldwide as of September 2024
- 3.2.1. The Evolution of Wholesale Payment Systems
- Figure 3.6: How Wholesale Bank Payments Happen Today
- i. What Are the Inefficiencies in this System?
- 3.2.2. How Can Wholesale CBDCs Address This?
- Figure 3.7: Objectives of Wholesale CBDC Development
- 3.2.3. Current wCBDC Cross-border Projects
- Figure 3.8: The Project Agora Platform
- 3.2.4. Alternatives to Wholesale CBDC Development
- 3.3. Stablecoins
- 3.3.1. Key Actors in the Stablecoin Market
- i. What Are the Use Cases of Stablecoins?
- Figure 3.9: Use Cases for Stablecoins
- ii. What Are Future Use Cases for Stablecoins?
- i. What Are the Use Cases of Stablecoins?
- 3.3.1. Key Actors in the Stablecoin Market
- 3.4. The Interplay Between Stablecoins and CBDCs
4. Country Readiness Index
- 4.1. Introduction to the Country Readiness Index
- Figure 4.1: CBDC and Stablecoin Country Readiness Index Regional Definitions
- Figure 4.2: Juniper Research Country Readiness Index Scoring Criteria: CBDC and Stablecoins
- Figure 4.3: Juniper Research Country Readiness Index: Global CBDC and Stablecoin Market
- Figure 4.4: CBDC and Stablecoin Country Readiness Index: Market Segments
- 4.1.1. Focus Market
- i. The Strength of BRICS
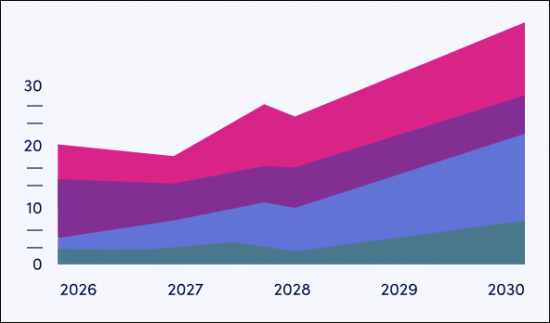
- Figure 4.5: Total CBDC & Stablecoin Market Value per Annum ($m), Split by Seven Key Markets, 2024-2031
- ii. West Europe and the Digital Euro
- iii. Japan
- iv. The US
- v. China
- i. The Strength of BRICS
- 4.1.2. Growth Market
- Figure 4.6: Total Value of CBDCs and Stablecoins in Growth Markets, ($m), By Country 2024-2031
- i. Prioritising Wholesale over Retail CBDC Development
- 4.1.3. Saturated Markets
- Figure 4.7: Saturated Markets' CBDC & Stablecoin Market Value, ($m), By Country, 2024-2031
- i. Heavy Restrictions on Cryptocurrency
- 4.1.4. Developing Markets
- Figure 4.8: CBDC & Stablecoin Market Value in Six Developing Markets, ($m), By Country, 2024-2031
- i. Restrictive Legislation
- ii. Gaps in Technological Infrastructure
- iii. Adequate Alternative Financial Systems
- Table 4.9: Juniper Research's Country Readiness Index Heatmap: North America
- Table 4.10: Juniper Research's Country Readiness Index Heatmap: Latin America
- Table 4.11: Juniper Research's Country Readiness Index Heatmap: West Europe
- Table 4.12: Juniper Research's Country Readiness Index Heatmap: Central & East Europe
- Table 4.13: Juniper Research's Country Readiness Index Heatmap: Far East & China
- Table 4.14: Juniper Research's Country Readiness Index Heatmap: Indian Subcontinent
- Table 4.15: Juniper Research's Country Readiness Index Heatmap: Rest of Asia Pacific
- Table 4.16: Juniper Research's Country Readiness Index Heatmap: Africa & Middle East
Competitor Leaderboard
1. Juniper Research Competitor Leaderboard
- 1.1. Why Read This Report?
- Table 1.1: Juniper Research Competitor Leaderboard CBDC Vendor Product Portfolio
- Figure 1.2: Juniper Research Leaderboard: CBDC Vendors
- Table 1.3: Juniper Research Leaderboard: CBDC Vendor Positioning
- Figure 1.4: Juniper Research Leaderboard Heatmap: CBDC Vendors
- 1.2. CBDC Vendor Profiles
- 1.2.1. Accenture
- i. Corporate
- ii. Geographic Spread
- iii. Key Clients and Strategic Partnerships
- iv. High-level View of Offerings
- v. Juniper Research's View: Key Strengths and Strategic Partnerships
- 1.2.2. Bitt
- i. Corporate
- ii. Geographic Spread
- iii. Key Clients & Strategic Partnerships
- iv. High-level View of Offerings
- v. Juniper Research's View: Key Strengths & Strategic Development Opportunities
- 1.2.3. Consensys
- i. Corporate
- ii. Geographic Spread
- iii. Key Clients & Strategic Partnerships
- iv. High-level View of Offerings
- v. Juniper Research's View: Key Strengths & Strategic Development Opportunities
- 1.2.4. eCurrency
- i. Corporate
- ii. Geographic Spread
- iii. Key Clients & Strategic Partnerships
- iv. High-level View of Offerings
- Figure 1.5: Use Cases for eCurrency DSC3
- v. Juniper Research's View: Key Strengths & Strategic Development Opportunities
- 1.2.5. EMTECH
- i. Corporate
- ii. Geographic Spread
- iii. Key Clients & Strategic Partnerships
- iv. High-level View of Offerings
- Figure 1.6: The Features and Benefits of the Beyond Cash
- v. Juniper Research Key Strengths and Strategic Opportunities
- 1.2.6. FIS
- i. Corporate
- ii. Geographic Spread
- iii. Key Clients and Strategic Partnerships
- iv. High-level View of Offerings
- v. Juniper Research's View: Key Strengths & Strategic Development Opportunities
- 1.2.7. Giesecke + Devrient
- vi. Corporate
- vii. Geographic Spread
- viii. Key Clients & Strategic Partnerships
- ix. High-level View of Offerings
- x. Juniper Research's View: Key Strengths & Strategic Opportunities
- 1.2.8. IDEMIA
- i. Corporate
- ii. Geographical Spread
- iii. Key Clients & Strategic Partnerships
- iv. High-level View of Offerings
- v. Juniper Research's View: Key Strengths & Strategic Recommendations
- 1.2.9. Mastercard
- i. Corporate
- Table 1.7: Mastercard Revenue ($m), 2022-2023
- ii. Geographical Spread
- iii. Key Clients & Strategic Partnerships
- iv. High-level View of Offerings
- Figure 1.8: Mastercard's CBDC Sandbox Architecture
- v. Juniper Research's View: Key Strengths & Strategic Recommendations
- i. Corporate
- 1.2.10. Nahmii
- i. Corporate
- ii. Geographic Spread
- iii. Key Clients & Strategic Partnerships
- iv. High-level View of Offerings
- v. Juniper Research's View: Key Strengths & Strategic Development Opportunities
- 1.2.11. R3
- i. Corporate
- ii. Geographic Spread
- iii. Key Clients & Strategic Partnerships
- iv. High-level View of Offerings
- v. Juniper Research's View: Key Strengths and Strategic Recommendations
- 1.2.12. Ripple
- i. Corporate
- ii. Geographic Spread
- iii. Key Clients & Strategic Partnerships
- iv. High-level View of Offerings
- v. Juniper Research's View: Key Strengths & Strategic Development
- 1.2.13. Soramitsu
- i. Corporate
- ii. Geographic Spread
- iii. Key Clients & Strategic Partnerships
- iv. High-level View of Offerings
- v. Juniper Research's View: Key Strengths & Strategic Recommendations
- 1.2.14. Stellar
- i. Corporate
- ii. Geographic Spread
- iii. Key Clients & Strategic Partnerships
- iv. High-level View of Offerings
- v. Juniper Research's View: Key Strengths & Strategic Opportunities
- 1.2.1. Accenture
Data & Forecasting
1. Market Overview
- 1.1. Introduction
- 1.2. Methodology & Assumptions
- Figure 1.1: Consumer Domestic CBDCs/Stablecoins Methodology
- Figure 1.2: Consumer Cross-border CBDCs/Stablecoins Methodology
- Figure 1.3: B2B Domestic CBDCs/Stablecoins Methodology
- Figure 1.4: B2B Cross-border CBDCs/Stablecoins Methodology
2. Forecast Summary
- 2.1. Total Volume of CBDC and Stablecoin Transactions
- Figure & Table 2.1: Total Number of Transactions Using Stablecoins and CBDCs (m), Split by Stablecoins and CBDCs, 2024-2031
- 2.2. Total Value of Stablecoin & CBDC Transactions
- Figure & Table 2.2: Total Value of Stablecoin and CBDC Transactions ($bn), Split by 8 Key Regions, 2024-2031
- 2.3. Potential Savings from CBDC and Stablecoin Use
- Figure & Table 2.3: Total Savings Achieved Using Stablecoins and CBDCs ($m), Split by 8 Key Regions, 2024-2031
3. CBDCs: Market Forecast
- 3.1. Total Number of CBDC Transactions
- Figure & Table 3.1: Total Number of Transactions Using CBDC (m), Split by 8 Key Regions, 2024-2031
- 3.2. Total Number of CBDC Transactions
- Figure & Table 3.2: Total Number of CBDC Transactions (m), Split by Segment, 2024-2031
- 3.3. Total Value of CBDC Transactions
- Figure & Table 3.3: Total Value of CBDC Transactions ($bn), Split by 8 Key Regions, 2024-2031
- 3.4. Total Value of CBDC Transactions
- Figure & Table 3.4: Total Value of CBDC Transactions, ($bn), Split by Segment, 2024-2031
- 3.5. Total Potential Savings Achieved Using CBDCs ($m)
- Figure & Table 3.5: Total Savings Achieved Using CBDCs ($m), Split by 8 Key Regions, 2024-2031
- 3.6. Total Potential Savings Achieved Using CBDCs
- Figure & Table 3.6: Total Savings Achieved Using CBDCs ($m), Split by Segment, 2024-2031
4. Stablecoins: Market Forecast
- 4.1. Total Number of Stablecoin Transactions
- Figure & Table 4.1: Total Number of Transactions Using Stablecoins (m), Split 8 Key Regions, 2024-2031
- 4.2. Total Number of Stablecoin Transactions
- Figure & Table 4.2: Total Number of Transactions Using Stablecoins (m), Split Segment, 2024-2031
- 4.3. Total Value of Stablecoin Transactions
- Figure & Table 4.3: Total Value of Stablecoin Transactions ($bn), Split by 8 Key Regions, 2024-2031
- 4.4. Total Value of Stablecoin Transactions
- Figure & Table 4.4: Total Value of Stablecoin Transactions, ($m), Split by Segment, 2024-2031
- 4.5. Total Potential Savings Achieved Using Stablecoins ($m)
- Figure & Table 4.5: Total Savings Achieved Using Stablecoins ($m), Split by 8 Key Regions, 2024-2031
- 4.6. Total Potential Savings Achieved Using Stablecoins ($m)
- Figure & Table 4.6: Total Savings Achieved Using Stablecoins ($m), Split by Segment, 2024-2031
 全球加密货币交易平台市场机会与策略展望(至2034年)
 2026-2030年全球加密货币市场
 加密货币市场分析及预测(至2035年):类型、产品类型、服务、技术、应用、最终用户、采用类型、解决方案与阶段
 全球加密货币交易平台市场规模、份额、趋势和成长分析报告(2026-2034)
 加密货币市场-全球产业规模、份额、趋势、机会及预测(按类型、最终用户、地区和竞争格局划分,2021-2031年)
 日本加密货币市场报告(按类型、组件、流程、应用和地区划分,2026-2034 年)
 加密货币交易所市场:依交易所模式、交易类型、加密货币类型和地区划分
 数位货币市场规模、份额和成长分析(按组件、类型、最终用户和地区划分)-2026-2033年产业预测
 加密货币市场规模、份额和成长分析(按类型、组件、製程、应用和地区划分)-2026-2033年产业预测
 加密货币市场规模、份额和趋势分析报告:按组件、流程、类型、最终用途、地区和细分市场预测(2026-2033 年)