


 |
市场调查报告书
商品编码
1627227
行动漫游:2025-2029 年全球市场展望Global Mobile Roaming Market: 2025-2029 |
||||||
预计到 2028 年全球批发漫游收入将翻倍
| 关键统计 | |
|---|---|
| 2025 年零售漫游总收入: | 134亿美元 |
| 2029 年零售漫游总收入: | 209亿美元 |
| 2025 年至 2029 年零售漫游收入成长: | 56% |
| 预测期间: | 2024-2029 |
我们的研究套件对未来五年将发生重大变化的市场进行了深入而有见地的分析。行动漫游供应商和行动营运商等利害关係人将能够更好地瞭解批发和零售漫游市场将如何发展,并可以评估旅行 eSIM、5G 漫游和物联网设备漫游对市场的影响程度。
行动漫游市场套件包含多个可单独购买的选项,其中包括行动漫游流量的资料映射和未来收入潜力。此外,该报告还包括重点介绍主要市场趋势和未来机会的深入研究,以及对行动漫游领域 23 家领先供应商的广泛分析。
总的来说,这些为瞭解不断变化的市场提供了重要工具,使行动漫游供应商和营运商能够掌握趋势并规划未来策略。该套件的范围是无与伦比的,使其成为预测不可预测的市场未来的极其有用的资源。
主要特点
- 市场动态:深入瞭解行动漫游市场变化带来的主要趋势和市场机会。该研究重点介绍了行动漫游供应商和行动营运商的关键成长机会,包括 5G 漫游、物联网漫游和旅行 eSIM 的采用。它也探讨了遗留网路退役和诈欺活动所带来的课题,并提出如何应对这些课题的建议。此外,该报告还对60个主要国家的行动漫游市场现状和未来成长进行了区域成长率分析,并指出了值得关注的重点市场。
- 关键要点和策略建议:本报告深入分析了行动漫游市场的关键机会和研究成果,并为行动漫游供应商和行动营运商提供了关键策略建议。
- 基准产业预测:我们提供批发漫游和零售漫游的 5 年预测资料库,提供每个部门的使用者、流量和收入预测。这些领域包括消费者批发漫游、物联网批发漫游、4G智慧型手机漫游、5G智慧型手机漫游、漫游设备和邮轮漫游。
- Juniper Research 竞赛排行榜:评估 23 家行动漫游供应商的能力,并根据市场表现、收入和未来业务前景等标准对其进行评分。
范例视图
市场数据及预测报告
市场趋势与策略报告
市场数据及预测报告
研究套件包括一份全面的五年预测资料集,其中包含 106 个表格和超过 48,300 个资料点。该研究套件包括以下指标:
- 批发漫游流量总量
- 批发漫游收入总额
- 零售漫游流量总量
- 零售漫游总收入
这些指数针对以下主要市场提供:
- 消费者批发漫游
- 物联网批发漫游
- 4G 零售漫游
- 5G 零售漫游
- 零售消费性设备漫游
- 巡游漫游
目录
市场趋势与策略
第 1 章 关键要点与策略建议
第 2 章 未来市场展望:批发漫游
- 批发漫游:简介
- 2G 与 3G 的终结
- 5G漫游
- 网路切片
- 基础设施共享
- 捆绑服务
- VoLTE 作为 5G SA 的后备方案
- 5G漫游安全
- 6G漫游
- 基于云端的漫游服务
- 适合旅行的 eSIM
- BCE(计费和收费演进)
- 关于 API
- 物联网漫游设备
- 未经授权的漫游活动
第三章 未来市场展望:零售漫游
- 零售漫游:简介
- 旅行 SIM 卡和旅行 eSIM 卡
- 法规
- 基于云端的漫游服务
- 5G 和 6G 漫游
- 消费者设备漫游
- 游轮与客舱漫游
第 4 章:国家准备指数
- 国家准备指数:简介
- 主要市场
- 不断成长的市场
- 市场饱和
- 新兴市场
竞赛排行榜
第 1 章 Juniper Research 竞争排行榜
第 2 章 供应商简介
- 行动漫游供应商资料
-
奥地利电信集团
- 放大
- 比克
- 广泛前进
- Cellusys
- 康丰
- 南部电网 德国电信全球营运商
- 阿联酋电信
- iBASIS
- 移动
- Nextgen 清算
- 橙色批发
- 漫游能力
- Syniverse 塔塔通讯
- Tele2 国际批发 西班牙电信全球解决方案
- Telenor Linx
- 特尔纳
- TNS
- 托米亚
- 沃达丰漫游服务
- 研究方法
- 限制和解释
数据和预测
第一章市场预测及要点
- 行动漫游预测:简介
- 入站漫游连接
- 入境漫游收入
- 出境漫游用户
- 出境零售漫游收入
- 批发漫游消费者语音、简讯、数据使用
- 资料漫游预测方法
- 语音漫游预测法
- 简讯漫游预测方法
- 入境行动用户
- 入境漫游用户:简讯收入
- 入境漫游用户:语音收入
- 入境漫游用户:数据收入
第三章 物联网批发漫游
- 批发漫游:物联网设备与感测器
- 预测方法与假设
- 入站漫游物联网连线数
- 物联网批发漫游总收入
- 语音、简讯与数据零售漫游预测:简介
- 预测方法
- 出站简讯漫游收入
- 出站语音漫游收入
- 出境数据漫游收入
第五章 4G零售漫游
- 预测与研究方法
- 预测方法与假设
- 出境 4G 漫游用户总数
- 出站 4G 语音、简讯和数据漫游总收入
第六章 5G零售漫游
- 预测与研究方法
- 预测方法与假设
- 出境 5G 漫游用户总数
- 出站 5G 语音、简讯和数据漫游总收入
第 7 章:消费性设备
- 预测与研究方法
- 预测动作法律和先决条件
- 总漫游收入
第八章 邮轮漫游
- 预测与研究方法
- 预测方法与假设
- 邮轮漫游总收入
'Global Wholesale Roaming Revenue to Double by 2028'
| KEY STATISTICS | |
|---|---|
| Total retail roaming revenue in 2025: | 13.4bn |
| Total retail roaming revenue in 2029: | 20.9bn |
| 2025 to 2029 retail roaming revenue increase: | 56% |
| Forecast period: | 2024-2029 |
Overview
Our "Mobile Roaming" research suite provides a detailed and insightful analysis of a market set for significant change over the next five years. It enables stakeholders, from mobile roaming vendors and mobile operators, to better understand how both the wholesale and retail roaming markets will evolve, assessing the extent to which travel eSIMs, 5G roaming and Internet of Things (IoT) device roaming will impact the market.
The mobile roaming market suite includes several different options that can be purchased separately, including data mapping of the traffic and future revenue potential of mobile roaming. Additionally, it includes an insightful study uncovering key trends and future opportunities within the market, as well as an extensive analysis of 23 leading vendors in the mobile roaming space. The coverage can also be purchased as a full research suite, which contains all these elements and includes a substantial discount.
Collectively, they provide a critical tool for understanding this ever-changing market, allowing mobile roaming vendors and operators to capitalise on trends and shape their future strategy. This research suite's unparalleled coverage makes it an incredibly useful resource for projecting the future of such an unpredictable market.
Key Features
- Market Dynamics: Insights into key trends and market opportunities resulting from changes within the mobile roaming market. This research addresses key growth opportunities for mobile roaming vendors and mobile operators, including 5G roaming, IoT roaming and travel eSIM adoption. This research then considers challenges posed by legacy network sunsetting and fraudulent activity, providing recommendations for how these must be navigated. Moreover, it includes a regional market growth rate analysis on the current development and future growth of mobile roaming across 60 key countries, identifying key focus markets.
- Key Takeaways & Strategic Recommendations: In-depth analysis of key development opportunities and findings within the mobile roaming market, accompanied by key strategic recommendations for mobile roaming vendors and mobile operators.
- Benchmark Industry Forecasts: Five-year forecast databases are provided for wholesale and retail roaming, providing user, traffic and revenue splits for each sector. These sector splits include consumer wholesale roaming, IoT wholesale roaming, 4G smartphone roaming, 5G smartphone roaming, roaming devices and cruise roaming.
- Juniper Research Competitor Leaderboard: Key player capability and capacity assessment for 23 mobile roaming vendors via the Juniper Research Competitor Leaderboard; scoring these vendors on criteria such as market performance, revenue and future business prospects.
SAMPLE VIEW
Market Data & Forecasting Report
The numbers tell you what's happening, but our written report details why, alongside the methodologies.
Market Trends & Strategies Report
A comprehensive analysis of the current market landscape, alongside strategic recommendations.
Market Data & Forecasting Report
The market-leading research suite for the Mobile Roaming market includes access to a comprehensive five-year forecast dataset comprising 106 tables and over 48,300 datapoints. Metrics in the research suite include:
- Total Wholesale Roaming Traffic
- Total Wholesale Roaming Revenue
- Total Retail Roaming Traffic
- Total Retail Roaming Revenue
These metrics are provided for the following key market verticals:
- Consumer Wholesale Roaming
- IoT Wholesale Roaming
- 4G Retail Roaming
- 5G Retail Roaming
- Retail Consumer Device Roaming
- Cruise Roaming
Juniper Research Interactive Forecast Excel contains the following functionality:
- Statistics Analysis: Users benefit from the ability to search for specific metrics, displayed for all regions and countries across the data period. Graphs are easily modified and can be exported to the clipboard.
- Country Data Tool: This tool lets users look at metrics for all regions and countries in the forecast period. Users can refine the metrics displayed via a search bar.
- Country Comparison Tool: Users can select and compare specific countries. The ability to export graphs is included in this tool.
- What-if Analysis: Here, users can compare forecast metrics against their own assumptions via five interactive scenarios.
Market Trends & Strategies Report
This trends analysis report examines the mobile roaming market landscape in detail; assessing market trends and factors shaping the evolution of this rapidly changing market. The essential strategy report delivers a comprehensive analysis of the strategic opportunities for mobile roaming providers; addressing key verticals, developing market challenges, and how stakeholders must navigate these. It also includes an evaluation of the key country-level opportunities for mobile roaming growth, with the Country Readiness Index.
Competitor Leaderboard Report
The Competitor Leaderboard report provides a detailed evaluation and market positioning for 23 leading vendors in the mobile roaming space. The vendors are positioned as established leaders, leading challengers, or disruptors and challengers, based on capacity and capability assessments:
|
|
This competitive analysis document is centred around the Juniper Research Competitor Leaderboard, a vendor positioning tool that provides an at-a-glance view of the competitive landscape in a market; backed by a robust methodology.
Table of Contents
Market Trends & Strategies
1. Key Takeaways & Strategic Recommendations
- 1.1. Key Takeaways and Strategic Recommendations
2. Future Market Outlook - Wholesale Roaming
- 2.1. Introduction to Wholesale Roaming
- Figure 2.1: Mobile Roaming Structure
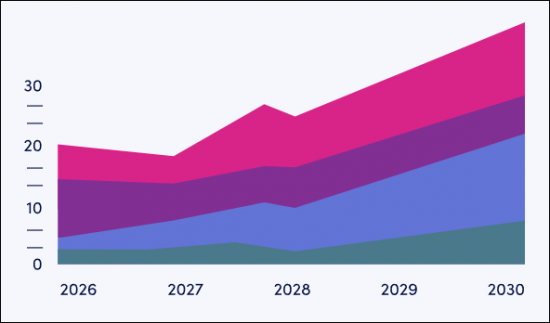
- Figure 2.2: Total Wholesale Roaming Revenue ($m), Split by 8 Key Regions, 2024-2029
- 2.2. 2G and 3G Sunsetting
- i. VoLTE Roaming
- 2.3. 5G Roaming
- i. Network Slicing
- ii. Infrastructure Sharing
- iii. Bundled Services
- iv. VoLTE as 5G SA Fallback
- v. 5G Roaming Security
- 2.4. 6G Roaming
- 2.5. Cloud-based Roaming Services
- 2.6. Travel eSIMs
- 2.7. Evolution of Billing and Charging Evolution (BCE)
- Figure 2.3: Data Flow in BCE Process
- Figure 2.4: High-level Reporting Exchange Flow
- 2.8. APIs
- 2.9. IoT Roaming Devices
- Figure 2.5: Total Number of IoT Connections that are Roaming (m), Split by 8 Key Regions, 2024-2029
- Figure 2.6: Total IoT Wholesale Roaming Revenue
- Figure 2.7: IoT Use Cases
- 2.10. Fraudulent Roaming Activity
3. Future Market Outlook - Retail Roaming
- 3.1. Introduction to Retail Roaming
- Figure 3.1: Total Retail Roaming Revenue Split by 8 Key Regions, 2024
- 3.2. Travel SIMs and Travel eSIMs
- Figure 3.2: Total Roaming Spend Lost to Travel SIMs/eSIMs ($m), Split by 8 Key Regions, 2023-2028
- 3.2.1. Travel SIMs
- 3.2.2. Travel eSIMs
- Figure 3.3: Total Number of Smartphones that have eSIMs (m), Split by 8 Key Regions, 2024-2026
- 3.3. Regulatory
- 3.4. Cloud-based Roaming Services
- 3.5. 5G and 6G Roaming
- 3.6. Consumer Device Roaming
- 3.7. Cruise and In-flight Roaming
- 3.7.1. Cruise Roaming
- Figure 3.4: Infographic Showing the Process of Cruise Roaming
- Figure 3.5: Total Cruise Roaming Revenue ($m), Split by 8 Key Regions, 2024-2029
- 3.7.2. In-flight Roaming
- 3.7.1. Cruise Roaming
4. Country Readiness Index
- 4.1. Introduction to Country Readiness Index
- Figure 4.1: Mobile Roaming Country Readiness Index Regional Definitions
- Table 4.2: Juniper Research Country Readiness Index Scoring Criteria: Mobile Roaming
- Figure 4.3: Juniper Research Country Readiness Index: Mobile Roaming
- Table 4.4: Mobile Roaming Country Readiness Index: Market Segments
- 4.2. Focus Markets
- Figure 4.5: Total Retail Roaming Revenue ($m), Split by 20 Focus Markets, 2024
- 4.2.1. RLAH
- Figure 4.6: Total Active Outbound Mobile Roaming Subscribers (m), Split by Focus Markets in West Europe, 2024
- 4.2.2. The GCC
- Figure 4.7: Total Retail Roaming Revenue ($m), Split by Saudi Arabia and United Arab Emirates, 2024-2029
- 4.2.3. The Nordic Roaming Initiative
- Figure 4.8: Total Retail Roaming Revenue ($m), Split by Sweden, Denmark and Norway, 2024-2029
- 4.2.4. North America
- Figure 4.9: Total Outbound Travellers (m), Split by US and Canada, 2024-2029
- 4.2.5. Far East & Asia
- 4.3. Growth Markets
- 4.3.1. India
- Figure 4.10: GDP per Capita ($), 2024-2029, India
- 4.3.2. Belgium
- 4.3.1. India
- 4.4. Saturated Markets
- 4.5. Developing Markets
- Figure 4.11: Total Retail Roaming Revenue ($m), Split by Developing Markets, 2024
- 4.5.1. Roaming Initiatives in Africa
- 4.5.2. Roaming Initiatives in Latin America
- Table 4.12: Juniper Research's Country Readiness Index Heatmap: North America
- Table 4.13: Juniper Research's Country Readiness Index Heatmap: Latin America
- Table 4.14: Juniper Research's Country Readiness Index Heatmap: West Europe
- Table 4.15: Juniper Research's Country Readiness Index Heatmap: Central & East Europe
- Table 4.16: Juniper Research's Country Readiness Index Heatmap: Far East & China
- Table 4.17: Juniper Research's Country Readiness Index Heatmap: Indian Subcontinent
- Table 4.18: Juniper Research's Country Readiness Index Heatmap: Rest of Asia Pacific
- Table 4.19: Juniper Research's Country Readiness Index Heatmap: Africa & Middle East
Competitor Leaderboard
1. Juniper Research Competitor Leaderboard
- 1.1. Why Read This Report
- Mobile Operators Must Embrace Travel eSIMs as a New Revenue Opportunity, Rather Than View as a Threat
- 5G and VoLTE Roaming to Accelerate 2G and 3G Roaming Network Sunsetting
- Table 1.1: Juniper Research Competitor Leaderboard: Vendors & Product Portfolio (1 of 2)
- Table 1.2: Juniper Research Competitor Leaderboard: Vendors & Product Portfolio (2 of 2)
- Figure 1.3: Juniper Research Competitor Leaderboard: Mobile Roaming
- Table 1.4: Juniper Research Competitor Leaderboard: Vendors
- Table 1.5: Juniper Research Competitor Leaderboard Heatmap: Mobile Roaming Vendors (1 of 2)
- Table 1.6: Juniper Research Competitor Leaderboard Heatmap: Mobile Roaming Vendors (2 of 2)
2. Vendor Profiles
- 2.1. Mobile Roaming Vendor Profiles
- 2.1.1. A1 Telekom Austria Group
- i. Corporate Information
- Figure 2.1: A1 Group Select Financial Information, 2021-2023
- ii. Geographical Spread
- iii. Key Clients & Strategic Partnerships
- iv. High-level View of Offerings
- v. Juniper Research's View: Key Strengths & Strategic Opportunities
- i. Corporate Information
- 2.1.2. Amplitiv
- i. Corporate Information
- ii. Geographical Spread
- iii. Key Clients & Strategic Partnerships
- iv. High-level View of Offerings
- v. Juniper Research's View: Key Strengths & Strategic Opportunities
- 2.1.3. BICS
- i. Corporate Information
- Table 2.2: BICS' Select Financial Information (Euro-m), 2022 & 2023
- ii. Geographical Spread
- iii. Key Clients & Strategic Partnerships
- iv. High-level View of Offerings
- v. Juniper Research's View: Key Strengths & Strategic Opportunities
- i. Corporate Information
- 2.1.4. BroadForward
- i. Corporate Information
- ii. Geographical Spread
- iii. Key Clients & Strategic Partnerships
- iv. High-level View of Offerings
- Figure 2.3: BroadForward's SEPP
- v. Juniper Research's View: Key Strengths & Strategic Opportunities
- 2.1.5. Cellusys
- i. Corporate Information
- Figure 2.4: Cellusys Portfolio
- ii. Geographical Spread
- iii. Key Clients & Strategic Partnerships
- iv. High-level View of Offerings
- Figure 2.5: Cellusys Roaming Platform
- v. Juniper Research's View: Key Strengths & Strategic Opportunities
- i. Corporate Information
- 2.1.6. Comfone
- i. Corporate Information
- ii. Geographical Spread
- iii. Key Clients & Strategic Partnerships
- iv. High-level View of Offerings
- Figure 2.6: Comfone's Portfolio
- v. Juniper Research's View: Key Strengths & Strategic Opportunities
- 2.1.7. CSG
- i. Corporate Information
- Table 2.7: CSG's Select Financial Information ($m), 2021-2023
- Table 2.8: CSG's Acquisitions
- ii. Geographical Spread
- iii. Key Clients & Strategic Partnerships
- iv. High-level View of Offerings
- v. Juniper Research's View: Key Strengths & Strategic Opportunities
- i. Corporate Information
- 2.1.8. Deutsche Telekom Global Carrier
- i. Corporate Information
- ii. Geographical Spread
- iii. Key Clients & Strategic Partnerships
- iv. High-level View of Offerings
- v. Juniper Research's View: Key Strengths & Strategic Opportunities
- 2.1.9. Etisalat
- i. Corporate Information
- ii. Geographical Spread
- iii. Key Clients & Strategic Partnerships
- iv. High-level View of Offerings
- v. Juniper Research's View: Key Strengths & Strategic Opportunities
- 2.1.10. iBASIS
- i. Corporate Information
- ii. Geographical Spread
- Figure 2.9: iBASIS' Global Customer Connections
- iii. Key Clients & Strategic Partnerships
- iv. High-level View of Offerings
- v. Juniper Research's View: Key Strengths & Strategic Opportunities
- 2.1.11. Mobileum
- i. Corporate Information
- ii. Geographical Spread
- iii. Key Clients & Strategic Partnerships
- iv. High-level View of Offerings
- Figure 2.10: Mobileum's Roaming Management Suite
- v. Juniper Research's View: Key Strengths & Strategic Opportunities
- 2.1.12. Nextgen Clearing
- i. Corporate Information
- ii. Geographical Spread
- iii. Key Clients & Strategic Partnerships
- iv. High-level View of Offerings
- v. Juniper Research's View: Key Strengths & Strategic Opportunities
- 2.1.13. Orange Wholesale
- i. Corporate Information
- ii. Geographical Spread
- Figure 2.11: Orange Operations Map
- iii. Key Clients & Strategic Partnerships
- iv. High-level View of Offerings
- v. Juniper Research's View: Key Strengths & Strategic Opportunities
- 2.1.14. Roamability
- i. Corporate Information
- ii. Geographical Spread
- iii. Key Clients & Strategic Partnerships
- iv. High-level View of Offerings
- Figure 2.12: Roamability's DMI Solution Snapshot
- v. Juniper Research's View: Key Strengths & Strategic Opportunities
- 2.1.15. Syniverse
- i. Corporate Information
- ii. Geographical Spread
- iii. Key Clients & Strategic Partnerships
- iv. High-level View of Offering
- Figure 2.13: Syniverse's Clearing and Settlement Services
- v. Juniper Research's View: Key Strengths & Strategic Opportunities
- 2.1.16. Tata Communications
- i. Corporate Information
- ii. Geographical Spread
- iii. Key Clients & Strategic Partnerships
- iv. High-level View of Offerings
- v. Juniper Research's View: Key Strengths & Strategic Opportunities
- 2.1.17. Tele2 International Wholesale
- i. Corporate Information
- ii. Geographical Spread
- iii. Key Clients & Strategic Partnerships
- iv. High-level View of Offerings
- v. Juniper Research's View: Key Strengths & Strategic Opportunities
- 2.1.18. Telefonica Global Solutions
- i. Corporate Information
- Figure 2.14: Telefonica's Select Financial Information (Euro-m), 2020-2022
- ii. Geographical Spread
- iii. Key Clients & Strategic Partnerships
- iv. High-level View of Offerings
- Figure 2.15: Telefonica's 5G Roaming Suite
- v. Juniper Research's View: Key Strengths & Strategic Opportunities
- i. Corporate Information
- 2.1.19. Telenor Linx
- i. Corporate Information
- ii. Geographical Spread
- iii. Key Clients & Strategic Partnerships
- iv. High-level View of Offerings
- v. Juniper Research's View: Key Strengths & Strategic Opportunities
- 2.1.20. Telna
- i. Corporate Information
- ii. Geographical Spread
- iii. Key Clients & Strategic Partnerships
- iv. High-level View of Offerings
- v. Juniper Research's View: Key Strengths & Strategic Opportunities
- 2.1.21. TNS
- i. Corporate Information
- ii. Geographical Spread
- iii. Key Clients & Strategic Partnerships
- iv. High-level View of Offerings
- v. Juniper Research's View: Key Strengths & Strategic Opportunities
- 2.1.22. TOMIA
- i. Corporate Information
- ii. Geographical Spread
- iii. Key Clients & Strategic Partnerships
- iv. High-level View of Offerings
- v. Juniper Research's View: Key Strengths & Strategic Opportunities
- 2.1.23. Vodafone Roaming Services
- i. Corporate Information
- ii. Geographical Spread
- iii. Key Clients & Strategic Partnerships
- iv. High-level View of Offerings
- Table 2.16: Vodafone's Global Signalling & IPX Connectivity
- v. Juniper Research's View: Key Strengths & Strategic Opportunities
- 2.1.1. A1 Telekom Austria Group
- 2.2. Juniper Research Leaderboard Methodology
- 2.3. Limitations & Interpretations
- Table 2.17: Juniper Research Competitor Leaderboard Scoring Criteria: Mobile Roaming Vendors
Data & Forecasting
1. Market Forecast & Key Takeaways
- 1.1. Introduction to Mobile Roaming Forecasts
- Figure 1.1: Total Outbound Travellers (m), Split by 8 Key Regions, 2024-2029
- 1.1.1. Total Inbound Roaming Connections
- Figure & Table 1.2: Total Inbound Roaming Connections (m), Split by 8 Key Regions, 2024-2029
- 1.1.2. Total Inbound Roaming Revenue
- Figure & Table 1.3: Total Inbound Roaming Revenue ($m), Split by 8 Key Regions, 2024-2029
- Table 1.4: Total Inbound Roaming Revenue ($m), Split by Consumer and IoT, 2024-2029
- 1.1.3. Total Outbound Roaming Subscribers
- Figure & Table 1.5: Total Outbound Roaming Subscribers (m), Split by 8 Key Regions, 2024-2029
- 1.1.4. Total Outbound Retail Roaming Revenue
- Figure & Table 1.6: Total Outbound Retail Roaming Revenue ($m), Split by 8 Key Regions, 2024-2029
2. Wholesale Roaming Consumer Voice, SMS and Data Forecasts
- 2.1. Wholesale Roaming Consumer Voice, SMS and Data Usage
- Figure 2.1: Total Wholesale Roaming Revenue ($m), Split by SMS, Voice and Data Roaming, 2024
- 2.1.1. Data Roaming Forecast Methodology
- 2.1.2. Voice Roaming Forecast Methodology
- 2.1.3. SMS Roaming Forecast Methodology
- Figure 2.2: Consumer Wholesale Roaming Forecast Methodology
- 2.1.4. Total Inbound Mobile Subscribers
- Figure & Table 2.3: Total Inbound Mobile Subscribers (m), Split by 8 Key Regions, 2024-2029
- 2.1.5. Inbound Roaming Subscribers: SMS Revenue
- Figure & Table 2.4: Total Inbound SMS Roaming Revenue ($m), Split by 8 Key Regions, 2024-2029
- 2.1.6. Inbound Roaming Subscribers: Voice Revenue
- Figure & Table 2.5: Total Inbound Voice Roaming Revenue ($m), Split by 8 Key Regions, 2024-2029
- 2.1.7. Inbound Roaming Subscribers: Data Revenue
- Figure & Table 2.6: Total Inbound Data Roaming Revenue ($m), Split by 8 Key Regions, 2024-2029
3. IoT Wholesale Roaming
- 3.1. Wholesale Roaming - IoT Devices and Sensors
- Figure 3.1: Total Cellular IoT Connections (m), Split by 8 Key Regions, 2024-2029
- 3.1.1. Forecast Methodology & Assumptions
- Figure 3.2: IoT Wholesale Roaming Forecast Methodology
- 3.1.2. Total Inbound Roaming IoT Connections
- Figure & Table 3.3: Total Inbound Roaming Cellular IoT Connections (m), Split 8 Key Regions, 2024-2029
- 3.1.3. Total IoT Wholesale Roaming Revenue
- Figure & Table 3.4: Total Inbound Data Roaming Revenue from Cellular IoT Connections ($m), Split by 8 Key Regions, 2024-2029
4. Retail Voice, SMS and Data Roaming Forecasts
- 4.1. Introduction to Voice, SMS and Data Retail Roaming Forecasts
- Figure 4.1: Total Retail Roaming Revenue ($m), Split by Data, Voice, and SMS, 2024
- 4.1.1. Data Roaming Forecast Methodology
- 4.1.2. Voice Roaming Forecast Methodology
- 4.1.3. SMS Roaming Forecast Methodology
- Figure 4.2: Retail Roaming (Data, SMS, and Voice) Forecast Methodology
- 4.1.4. Outbound SMS Roaming Revenue
- Figure & Table 4.3: Total Outbound SMS Roaming Revenue ($m), Split by 8 Key Regions, 2024-2029
- 4.1.5. Outbound Voice Roaming Revenue
- Figure & Table 4.4: Total Outbound Voice Roaming Revenue ($m), Split by 8 Key Regions, 2024-2029
- 4.1.6. Outbound Data Roaming Revenue
- Figure & Table 4.5: Total Outbound Data Roaming Revenue ($m), Split by 8 Key Regions, 2024-2029
5. 4G Retail Roaming
- 5.1. 4G Roaming Forecast Methodology
- 5.1.1. Forecast Methodology & Assumptions
- Figure 5.1: 4G Retail Roaming Forecast Methodology
- 5.1.2. Total Outbound 4G Roaming Subscribers
- Figure & Table 5.2: Total Outbound 4G Roaming Subscribers (m), Split by 8 Key Regions, 2024-2029
- 5.1.3. Total Outbound 4G Voice, SMS & Data Roaming Revenue
- Figure & Table 5.3: Total Outbound 4G Voice, SMS & Data Roaming Revenue ($m), Split by 8 Key Regions, 2024-2029
- 5.1.1. Forecast Methodology & Assumptions
6. 5G Retail Roaming
- 6.1. 5G Roaming Forecast Methodology
- 6.1.1. Forecast Methodology & Assumptions
- Figure 6.1: 5G Retail Roaming Forecast Methodology
- 6.1.2. Total Outbound 5G Roaming Subscribers
- Figure & Table 6.2: Total Outbound 5G Roaming Subscribers (m), Split by 8 Key Regions, 2024-2029
- 6.1.3. Total Outbound 5G Voice, SMS & Data Roaming Revenue
- Figure & Table 6.3: Total Outbound 5G Voice, SMS & Data Roaming Revenue ($m), Split by 8 Key Regions, 2024-2029
- 6.1.1. Forecast Methodology & Assumptions
7. Consumer Devices
- 7.1. Consumer Device Forecast Methodology
- 7.1.1. Forecast Methodology & Assumptions
- Figure 7.1: Consumer Device Forecast Methodology
- 7.1.2. Total Roaming Revenue from Roaming Devices
- Figure & Table 7.2: Total Roaming Revenue from Roaming Devices ($m), Split by 8 Key Regions, 2024-2029
- 7.1.1. Forecast Methodology & Assumptions
8. Cruise Roaming
- 8.1. Cruise Roaming Forecast & Methodology
- 8.1.1. Forecast Methodology & Assumptions
- Figure 8.1: Cruise Roaming Forecast Methodology
- 8.1.2. Total Cruise Roaming Revenue
- Figure & Table 8.2: Total Cruise Roaming Revenue ($m), Split by 8 Key Regions, 2024-2029
- 8.1.1. Forecast Methodology & Assumptions

