


 |
市场调查报告书
商品编码
1719509
智慧交通管理的全球市场:2025-2030年Global Smart Traffic Management Market: 2025-2030 |
||||||
受永续发展和都市化驱动,到 2027 年,智慧交通管理市场规模将达到 200 亿美元
| 主要统计 | |
|---|---|
| 2025年的总收益 | 148亿美元 |
| 2030年的总收益 | 327亿美元 |
| 从2025年~2030年的市场成长率 | 121% |
| 预测期间 | 2025-2030年 |
我们的研究套件对不断发展的智慧交通管理市场提供了详细而深刻的分析,帮助所有利害关係人(从智慧交通管理提供者到监管机构和技术供应商)了解未来成长、关键趋势和竞争格局。该研究包含一项货币化模型分析,评估领先的部署模式,并为私人网路供应商和营运商提供策略建议,以实现收入最大化。此外,研究还包含瞻博网路研究公司的未来领导者指数,该指数检视了挑战主导营运商的新兴智慧交通供应商。
研究套件包含多个可单独购买的选项,包括存取未来五年智慧交通管理市场采用情况和未来成长情况的数据,并按智慧交通技术划分:
|
|
|
该报告还提供了富有洞察力的研究,重点介绍了智慧交通领域的最新趋势和机会。交通管理市场,包括人工智慧和自动化在智慧交通管理解决方案中的应用,以及日益普及的车联网 (V2X) 技术。该技术将车辆与其周围环境连接起来,实现即时交通管理。该报告还对智慧交通管理领域的 15 家市场领导者进行了深入分析。
主要特点
- 关键要点和策略建议:详细分析了智慧交通管理供应商、技术供应商和监管机构的关键发展机会、关键进展和关键策略建议。
- 市场展望:深入分析了智慧交通管理市场的关键推动因素和挑战,重点介绍了整合复杂性和预算限制带来的挑战以及如何克服这些挑战。该报告还分析了智慧交通管理技术的当前和未来趋势,并为智慧交通管理供应商、技术公司和监管机构提供了克服当前市场挑战的策略建议。它还重点介绍了智慧交通管理技术的关键获利机会,例如数据获利。
- 基准产业预测:提供智慧交通管理市场的规模和预测,包括总收入、已部署的智慧交通管理系统总数以及已部署的智慧交通管理感测器总数。该预测进一步按三个技术领域细分了总收入和智慧交通管理系统的部署:智慧交叉路口、智慧停车和智慧高速公路。
- Juniper Research 竞赛排行榜:包括对 15 家领先智慧交通管理供应商的能力评估以及主要参与者的市场规模。
样品
市场趋势·策略PDF报告
样品view
市场资料·预测
市场数据与预测
研究套件包含 82 个表格和超过 37,000 个资料点的全套预测资料。此研究套件包含以下指标:
- 已部署智慧交通管理系统
- 已部署智慧交通管理感测器
- 智慧交通管理效益
- 智慧交通管理系统带来的拥挤和排放成本节省规模
这些指标涵盖以下关键技术:
- 智慧高速公路
- 智慧交叉路口
- 智慧停车
此预测进一步将总体拥塞和排放成本节省细分为:
- 壅塞管理
- 减排
Juniper Research 的互动式预测(Excel)包含以下功能:
- 统计分析:您可以搜寻资料期间所有地区和国家/地区显示的特定指标。图表可以轻鬆修改并汇出到剪贴簿。
- 国家/地区资料工具:您可以查看预测期间内所有地区和国家的指标。搜寻列可缩小显示指标的范围。
- 国家比较工具:您可以选择特定的国家进行比较。该工具支援导出图表。
- 假设分析:透过五个互动式场景,使用者可以将结果与预测假设进行比较。
目录
市场趋势与策略
第1章 重要点和策略性建议
- 重要点
- 策略性建议
第2章 未来市场展望,促进因素,课题
- 未来市场预测
- 促进因素
- 课题
- 趋势
- 技术分析
第3章 经营模式分析
- 经营模式分析
- 部署模型
- 内部部署
- 云端基础
- 边缘基础
- haiburi
- 模组型
- 摘要
- 部署模型
第4章 futurereaders(leaders)目录
- 业者简介
- AISP
- Asura Technologies
- Autilent
- Flow Labs
- GridMatrix
- NoTraffic
- Pushpak AI
- Simplifai Systems
- 评估手法
- 限制与解释
竞争排行榜
第1章 Juniper Research的竞争排行榜
第2章 企业简介
- 业者简介
- AtkinsRealis
- Cubic Corporation
- Huawei Technologies
- IBM
- Indra Group
- INRIX
- Iteris
- Kapsch TrafficCom
- Miovision
- Q-Free
- Thales
- TomTom
- TransCore
- Transoft Solutions
- Umovity
- 评估手法
- 相关调查
资料·预测
第1章 简介·调查手法
第2章 市场概要
- 智慧交通管理系统的整体引进数
- 智慧交通管理的总支出额
第3章 智慧交叉路口
- 整体引进数
- 总支出额
第4章 智慧停车
- 整体引进数
- 总支出额
第5章 智慧高速公路
- 整体引进数
- 总支出额
第6章 混乱管理
- 智慧交通管理系统节省拥挤管理成本
第7章 排放削减
- 智慧交通管理系统节省排放成本
'Smart Traffic Management Market Growth Fuelled by Sustainability & Urbanisation, Reaching $20 Billion by 2027'
| KEY STATISTICS | |
|---|---|
| Total revenue in 2025: | $14.8bn |
| Total revenue in 2030: | $32.7bn |
| 2025 to 2030 market growth: | 121% |
| Forecast period: | 2025-2030 |
Overview
Juniper Research's "Smart Traffic Management" research suite provides a detailed and insightful analysis of this progressing market; enabling stakeholders, from smart traffic management providers to regulators and technology vendors, to understand future growth, key trends and the competitive environment. The market-leading study includes monetisation model analysis that evaluates the key deployment models in the market; providing strategic recommendations for private network vendors and operators to maximise revenue. Additionally, it features Juniper Research's Future Leaders Index, which examines emerging smart traffic vendors who are challenging dominant players in the market. The coverage can also be purchased as a full research suite, containing all these elements and a substantial discount.
The research suite includes several different options that can be purchased separately, including access to data mapping the adoption and future growth of the smart traffic management market over the next five years, split by the following smart traffic technologies:
|
|
|
It also provides an insightful study uncovering the latest trends and opportunities within the smart traffic management market, including the use of AI and automation in smart traffic management solutions and the rising adoption of vehicle-to-everything (V2X) technologies that enable real-time traffic management by connecting vehicles to their surrounding environment. It also features an extensive analysis of the 15 market leaders in the smart traffic management space.
Collectively, these documents provide a critical tool for understanding this fast-evolving market. They allow smart traffic management vendors and operators to shape their future strategy and capitalise on future growth opportunities in digitally transforming regions. This research suite's extensive coverage makes it a valuable tool for navigating this rapidly growing market.
All report content is delivered in the English language.
Key Features
- Key Takeaways & Strategic Recommendations: In-depth analysis of key development opportunities, key findings and key strategic recommendations for smart traffic management vendors, technology vendors and regulators.
- Market Outlook: Insights into key drivers and market challenges within the smart traffic management market, addressing challenges posed by integration complexity and budget constraints and how these can be overcome. It also provides an analysis into the current and future trends in smart traffic management technology, providing strategic recommendations for smart traffic management vendors, technology companies and regulators, to overcome the current market challenges. It highlights the key monetisation opportunities for smart traffic management technologies, including data monetisation.
- Benchmark Industry Forecasts: The market size and forecast for the smart traffic management market, including total revenue, total smart traffic management systems deployed, and total number of deployed smart traffic management sensors. The forecast further breaks down total revenue and smart traffic management systems deployed by the three technology segments (smart intersections, smart parking and smart highways).
- Juniper Research Competitor Leaderboard: Key player capability and capacity assessment for 15 smart traffic management vendors via the Juniper Research Competitor Leaderboard; featuring smart traffic management market size for major players in the smart traffic management industry.
SAMPLE VIEW
Market Trends & Strategies PDF Report
A comprehensive analysis of the current market landscape, alongside strategic recommendations and a walk-through of the forecasts.
SAMPLE VIEW
Market Data & Forecasting
The numbers tell you what's happening, but our written report details why, alongside the methodologies.
Market Trends & Strategies
This report provides a detailed outlook for the market, assessing market trends and the factors shaping the evolution of this growing market. Technological developments, particularly in AI, have led to real-time traffic monitoring capabilities, enhancing traffic flows, increasing road safety, and reducing congestion and emissions from vehicles. It also evaluates challenges posed by older infrastructure and existing systems which have hindered modern solutions adoption, given the cost of enabling these to integrate with existing systems.
This report delivers an insightful analysis of the strategic opportunities for smart traffic management vendors and operators, as well as strategic recommendations to overcome emerging market challenges such as interoperability. It also includes an evaluation of key technology segment opportunities for smart traffic management vendors and operators, highlighting key markets with the highest growth potential.
Market Data & Forecasting
The market-leading research suite for the "Smart Traffic Management" market includes access to the full set of forecast data of 82 tables and over 37,000 datapoints. Metrics in the research suite include:
- Deployed Smart Traffic Management Systems
- Deployed Smart Traffic Management Sensors
- Smart Traffic Management Revenue
- Congestion & Emissions Cost Savings by Smart Traffic Management Systems
These metrics are provided for the following key technologies:
- Smart Highways
- Smart Intersections
- Smart Parking
The forecast further splits the total congestion and emissions cost savings by the following:
- Congestion Management
- Emissions Reduction
Juniper Research Interactive Forecast Excel contains the following functionality:
- Statistics Analysis: Users benefit from the ability to search for specific metrics, displayed for all regions and countries across the data period. Graphs are easily modified and can be exported to the clipboard.
- Country Data Tool: This tool lets users look at metrics for all regions and countries in the forecast period. Users can refine the metrics displayed via a search bar.
- Country Comparison Tool: Users can select and compare specific countries. The ability to export graphs is included in this tool.
- What-if Analysis: Here, users can compare forecast metrics against their own assumptions, via five interactive scenarios.
Competitor Leaderboard Report
The Competitor Leaderboard report provides a detailed evaluation and market positioning for 15 leading vendors in the smart traffic management space. The vendors are positioned as an established leader, leading challenger, or disruptor and challenger based on capacity and capability assessments:
|
|
This document is centred around the Juniper Research Competitor Leaderboard, a vendor positioning tool that provides an at-a-glance view of the competitive landscape in a market, backed by a robust methodology.
Table of Contents
Market Trends & Strategies
1. Key Takeaways and Strategic Recommendations
- 1.1. Key Takeaways
- 1.2. Strategic Recommendations
2. Future Market Outlook, Drivers and Challenges
- 2.1. Future Market Outlook
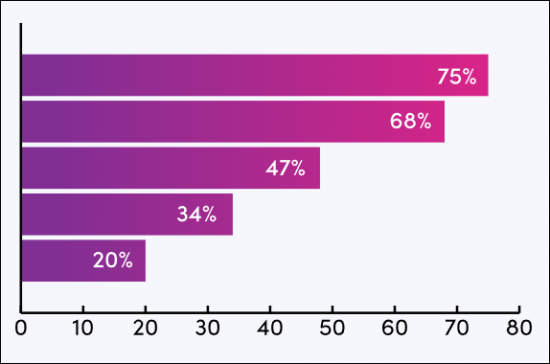
- Figure 2.1: Key Benefits of Smart Traffic Technology
- 2.1.1. Drivers
- i. Urbanisation and Population Growth
- ii. Technological Advancements
- iii. Government Investment
- iv. Environmental and Regulatory Pressures
- Figure 2.2: Total City Vehicle Emissions Cost Savings ($m), Split by 4 Key Countries, 2025-2030
- 2.1.2. Challenges
- i. Budget Constraints
- ii. Interoperability
- iii. Data Privacy and Cybersecurity Concerns
- 2.1.3. Trends
- i. Vehicle-to-Everything Communication
- Figure 2.3: Types of V2X
- ii. Multimodal Traffic Ecosystems
- iii. Connectivity
- i. Vehicle-to-Everything Communication
- 2.1.4. Technology Analysis
- i. Smart Intersections
- Figure 2.4: Total Number of Smart Intersections, Split by 8 Key Regions, 2025-2030
- Figure 2.5: Total Smart Intersection Spend ($m), Split by 5 Key Countries, 2025-2030
- ii. Smart Highways
- Figure 2.6: Total Length of Highways Converted to Smart Highways (km), Split by 8 Key Regions, 2025-2030
- iii. Smart Parking
- Figure 2.7: Total Smart Parking Spend ($m), Split by 8 Key Regions, 2025-2030
- iv. Summary
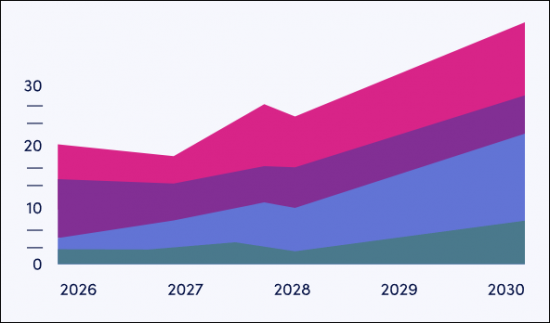
- Figure 2.8: Total Smart Traffic Management Spend ($m), Split by Sector, 2025-2030
- i. Smart Intersections
3. Business Model Analysis
- 3.1. Business Model Analysis
- 3.1.1. Deployment Models
- i. On-premises Deployment
- Table 3.1: Mitigation Strategies for On-premises Deployments
- ii. Cloud-based Deployment
- iii. Edge-based Deployments
- iv. Hybrid Deployments
- v. Modular Deployments
- vi. Summary
- i. On-premises Deployment
- 3.1.1. Deployment Models
4. Future Leaders Index
- 4.1. Why Read This Report
- Figure 4.1: Juniper Research Future Leaders Index: Smart Traffic Management Vendor Solutions
- Figure 4.2: Juniper Research Future Leaders Index: Smart Traffic Management Vendors
- Table 4.3: Juniper Research Smart Traffic Management Vendors Ranking
- Figure 4.4: Juniper Research Future Leaders Index Heatmap: Smart Traffic Management Vendors
- 4.2. Vendor Profiles
- 4.2.1. AISP
- i. Corporate
- ii. Geographical Spread
- iii. Key Clients and Strategic Partnerships
- iv. High-level View of Offerings
- v. Juniper Research's View: Key Strengths & Strategic Opportunities
- 4.2.2. Asura Technologies
- i. Corporate
- ii. Geographical Spread
- iii. Key Clients and Strategic Partnerships
- iv. High-level View of Offerings
- v. Juniper Research's View: Key Strengths & Strategic Opportunities
- 4.2.3. Autilent
- i. Corporate
- ii. Geographical Spread
- iii. Key Clients and Strategic Partnerships
- iv. High-level View of Offerings
- v. Juniper Research's View: Key Strengths & Strategic Opportunities
- 4.2.4. Flow Labs
- i. Corporate
- ii. Geographical Spread
- iii. Key Clients and Strategic Partnerships
- iv. High-level View of Offerings
- v. Juniper Research's View: Key Strengths & Strategic Opportunities
- 4.2.5. GridMatrix
- i. Corporate
- ii. Geographical Spread
- iii. Key Clients and Strategic Partnerships
- iv. High-level View of Offerings
- v. Juniper Research's View: Key Strengths & Strategic Opportunities
- 4.2.6. NoTraffic
- i. Corporate
- ii. Geographical Spread
- iii. Key Clients and Strategic Partnerships
- iv. High-level View of Offerings
- v. Juniper Research's View: Key Strengths & Strategic Opportunities
- 4.2.7. Pushpak AI
- i. Corporate
- ii. Geographical Spread
- iii. Key Clients and Strategic Partnerships
- iv. High-level View of Offerings
- v. Juniper Research's View: Key Strengths & Strategic Opportunities
- 4.2.8. Simplifai Systems
- i. Corporate
- ii. Geographical Spread
- iii. Key Clients and Strategic Partnerships
- iv. High-level View of Offerings
- v. Juniper Research's View: Key Strengths & Strategic Opportunities
- 4.2.1. AISP
- 4.3. Juniper Research Future Leaders Index Assessment Methodology
- 4.4. Limitations & Interpretations
- Figure 4.5: Juniper Research Future Leaders Index: Smart Traffic Management Services Criteria
Competitor Leaderboard
1. Juniper Research Competitor Leaderboard
- Why Read this Report
- Table 1.1: Juniper Research Competitor Leaderboard: Smart Traffic Management Providers: Product & Portfolio (Part 1)
- Table 1.1: Juniper Research Competitor Leaderboard: Smart Traffic Management Providers: Product & Portfolio (Part 2)
- Figure 1.2: Juniper Research Competitor Leaderboard: Smart Traffic Management Vendors
- Source: Juniper Research
- Table 1.3: Juniper Research Competitor Leaderboard: Vendor & Position
- Figure 1.4: Juniper Research Competitor Leaderboard Heatmap: Smart Traffic Management Vendors
2. Company Profiles
- 2.1. Vendor Profiles
- 2.1.1. AtkinsRealis
- i. Corporate Information
- Table 2.1: AtkinsRealis's Financial Summary ($m), 2022-2023
- ii. Geographical Spread
- iii. Key Clients & Strategic Partnerships
- iv. High-level View of Offerings
- v. Juniper Research's View: Key Strengths & Strategic Development Opportunities
- i. Corporate Information
- 2.1.2. Cubic Corporation
- i. Corporate Information
- ii. Geographical Spread
- iii. Key Clients & Strategic Partnerships
- iv. High-level View of Offerings
- v. Juniper Research's View: Key Strengths & Strategic Development Opportunities
- 2.1.3. Huawei Technologies
- i. Corporate Information
- Table 2.2: Huawei's Financial Information ($m), 2023-2024
- ii. Geographical Spread
- iii. Key Clients & Strategic Partnerships
- iv. High-level View of Offerings
- Figure 2.3: Diagram of Huawei's Intelligent Transportation System
- v. Juniper Research's View: Key Strengths & Strategic Development Opportunities
- i. Corporate Information
- 2.1.4. IBM
- i. Corporate Information
- Table 2.4: IBM's Financial Summary ($m), 2023-2024
- ii. Geographical Spread
- iii. Key Clients & Strategic Partnerships
- iv. High-level View of Offerings
- v. Juniper Research's View: Key Strengths & Strategic Development Opportunities
- i. Corporate Information
- 2.1.5. Indra Group
- i. Corporate Information
- Table 2.5: Indra's Financial Summary ($m), 2023-2024
- ii. Geographical Spread
- iii. Key Clients & Strategic Partnerships
- iv. High-level View of Offerings
- v. Juniper Research's View: Key Strengths & Strategic Development Opportunities
- i. Corporate Information
- 2.1.6. INRIX
- i. Corporate Information
- ii. Geographical Spread
- iii. Key Clients & Strategic Partnerships
- iv. High-level View of Offerings
- v. Juniper Research's View: Key Strengths & Strategic Development Opportunities
- 2.1.7. Iteris
- i. Corporate
- Table 2.6: Iteris's Financial Summary ($m), 2023-2024
- ii. Geographical Spread
- iii. Key Clients & Strategic Partnerships
- iv. High-level View of Offerings
- Figure 2.7: Diagram of Iteris's ClearMobility Platform
- v. Juniper Research's View: Key Strengths & Strategic Development Opportunities
- i. Corporate
- 2.1.8. Kapsch TrafficCom
- i. Corporate Information
- Table 2.8: Kapsch TrafficCom's Financial Summary ($m), 2023-2024
- ii. Geographical Spread
- iii. Key Clients & Strategic Partnerships
- iv. High-level View of Offerings
- v. Juniper Research's View: Key Strengths & Strategic Development Opportunities
- i. Corporate Information
- 2.1.9. Miovision
- i. Corporate
- ii. Geographical Spread
- iii. Key Clients & Strategic Partnerships
- iv. High-level View of Offerings
- v. Juniper Research's View: Key Strengths & Strategic Development Opportunities
- 2.1.10. Q-Free
- i. Corporate
- ii. Geographical Spread
- iii. Key Clients & Strategic Partnerships
- iv. High-level View of Offerings
- v. Juniper Research's View: Key Strengths & Strategic Development Opportunities
- 2.1.11. Thales
- i. Corporate Information
- Table 2.9: Thales's Financial Summary ($m), 2023-2024
- ii. Geographical Spread
- iii. Key Clients & Strategic Partnerships
- iv. High-level View of Offerings
- v. Juniper Research's View: Key Strengths & Strategic Development Opportunities
- i. Corporate Information
- 2.1.12. TomTom
- i. Corporate Information
- Table 2.10: TomTom's Financial Summary ($m), 2023-2024
- ii. Geographical Spread
- iii. Key Clients & Strategic Partnerships
- iv. High-level View of Offerings
- v. Juniper Research's View: Key Strengths & Strategic Development Opportunities
- i. Corporate Information
- 2.1.13. TransCore
- i. Corporate Information
- ii. Geographical Spread
- iii. Key Clients & Strategic Partnerships
- iv. High-level View of Offerings
- v. Juniper Research's View: Key Strengths & Strategic Development Opportunities
- 2.1.14. Transoft Solutions
- i. Corporate Information
- ii. Geographical Spread
- iii. Key Clients and Strategic Partnerships
- iv. High-level View of Offerings
- v. Juniper Research's View: Key Strengths & Strategic Development Opportunities
- 2.1.15. Umovity
- i. Corporate Information
- ii. Geographical Spread
- iii. Key Clients & Strategic Partnerships
- iv. High-level View of Offerings
- v. Juniper Research's View: Key Strengths & Strategic Development Opportunities
- 2.1.1. AtkinsRealis
- 2.2. Juniper Research Leaderboard Assessment Methodology
- 2.2.1. Limitation & Interpretations
- Table 2.11: Juniper Research Competitor Leaderboard Scoring Criteria: Smart Traffic Management Vendors
- 2.2.1. Limitation & Interpretations
- 2.3. Related Research
Data & Forecasting
1. Introduction and Methodology
- 1.1. Smart Traffic Management Market Summary and Future Outlook
- 1.2. Forecast Methodology
- Figure 1.1: Smart Intersections Methodology
- Figure 1.2: Smart Parking Methodology
- Figure 1.3: Smart Highway Forecast Methodology
- Figure 1.4: Congestion Management Forecast Methodology
- Figure 1.5: Emissions Reduction Forecast Methodology
2. Market Overview
- 2.1. Total Number of Deployed Smart Traffic Management Systems
- Figure and Table 2.1: Total Number of Deployed Smart Traffic Management Systems (m), Split by 8 Key Regions, 2025-2030
- 2.2. Total Smart Traffic Management Spend
- Figure and Table 2.2: Total Smart Traffic Management Spend ($m), Split by 8 Key Regions, 2025-2030
3. Smart Intersections
- 3.1. Total Number of Smart Intersections
- Figure and Table 3.1: Total Number of Smart Traffic Intersections (m), Split by 8 Key Regions, 2025-2030
- 3.1.1. Total Smart Intersection Spend
- Figure and Table 3.2: Total Smart Intersection Spend ($m), Split by 8 Key Regions, 2025-2030
4. Smart Parking
- 4.1. Total Number of Smart Parking Spaces
- Figure and Table 4.1: Total Smart Parking Spaces (m), Split by 8 Key Regions, 2025-2030
- 4.2. Total Smart Parking Spend
- Figure and Table 4.2: Total Smart Parking Spend ($m), Split by 8 Key Regions, 2025-2030
5. Smart Highways
- 5.1. Total Length of Highways Converted to Smart Highways
- Figure and Table 5.1: Total Length of Highways Converted to Smart Highways (km), Split by 8 Key Regions, 2025-2030
- 5.2. Total Smart Highway Spend
- Figure and Table 5.2: Total Smart Highway Spend ($m), Split by 8 Key Regions, 2025-2030
6. Congestion Management
- 6.1. Total Cost of Congestion Saved by Smart Traffic Management Systems
- Figure and Table 6.1: Total Cost of Congestion Saved by Smart Traffic Management Systems ($m), Split by 8 Key Regions, 2025-2030
7. Emissions Reduction
- 7.1. Total City Vehicle Emissions Cost Savings
- Figure and Table 7.1: Total City Vehicle Emissions Cost Savings ($m), Split by 8 Key Regions, 2025-2030
 交通管理市场:按组件、技术、应用、最终用户和部署模式划分-2026-2032年全球市场预测
 智慧交通管理系统市场预测至2034年-按解决方案、技术、最终用户和区域分類的全球分析智慧交通管理与物联网赋能道路市场预测:至2034年-按组件、部署模式、技术、应用和区域分類的全球分析智慧交通号誌市场按组件、连接方式、应用、安装和最终用户划分,全球预测(2026-2032年)
 交通管理市场分析及预测(至2035年):依类型、产品类型、服务、技术、组件、应用、设备、部署类型、最终用户及解决方案划分
 运输管理系统市场机会、成长要素、产业趋势分析及预测(2026-2035年)
 交通管理市场规模、份额和成长分析(按组件、系统、应用和地区划分)—产业预测(2026-2033 年)交通管理市场预测至2032年:按组件、系统、部署模式、应用、最终用户和区域分類的全球分析
 智慧交通管理系统市场-全球产业规模、份额、趋势、机会和预测(按组件、按解决方案类型、按应用、按地区和按竞争划分,2020 年至 2030 年)
 交通管理市场按产品、应用领域、最终用户和地区划分 - 预测至 2029 年