


 |
市场调查报告书
商品编码
1730125
mPOS终端及软体POS的全球市场:2025-2030年Global mPOS Terminals & Soft POS Market: 2025-2030 |
||||||
"到2030年,软POS交易量将以2150%的成长率成长:重新定义小型企业的行动交易"
| 主要统计 | |
|---|---|
| 2030年的mPOS终端的整体交易额: | 49亿美元 |
| 2030年的软体POS终端的整体交易额: | 5,400亿美元 |
| 从2025年开始2030年的软体POS市场成长率: | 2,150% |
| 预测期间: | 2025-2030年 |
概述
我们的研究套件提供了详细而深刻的分析mPOS 终端和软 POS 市场,使 POS 硬体製造商、支付基础设施提供商、软体开发商、酒店和零售商等利益相关者能够了解未来成长、关键趋势和竞争格局。
我们的套件包含映射 POS 未来成长的数据、揭示市场最新趋势和机会的直观研究,以及对 mPOS 终端机和软 POS 领域 27 家市场领导者进行深入分析的文檔。其无与伦比的全面性使我们的研究套件成为规划如此高成长市场未来发展方向的极其有用的资源。
主要特点
- 市场动态:我们提供对市场格局的深入洞察,分析各种形式的 POS 及其具体用例。它还评估了软 POS 对 mPOS 的威胁,以及智慧型 POS 系统内建的增强功能如何帮助缓解这一威胁。报告包含细分分析,分析了mPOS终端和软POS在六个不同产业领域面临的机会和课题。报告最后提供了一个国家就绪指数,用于识别mPOS和软POS供应商的高成长市场和潜在区域。
- 关键要点和策略建议:详细分析POS市场的关键发展机会和关键发现,并为利害关係人提供重要的策略建议。
- 基准产业预测:POS采用和使用情况的五年市场预测,包括六种不同类型POS(专用POS、非接触式POS、mPOS、生物辨识POS、智慧型POS和软POS)的安装基数、交易量和交易额的细分。该预测还包括POS软体系统的采用情况和收入。
- Juniper Research竞争力排行榜:对27家领先POS供应商的能力进行评估。
样品view
市场资料&预测报告
样品
市场趋势·策略报告
市场数据与预测报告
我们市场领先的 POS 终端市场研究套件包含 101 个完整表格以及超过 46,000 个数据点的预测数据。此研究套件包含以下指标:
- POS 终端机组装机量
- POS 交易笔数
- POS 交易总金额
这些指标涵盖以下主要市场:
- 专用 POS
- 非接触式 POS
- 行动 POS
- 生物辨识 POS
- 智慧型 POS
- 软体 POS
Juniper Research 的互动式预测 (Excel) 包含以下功能:
- 统计分析:显示资料期间所有地区和国家的数据,并允许您搜寻特定指标。图表可以轻鬆修改并汇出到剪贴簿。
- 国家/地区资料工具:此工具可让您查看预测期间内所有地区和国家的指标。您可以在搜寻栏中缩小显示的指标范围。
- 国家比较工具:您可以选择要比较的国家。此工具包含汇出图表的功能。
- 假设分析:五个互动式场景可让您将预测指标与您自己的假设进行比较。
市场趋势与策略报告
本报告深入研究了mPOS终端和软POS市场的趋势,并评估了影响这一快速成长市场发展的市场趋势和因素。它全面分析了mPOS终端和软POS供应商的策略机遇,重点介绍了关键的垂直产业和发展课题,以及利害关係人应如何应对这些课题。
目录
市场趋势与策略
第1章 重要点·策略性建议
- 重要点
- 策略性建议
第2章 市场摘要
- 简介
- 定义和范围
- 专用POS
- mPOS
- 非接触POS
- 智慧POS
- 生物识别POS
- 脸扫描
- 指纹辨识
- 手掌认识
- 新的生物识别
- 虹膜
- 视网膜
- 静脉模式认识
- 生物识别的课题
- 安全与隐私问题
- 实施课题
- 使用者体验问题
- 营运与财务障碍
- 软体POS
- 各种POS机用例
- 推动因素与阻碍因素
- 替代性无现金社会
- 生物辨识POS机市场
- 消费者购买行为的演变
- 增强功能
- 智慧型POS机:应对日益激烈的竞争的解决方案
- 软体POS
- 简介
- 市场版图
- 专用POS机和行动POS机面临的威胁
- 软POS机面临的课题
- 未来展望
第3章 市场区隔分析
- 市场区隔分析的形势
- 饭店与餐饮
- 旅游与交通
- 速食店
- 加油站与无人驾驶
- 小型企业与专业服务
- 活动与体育场馆
第4章 各国准备指数与地区分析
- 各国准备指数
- 关注市场
- 成长市场
- 新兴国家市场
- 饱和市场
竞争排行榜
第一章:Juniper Research POS 终端机竞争排行榜
第2章 mPOS:竞争排行榜
- mPOS业者简介
- Epos Now
- Fiserv
- Global Payments
- Lightspeed
- Mswipe
- NEXGO
- Newland NPT
- PAX
- PayPal
- Posiflex
- Square (Block)
- SumUp
- Toast
- Verifone
- Worldline
- 评估手法
- 限制与解释
第3章 软体POS竞争的排行榜
- 软体POS供应商的简介
- alcineo
- Apple
- CM.com
- Fiserv
- MagicCube
- Mypinpad
- Paypal
- Payten
- Square
- Stripe
- Tidypay
- Wizzit
- Worldline
- Worldpay
- 调查手法
- 评估手法
- 限制与解释
- 相关调查
资料与预测
第1章 市场预测
第2章 市场摘要
- POS终端市场
- 用户数(装置量)
- 交易数
- 交易额
第3章 非接触POS
- 用户数(装置量)
- 交易数
- 交易额
第4章 mPOS
- 用户数(装置量)
- 交易额
第5章 软体POS
- 用户数(装置量)
- 交易数
- 交易额
'Soft POS Transactions to Accelerate by 2,150% in Value by 2030; Redefining On-the-go Transactions for Small Businesses'
| KEY STATISTICS | |
|---|---|
| Total mPOS terminal transaction value in 2030: | $4.9tn |
| Total soft POS terminal transaction value in 2030: | $540 bn |
| 2025 to 2030 soft POS market growth: | 2150% |
| Forecast period: | 2025-2030 |
Overview
Our "mPOS Terminals & Soft POS" market research suite provides detailed and insightful analysis of this evolving market; enabling stakeholders, from POS hardware manufacturers, payment infrastructure providers, software developers, and hospitality and retail vendors, to understand future growth, key trends and the competitive environment.
The suite includes several different options that can be purchased separately, including access to data mapping the future growth of POS, an intuitive study uncovering the latest trends and opportunities within the market, and a document containing extensive analysis of the 27 market leaders within the mPOS terminals & soft POS space. The coverage can also be purchased as a Full Research Suite, containing all these elements, and including a substantial discount.
Collectively, they provide a critical tool for understanding this rapidly emerging market; allowing POS manufacturers and technology vendors to shape their future strategy. Its unparalleled coverage makes this research suite an incredibly useful resource for charting the future of such a high-growth market.
All report content is delivered in the English language.
Key Features
- Market Dynamics: Extensive insight into the market landscape; analysing the various forms of POS and their specific use cases. This section also assesses the threat that soft POS poses to mPOS, as well as how the enhanced features embedded within smart POS systems can help alleviate this threat. The report includes a segment analysis which looks at the opportunities and challenges faced by mPOS terminals and soft POS across six distinct industry segments. This document concludes with a Country Readiness Index, which identifies high-growth markets and potential regions for mPOS & soft POS vendors.
- Key Takeaways & Strategic Recommendations: In-depth analysis of key development opportunities and key findings within the POS market, accompanied by key strategic recommendations for stakeholders.
- Benchmark Industry Forecasts: 5-year market forecasts for POS adoption and use, including a breakdown of the installed base, transaction volume, and transaction value for the six different types of POS: dedicated POS, contactless POS, mPOS, biometric POS, smart POS and soft POS. The forecast also contains adoption and revenue for POS software systems.
- Juniper Research Competitor Leaderboard: Key player capability and capacity assessment for 27 POS vendors, via two Juniper Research Competitor Leaderboard; separating mPOS and soft POS.
SAMPLE VIEW
Market Data & Forecasting Report
The numbers tell you what's happening, but our written report details why, alongside the methodologies.
Pic.SAMPLE VIEW
Market Trends & Strategies Report
A comprehensive analysis of the current market landscape, alongside strategic recommendations.
Market Data & Forecasting Report
The market-leading research suite for the POS Terminals market includes access to the full set of forecast data of 101 tables and over 46,000 datapoints. Metrics in the research suite include:
- Total POS Terminals Installed Base
- Total POS Transaction Volume
- Total POS Transaction Value
These metrics are provided for the following key market verticals:
- Dedicated POS
- Contactless POS
- mPOS
- Biometric POS
- Smart POS
- Soft POS
Juniper Research Interactive Forecast Excel contains the following functionality:
- Statistics Analysis: Users benefit from the ability to search for specific metrics, displayed for all regions and countries across the data period. Graphs are easily modified and can be exported to the clipboard.
- Country Data Tool: This tool lets users look at metrics for all regions and countries in the forecast period. Users can refine the metrics displayed via a search bar.
- Country Comparison Tool: Users can select countries and compare countries. The ability to export graphs is included in this tool.
- What-if Analysis: Here, users can compare forecast metrics against their own assumptions, featuring 5 interactive scenarios.
Market Trends & Strategies Report
This report examines the "mPOS Terminals & Soft POS" market landscape in detail; assessing market trends and factors shaping the evolution of this rapidly growing market. The report delivers comprehensive analysis of the strategic opportunities for mPOS terminals & soft POS vendors; addressing key verticals and developing challenges, and how stakeholders should navigate these. It also includes evaluation of key country-level opportunities for POS vendors.
Competitor Leaderboard Report
The Competitor Leaderboard report provides a detailed evaluation and market positioning for 27 leading vendors in the "mPOS Terminals & Soft POS" space split into two Competitor Leaderboards, one for traditional and one for soft POS. The vendors are positioned either as an established leader, leading challenger, or disruptor and challenger, based on capacity and capability assessments.
Juniper Research Competitor Leaderboard for mPOS:
|
|
Juniper Research Competitor Leaderboard for soft POS:
|
|
This document is centred around the Juniper Research Competitor Leaderboard; a vendor positioning tool that provides an at-a-glance view of the competitive landscape in a market, backed by a robust methodology.
Table of Contents
Market Trends & Strategies
1. Key Takeaways & Strategic Recommendations
- 1.1. Key Takeaways
- 1.2. Strategic Recommendations
2. Market Summary
- 2.1. Introduction
- 2.1.1. Definitions and Scope
- Figure 2.1: Types of POS
- 2.1.2. Dedicated POS
- 2.1.3. mPOS
- 2.1.4. Contactless POS
- Figure 2.2: Different POS Technologies
- 2.1.5. Smart POS
- Figure 2.3: Smart POS
- 2.1.6. Biometric POS
- Figure 2.4: Biometric POS Scanning Capabilities
- i. Face Scanning
- ii. Fingerprint Recognition
- iii. Palm Recognition
- 2.1.7. Emerging Biometrics
- i. Iris
- ii. Retina
- iii. Vein Pattern Recognition
- 2.1.8. Biometrics Challenges
- i. Security and Privacy Concerns
- ii. Implementation Challenges
- iii. User Experience Issues
- iv. Operational and Financial Barriers
- 2.1.9. Soft POS
- Figure 2.5: How to Use Soft POS
- 2.1.1. Definitions and Scope
- 2.2. Use Cases for Various POS
- 2.2.1. Superstores and Large Retailers
- i. QR Codes
- 2.2.2. Small Sum Fixed Point Transaction Environments
- 2.2.3. Mobile Retail Environments
- 2.2.1. Superstores and Large Retailers
- 2.3. Drivers and Constraints
- 2.3.1. Alternative Cashless Society
- 2.3.2. Biometric POS Markets
- 2.3.3. Evolving Consumer Shopping Behaviour
- 2.3.4. Enhanced Features
- 2.3.5. Smart POS: The Solution to Increasing Competition
- Figure 2.6: Smart POS Business Integrations
- i. Inventory Management
- ii. CRM and Loyalty Programmes
- iii. eCommerce Integration
- iv. Employee Management
- v. Data and Analytics
- vi. Integrated Payment Processing
- 2.4. Soft POS
- i. Introduction
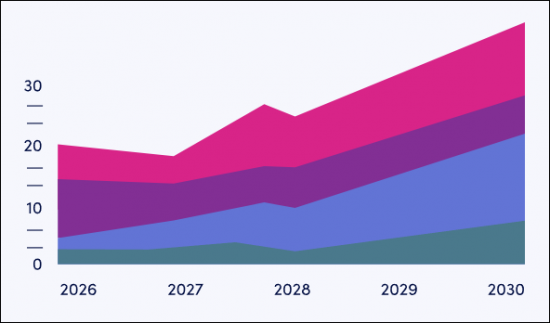
- Figure 2.7: Global Soft POS Transaction Volume ($m), Split by 8 Key Regions, 2025-2030
- 2.4.2. Market Landscape
- 2.4.3. Threat to Dedicated POS and Mobile POS
- 2.4.4. Challenges Facing Soft POS
- 2.4.5. Future Outlook
- i. Introduction
3. Segment Analysis
- 3.1. Segment Analysis Landscape
- Figure 3.1: POS Terminals' Key Leading and High-potential Industry Segments
- 3.1.1. Hospitality & Dining
- i. Opportunities
- ii. Challenges
- 3.1.2. Travel & Transportation
- i. Opportunities
- ii. Challenges
- 3.1.3. Quick-service Restaurants
- i. Opportunities
- ii. Challenges
- 3.1.4. Fuel & Unattended
- i. Opportunities
- ii. Challenges
- 3.1.5. SMEs & Professional Services
- i. Opportunities
- ii. Challenges
- 3.1.6. Events & Stadiums
- i. Opportunities
- ii. Challenges
4. Country Readiness Index & Regional Analysis
- 4.1.1. Country Readiness Index
- Figure 4.1: Juniper Research's 8 Key Regions
- Table 4.2: Juniper Research mPOS Terminals & Soft POS Market Country Readiness Index: Scoring Criteria
- Figure 4.3: Juniper Research mPOS Terminals & Soft POS Market Country Readiness Index
- Figure 4.4: Juniper Research mPOS Terminals & Soft POS Country Readiness Index: Market Segments
- 4.1.2. Focus Markets
- i. eCommerce and Omnichannel Retail Expansion
- ii. Regulatory Support and Fintech Innovation
- Figure 4.5: Total Transaction Value of Soft POS Systems ($m), Focus Markets, 2025-2030
- 4.1.3. Growth Markets
- Figure 4.6: Total mPOS Transactions per annum ($m), Growth Markets, 2025-2030
- i. Contactless Payment Surge
- ii. Government Initiatives
- 4.1.4. Developing Markets
- i. Mobile-first Solutions for Informal Economies
- ii. Cost-efficiency and Flexibility for Merchants
- Figure 4.7: Total mPOS Transactions per annum ($m), Developing Markets, 2025-2030
- 4.1.5. Saturated Markets
- Figure 4.8: Total mPOS Transaction Value per annum ($m), Saturated Markets, 2025-2030
- i. Hardware Dependency
- ii. Security and Certification Hurdles
- Figure 4.9: Juniper Research mPOS Terminals & Soft POS Market Country
- Readiness Index Heatmap: North America
- Figure 4.10: Juniper Research mPOS Terminals & Soft POS Market Country
- Readiness Index Heatmap: Latin America
- Figure 4.11: Juniper Research mPOS Terminals & Soft POS Market Country
- Readiness Index Heatmap: West Europe
- Figure 4.12: Juniper Research mPOS Terminals & Soft POS Market Country
- Readiness Index Heatmap: Central & East Europe
- Figure 4.13: Juniper Research mPOS Terminals & Soft POS Market Country
- Readiness Index Heatmap: Far East & China
- Figure 4.14: Juniper Research mPOS Terminals & Soft POS Market Country
- Readiness Index Heatmap: Indian Subcontinent
- Figure 4.15: Juniper Research mPOS Terminals & Soft POS Market Country
- Readiness Index Heatmap: Rest of Asia Pacific
- Figure 4.16: Juniper Research mPOS Terminals & Soft POS Market Country
- Readiness Index Heatmap: Africa & Middle East
Competitor Leaderboard
1. Juniper Research POS Terminals Competitor Leaderboards
- 1.1. Why Read This Report
- 1.2. Key mPOS & Soft POS Market Takeaways
2. mPOS Competitor Leaderboard
- Figure 2.1: Juniper Research Competitor Leaderboard mPOS Vendors Included & Product Portfolio
- Figure 2.2: Juniper Research Competitor Leaderboard for mPOS Terminals Vendors
- Table 2.3: Juniper Research Competitor Leaderboard: mPOS Terminals Vendors & Positioning
- Table 2.4: Juniper Research Competitor Leaderboard for mPOS Terminals: Heatmap
- 2.1. mPOS Vendor Profiles
- 2.1.1. Epos Now
- i. Corporate
- ii. Geographical Spread
- iii. Key Clients and Strategic Developments
- iv. High-level View of Offerings
- v. Juniper Research's View: Key Strengths & Strategic Development Opportunities
- 2.1.2. Fiserv
- i. Corporate
- Figure 2.5: Fiserv's Financial Snapshot ($m), 2022-2024
- ii. Geographical Spread
- iii. Key Clients & Strategic Partnerships
- iv. High-level View of Offerings
- v. Juniper Research's View: Key Strengths & Strategic Development Opportunities
- i. Corporate
- 2.1.3. Global Payments
- i. Corporate
- Figure 2.6: Global Payments' Financial Snapshot ($m), 2022-2024
- ii. Geographical Spread
- iii. Key Clients & Strategic Partnerships
- iv. High-level View of Offerings
- v. Juniper Research's View: Key Strengths & Strategic Development Opportunities
- i. Corporate
- 2.1.4. Lightspeed
- i. Corporate
- Figure 2.7: Lightspeed Financial Snapshot ($m), 2022-2024
- ii. Geographical Spread
- iii. Key Clients & Strategic Partnerships
- iv. High-level View of Offerings
- v. Juniper Research's View: Key Strengths & Strategic Development Opportunities
- i. Corporate
- 2.1.5. Mswipe
- i. Corporate
- ii. Geographical Reach
- iii. Key Clients & Strategic Partnerships
- iv. High-level View of Offerings
- v. Juniper Research's View: Key Strengths & Strategic Development Opportunities
- 2.1.6. NEXGO
- i. Corporate
- ii. Geographical Reach
- iii. Key Clients & Strategic Partnerships
- iv. High-level View of Offerings
- v. Juniper Research's View: Key Strengths & Strategic Development Opportunities
- 2.1.7. Newland NPT
- i. Corporate
- ii. Geographical Spread
- iii. Key Clients & Strategic Partnerships
- iv. High-level View of Offerings
- v. Juniper Research's View: Key Strengths & Strategic Development Opportunities
- 2.1.8. PAX
- i. Corporate
- Table 2.8: PAX's Financial Snapshot ($m), 2022-2024
- ii. Geographical Reach
- iii. Key Clients & Strategic Partnerships
- iv. High-level View of Offerings
- v. Juniper Research's View: Key Strengths & Strategic Development Opportunities
- i. Corporate
- 2.1.9. PayPal
- i. Corporate
- Table 2.9: Notable PayPal Acquisitions Summary ($m)
- ii. Geographical Spread
- iii. Key Clients & Strategic Partnerships
- iv. High-level View of Offerings
- v. Juniper Research's View: Key Strengths & Strategic Development Opportunities
- i. Corporate
- 2.1.10. Posiflex
- i. Corporate
- Figure 2.10: Posiflex's Financial Snapshot ($m), 2021-2023, Converted from TWD
- ii. Geographical Spread
- iii. Key Clients & Strategic Partnerships
- iv. High-level View of Offerings
- v. Juniper Research's View: Key Strengths & Strategic Development Opportunities
- i. Corporate
- 2.1.11. Square (Block)
- i. Corporate
- ii. Geographical Reach
- iii. Key Clients & Strategic Partnerships
- iv. High-level View of Offerings
- v. Juniper Research's View: Key Strengths & Strategic Development Opportunities
- 2.1.12. SumUp
- i. Corporate
- ii. Geographical Spread
- iii. Key Clients & Strategic Partnerships
- iv. High-level View of Offerings
- v. Juniper Research's View: Key Strengths & Strategic Development Opportunities
- 2.1.13. Toast
- i. Corporate
- Table 2.11: Toast's Investment Rounds ($m), 2015-2020
- ii. Geographical Reach
- iii. Key Clients & Strategic Partnerships
- iv. High-level View of Offerings
- v. Juniper Research's View: Key Strengths & Strategic Development Opportunities
- i. Corporate
- 2.1.14. Verifone
- i. Corporate
- ii. Geographical Spread
- iii. Key Clients & Strategic Partnerships
- iv. High-level View of Offerings
- v. Juniper Research's View: Key Strengths & Strategic Development Opportunities
- 2.1.15. Worldline
- i. Corporate
- ii. Geographical Reach
- iii. Key Clients & Strategic Partnerships
- iv. High-level View of Offerings
- v. Juniper Research's View: Key Strengths and Strategic Development Opportunities
- 2.1.1. Epos Now
- 2.2. Juniper Research Competitor Leaderboard Assessment Methodology
- 2.3. Limitations & Interpretation
- Figure 2.12: Juniper Research mPOS Competitor Leaderboard
3. Soft POS Competitor Leaderboard
- Figure 3.1: Juniper Research Competitor Leaderboard Soft POS Vendors Included & Product Portfolio
- Figure 3.2: Juniper Research Competitor Leaderboard for Soft POS Vendors
- Table 3.3: Juniper Research Competitor Leaderboard: Soft POS Vendors & Positioning
- Table 3.4: Juniper Research Competitor Leaderboard for Soft POS: Heatmap
- 3.1. Soft POS Vendor Profiles
- 3.1.1. alcineo
- i. Corporate
- ii. Geographical Spread
- iii. Key Clients & Strategic Partnerships
- iv. High-level View of Offerings
- Figure 3.5: alcineo Technology Architecture
- v. Juniper Research's View: Key Strengths & Strategic Development Opportunities
- 3.1.2. Apple
- i. Corporate
- Table 3.6: Apple's Financial Snapshot, $m, FY 2022-2024
- ii. Geographical Spread
- iii. Key Clients & Strategic Partnerships
- iv. High-level View of Offerings
- v. Juniper Research's View: Key Strengths & Strategic Development Opportunities
- i. Corporate
- 3.1.3. CM.com
- i. Corporate
- Figure 3.7: CM.com Financial Snapshot ($m), 2022-2024 (Converted from Euro-1 @1.10)
- ii. Geographical Spread
- iii. Key Clients & Strategic Developments
- iv. High-level View of Offering
- v. Juniper Research's View: Key Strengths & Strategic Development
- i. Corporate
- 3.1.4. Fiserv
- i. Corporate
- Figure 3.8: Fiserv Financial Snapshot ($m), 2022-2024
- ii. Geographical Spread
- iii. Key Clients & Strategic Partnerships
- iv. High-Level View of Offerings
- v. Juniper Research's View: Key Strengths & Strategic Development
- i. Corporate
- 3.1.5. MagicCube
- i. Corporate
- Table 3.9: MagicCube Investment Rounds ($m), 2015-2021
- ii. Geographical Reach
- iii. Key Clients & Strategic Developments
- iv. High-level View of Offering
- v. Juniper Research's View: Key Strengths & Strategic Development
- i. Corporate
- 3.1.6. Mypinpad
- i. Corporate
- ii. Geographical Reach
- iii. Key Clients & Strategic Developments
- iv. High-level View of Offering
- v. Juniper Research's View: Key Strengths & Strategic Development
- 3.1.7. Paypal
- i. Corporate
- Table 3.10: Notable PayPal Acquisitions Summary ($m)
- ii. Geographical Spread
- iii. Key Clients & Strategic Partnerships
- iv. High-level View of Offerings
- v. Juniper Research's View: Key Strengths & Strategic Development Opportunities
- i. Corporate
- 3.1.8. Payten
- i. Corporate
- ii. Geographical Reach
- iii. Key Clients & Strategic Developments
- iv. High-level View of Offering
- v. Juniper Research's View: Key Strengths and Strategic Development
- 3.1.9. Square
- i. Corporate
- ii. Geographical Reach
- iii. Key Clients & Strategic Developments
- iv. High-level View of Offering
- v. Juniper Research's View: Key Strengths and Strategic Development
- 3.1.10. Stripe
- i. Corporate
- ii. Geographic Spread
- iii. Key Clients & Strategic Partnerships
- iv. High-level View of Offerings
- v. Juniper Research's View: Key Strengths and Strategic Development
- 3.1.11. Tidypay
- i. Corporate
- ii. Geographical Spread
- iii. Key Clients & Strategic Partnerships
- iv. High-Level View of Offerings
- v. Juniper Research's View: Key Strengths & Strategic Development Opportunities
- Figure 3.11: Viva.com Soft POS Terminal App Overview
- v. Juniper Research's View: Key Strengths & Strategic Development Opportunities
- 3.1.13. Wizzit
- i. Corporate
- ii. Geographical Spread
- iii. Key Clients & Strategic Partnerships
- iv. High-Level View of Offerings
- v. Juniper Research's View: Key Strengths & Strategic Development Opportunities
- 3.1.14. Worldline
- i. Corporate
- ii. Geographical Reach
- iii. Key Clients & Strategic Developments
- iv. High-level View of Offering
- v. Juniper Research's View: Key Strengths & Strategic Development Opportunities
- 3.1.15. Worldpay
- i. Corporate
- ii. Geographical Spread
- iii. Key Clients & Strategic Partnerships
- iv. High-Level View of Offerings
- v. Juniper Research's View: Key Strengths & Strategic Development Opportunities
- 3.1.1. alcineo
- 3.2. Methodology
- Table 3.12: Juniper Research Competitor Leaderboard Soft POS Methodology
- 3.3. Juniper Research Competitor Leaderboard Assessment Methodology
- 3.4. Limitations & Interpretation
- 3.5. Related Research
- Endnotes
Data & Forecasting
1. Market Forecasts
- 1.1. Introduction
- 1.2. Methodology & Assumptions
- Figure 1.1: POS Terminal Market Forecast Methodology
2. Market Summary
- 2.1. POS Terminals Market
- 2.1.1. POS Terminals Installed Base
- Figure & Table 2.1: Global POS Installed Base (m), Split by 8 Key Regions, 2025-2030
- Figure 2.2: North America - Proportion of mPOS in Use That Are Smart POS (%), 2025-2030
- 2.1.2. Total POS Transaction Volume
- Figure & Table 2.3: Global POS Transaction Volume (m), 2025-2030
- 2.1.3. Total POS Transaction Value
- Figure & Table 2.4: Global POS Transaction Value ($m), Split by 8 Key Regions, 2025-2030
- 2.1.1. POS Terminals Installed Base
3. Contactless POS
- 3.1.1. Contactless Terminals Installed Base
- Figure & Table 3.1: Global Contactless POS Installed Base (m), Split by 8 Key Regions, 2025-2030
- Table 3.2: Global Percentage of Dedicated POS That Are Contactless Enabled (%), 2025-2030
- 3.1.2. Contactless POS Transaction Volume
- Figure & Table 3.3: Global Contactless POS Transaction Volume (m), Split by 8 Key Regions, 2025-2030
- 3.1.3. Contactless POS Transaction Value
- Figure & Table 3.4: Global Contactless POS Transaction Value ($m), Split by 8 Key Regions, 2025-2030
4. mPOS
- 4.1.1. mPOS Installed Base
- Figure & Table 4.1: mPOS Installed Base (m), Split by 8 Key Regions, 2025-2030
- 4.1.2. mPOS Transaction Value
- Figure & Table 4.2: Global mPOS Transaction Value ($m), Split by 8 Key Regions, 2025-2030
5. Soft POS
- 5.1.1. Soft POS Installed Base
- Figure & Table 5.1: Number of Smartphones Using Soft POS (m), Split by 8 Key Regions, 2025-2030
- 5.1.2. Soft POS Transaction Volume
- Figure & Table 5.2: Global Soft POS Transaction Volume (m), Split by 8 Key Regions, 2025-2030
- 5.1.3. Soft POS Transaction Value
- Figure & Table 5.3: Global Soft POS Transaction Value ($m), Split by 8 Key Regions, 2025-2030
 2026-2030年全球行动POS终端市场
 mPOS终端市场:按组件、外形规格、支付方式、连接方式、运行环境、应用案例、最终用户行业和分销渠道划分——2026-2032年全球市场预测
 行动POS终端市场分析及预测(至2035年):类型、产品类型、服务、技术、组件、应用、部署模式、最终用户、功能
 2026年全球行动POS终端市场报告
 行动POS终端市场-全球产业规模、份额、趋势、机会、预测:按组件、类型、应用、地区和竞争格局划分,2021-2031年
 MPOS 终端市场规模、份额及成长分析(按组件、解决方案、部署、应用和地区)-2025 年至 2032 年产业预测
 全球 mPOS 设备市场:表现与预测(2020-2031 年)
 mPOS 终端市场规模 - 按组件、按产品、按应用、按部署模型、按技术和预测,2024 年至 2032 年