


 |
市场调查报告书
商品编码
1733999
蜂巢式IoT市场:2025-2030年Cellular IoT Market: 2025-2030 |
||||||
"蜂巢式物联网:GSMA 最新 eSIM 标准对 2030 年全球 65 亿连线至关重要"
| 主要统计 | |
|---|---|
| 2025年的蜂巢式IoT的整体连线数: | 41亿 |
| 2030年的蜂巢式IoT的整体连线数: | 65亿 |
| 由于2030年的蜂巢式IoT连接的总收益: | 310亿美元 |
| 预测期间: | 2025-2030年 |
本研究套件为营运商、行动虚拟网路营运商 (MVNO) 和连接服务供应商提供有关不断发展的蜂窝物联网的广泛分析和可操作的见解市场。该套件包含数据,供利害关係人就其在蜂窝物联网市场的商业策略做出明智的决策。该研究涵盖了蜂窝物联网市场中关键颠覆性服务的趋势,例如通讯API、卫星和非地面网路 (NTN)、量子安全、eSIM 和 iSIM、私有网路等,并重点关注蜂窝物联网中的人工智慧服务,例如自然语言介面、人工智慧推理和人工智慧数据分析。
主要的特征
- 市场动态:洞察蜂窝物联网市场的关键趋势和机遇,例如 NTN 连接的推出、新的人工智慧服务和 eSIM,同时还包括对利益相关者如何利用通讯 API 和提升蜂窝物联网安全性等举措的战略分析。
- 关键要点和策略建议:详细分析蜂窝物联网市场的关键发展机会和洞察,并为希望提高每连接平均收入和实现商业模式多元化的运营商和其他利益相关者提供策略建议。
- 产业基准预测:蜂窝物联网连接数据、蜂窝物联网连接收入、蜂窝物联网连接产生的数据、蜂窝物联网模组出货量、蜂窝物联网模组支出以及蜂窝物联网市场总体规模。
- Juniper Research 竞争力排行榜:对蜂窝物联网市场15家主要供应商的能力和实力进行评估,并详细分析每家供应商的市场规模和服务产品。
样品view
市场资料·预测报告
样品
市场趋势·策略报告
市场资料&预测报告
本研究包含全套预测数据,包含超过 106,000 个数据点和 170 多个表格。
本研究包含以下指标:
- 蜂窝物联网连接数量
- 蜂窝物联网连接收入
- 蜂窝物联网产生的数据
- 蜂窝物联网模组出货量
- 蜂窝物联网模组支出金额
- 蜂窝物联网市场总规模
Juniper Research 互动式预测 (Excel) 包含以下功能:
- 统计分析:其优点在于您可以搜寻特定资料期间所有地区和国家显示的指标。图表可轻鬆修改并汇出至剪贴簿。
- 国家/地区资料工具:此工具可让您查看预测期间所有地区和国家的指标。您可以使用搜寻列缩小显示指标的范围。
- 国家比较工具:您可以选择特定的国家进行比较。此工具包含汇出图表的功能。
- 假设分析:透过三个互动式场景,使用者可以将结果与预测假设进行比较。
目录
市场趋势与策略
第1章 重要点和策略性建议
- 重要点
- 主要的策略性建议
第2章 市场形势
- 蜂巢式IoT的破坏的服务
- 通讯API
- NTN和卫星IoT
- 私人网路
- 蜂巢式IoTAI服务
- CMP的自然地语言介面
- AI资料分析
- AI推论
- AI为基础的多RAT选择
- eSIM和iSIM
- SGP.32
- SGP.41/42
- 蜂巢式IoT量子保全
第3章 蜂巢式IoT经营模式和收益化的未来策略
- 蜂窝物联网商业模式及获利
- 不是收益连接,不是技术连接性
- LPWA服务,经营模式,收益化
- 与5G经营模式收益化
- Connectivity-as-a-Service
第4章 各国准备指数
- 各国准备指数:简介
- 焦点市场
- 5G基础设施
- eSIM和iSIM的引进
- 中国
- 美国
- 成长市场
- 巴西
- 印度
- 饱和市场
- 新兴国家市场
竞争排行榜
第1章 竞争排行榜
第2章 业者简介
- AT&T
- China Mobile
- Cisco
- Deutsche Telekom
- emnify
- Eseye
- Huawei
- KORE Wireless
- Orange Business
- Tata Communications
- Telefonica Tech
- Telit Cinterion
- Verizon Business
- Vodafone Business
- Wireless Logic
- 评估手法
- 限制与解释
- 相关调查
资料·预测
第1章 简介·调查手法
第2章 市场摘要和今后的市场展望
- 蜂窝物联网连接数量
- 蜂窝物联网收入连线数
- 蜂窝物联网产生的数据
- 蜂窝物联网模组出货量
- 蜂窝物联网模组支出金额
第3章 4G IoT
- 4G IoT连线数
- 4G IoT连接的收益
- 4G IoT的生成资料
- 4G IoT模组的出货数
- 4G IoT模组的支出额
第4章 5G IoT
- 5G IoT连线数
- 5G IoT连接的收益
- 5G IoT的生成资料
- 5G IoT模组的出货数
- 5G IoT模组的支出额
第5章 LPWA
- LPWA连线数
- LPWA连接的收益
- LPWA的生成资料
- LPWA模组的出货数
- LPWA模组的支出额
'Cellular IoT: Latest GSMA eSIM Standard Critical to 6.5 billion Connections Globally by 2030'
| KEY STATISTICS | |
|---|---|
| Total number of cellular IoT connections in 2025: | 4.1bn |
| Total number of cellular IoT connections in 2030: | 6.5bn |
| Total cellular IoT connectivity revenue in 2030: | $31bn |
| Forecast period: | 2025-2030 |
Overview
Our "Cellular IoT" research suite provides operators, mobile virtual network operators (MVNOs), and connectivity service providers with extensive analysis and actionable insights into the evolving cellular IoT market. It contains data that enables stakeholders in the market to make informed decisions on their business strategies in the cellular IoT market; covering the development of key disruptive services in the cellular IoT market such as telecommunications Application Programming Interfaces (APIs), satellite or non-terrestrial networks (NTNs), quantum security, eSIMs and iSIMs, and private networks, as well as AI services in cellular IoT such as natural language interfaces, AI inferencing, and AI data analytics.
By reading this report, the audience will benefit from analysis and recommendations on business strategies for the monetisation of cellular IoT; looking at key network technologies such as 5G and Low-Power Wide-Area (LPWA), in addition to how operators and connectivity service providers can begin to expand their business models and offerings to position themselves as technology providers in the market. It also explores the development of business models such as connectivity-as-a-service, and how operators and connectivity service providers can benefit most from these models.
The report includes a Country Readiness Index, providing insight and analysis into which cellular IoT markets will experience the greatest growth over the next five years; allowing stakeholders to effectively understand the current and future status of more than 60 different cellular IoT markets.
The market forecast includes several different options that can be purchased separately, including access to data mapping and a forecast document, a strategy and trends document detailing critical trends in the market, and strategic recommendations for monetising and innovating services in the cellular IoT market.,
The research suite includes a Competitor Leaderboard, which can be purchased separately; containing analysis and market sizing for 15 leading cellular IoT vendors, who each provide platforms for managing cellular IoT connectivity.
Collectively, the suite provides a critical tool for understanding the cellular IoT market. Allowing operators, MVNOs, connectivity service providers, and other stakeholders in the market to optimise their future business strategies and product or service development; providing them with a competitive advantage over their rivals.
All report content is delivered in the English language.
Key Features
- Market Dynamics: Insight into key trends and opportunities in the cellular IoT market, such as the development of NTN connectivity, new AI services, and eSIMs. It also includes strategic analysis of how initiatives such as telecommunications APIs and the push for greater security within cellular IoT can be capitalised on by stakeholders in the market.
- Key Takeaways & Strategic Recommendations: In-depth analysis of key development opportunities and findings within the cellular IoT market, accompanied by strategic recommendations for operators, and other stakeholders in the market, seeking to increase their average revenue per connection or diversify their business models.
- Benchmark Industry Forecast: The suite provides five-year forecasts for the global cellular IoT market; providing data for the number of cellular IoT connections, connectivity revenue from cellular IoT, data generated by cellular IoT connections, number of cellular IoT modules shipped, total expenditure on cellular IoT modules, and total cellular IoT market value.
- Juniper Research Competitor Leaderboard: Key player capability and capacity assessment for 15 key vendors in the cellular IoT market, with market sizing and detailed analysis of each vendor's offering.
SAMPLE VIEW
Market Data & Forecasting Report
The numbers tell you what's happening, but our written report details why, alongside the methodologies.
SAMPLE VIEW
Market Trends & Strategies Report
A comprehensive analysis of the current market landscape, alongside strategic recommendations.
Market Data & Forecasting Report
The market-leading research for the "Cellular IoT" market includes access to the full set of forecast data; comprising more than 106,000 datapoints and 170 tables.
Metrics in the research suite include:
- Number of Cellular IoT Connections
- Connectivity Revenue from Cellular IoT
- Data Generated by Cellular IoT
- Number of Cellular IoT Modules Shipped
- Expenditure on Cellular IoT Modules
- Total Cellular IoT Market Value
Splits are provided for each of these metrics for 2G and 3G, 4G, 5G, and LPWA, with LPWA split into Narrowband Internet of Things (NB-IoT), and Long Term Evolution for Machines (LTE-M), and 5G split into Other 5G and 5G RedCap.
Juniper Research's Interactive Forecast Excel contains the following functionality:
- Statistics Analysis: Users benefit from the ability to search for specific metrics, displayed for all regions and countries across the data period. Graphs are easily modified and can be exported to the clipboard.
- Country Data Tool: This tool enables users to look at metrics for all regions and countries in the forecast period. Users can refine the metrics displayed via a search bar.
- Country Comparison Tool: Users can select and compare specific countries. The ability to export graphs is included in this tool.
- What-if Analysis: Here, users can compare forecast metrics against their own assumptions, via three interactive scenarios.
Market Trends & Strategies Report
This report thoroughly examines the global "Cellular IoT" market; assessing market trends, technological developments, and monetisable opportunities which are shaping the market presently and in the future. Alongside this analysis, the document provides a comprehensive evaluation of business strategies in the cellular IoT market; exploring how operators, MVNOs, and connectivity service providers can introduce new monetisation models and technologies into the cellular IoT market.
Competitor Leaderboard Report
The Competitor Leaderboard included in this report provides detailed evaluation and market positioning for 15 cellular IoT vendors. These companies are positioned as established leaders, leading challengers, or disruptors and challengers, based on a capacity, capability, and product assessment. This includes analysis of their key advantages in the market, future development plans, and key partnerships.
The cellular IoT Competitor Leaderboard includes the following key vendors:
|
|
|
Table of Contents
Market Trends & Strategies
1. Key Takeaways & Strategic Recommendations
- 1.1. Key Takeaways
- 1.2. Key Strategic Recommendations
2. Market Landscape
- 2.1. Introduction
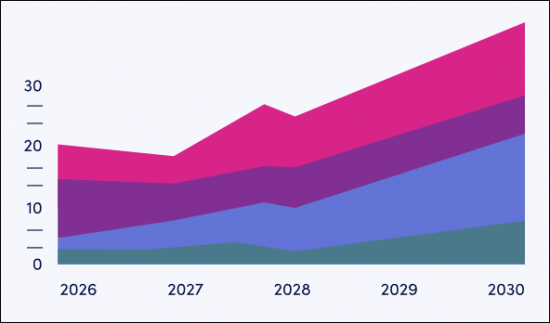
- Figure 2.1: Total Number of Cellular IoT Connections, Split by China and Rest of the World (m), 2025-2030
- 2.2. Disruptive Services in Cellular IoT
- 2.2.1. Telecommunications APIs
- Figure 2.2: Total Operator Revenue from Telecommunications API calls ($m), Split by 8 Key Regions, 2024-2029
- 2.2.2. NTNs and Satellite IoT
- Figure 2.3: Total Satellite Revenue from NTNs (m), Split by 8 Key Regions, 2025-2030
- 2.2.3. Private Networks
- Table 2.4: Total Expenditure on Private Cellular Networks ($m), Split by Market Vertical, 2025-2030
- 2.2.4. AI Services for Cellular IoT
- i. Natural Language Interfaces for CMPs
- ii. AI Data Analytics
- iii. AI Inferencing
- iv. AI-based Multi RAT Selection
- 2.2.5. eSIMs and iSIMs
- Figure 2.5: Total Number of eSIMs and iSIMs in Cellular IoT Connections (m), 2023-2028
- i.SGP.32
- Figure 2.6: SGP.32 Architecture
- ii. SGP.41/42
- Figure 2.7: SGP41/42 Architecture Diagram
- 2.2.6. Quantum Security for Cellular IoT
- 2.2.1. Telecommunications APIs
3. Future Strategies for Cellular IoT Business Models and Monetisation
- 3.1. Cellular IoT Business Models and Monetisation
- 3.1.1. Revenue Not Connections and Technology Not Connectivity
- 3.1.2. LPWA Services, Business Models, and Monetisation
- Table 3.1: NB-IoT and LTE-M
- Table 3.2: Total Number of LPWA Connections (m), Split by 8 Key Regions, 2025-2030
- Figure 3.3: Total Number of LPWA Connections (m), Split by NB-IoT and LTE-M, 2025-2030
- 3.1.3. 5G Business Models and Monetisation
- Table 3.4: Total Number of 5G IoT Connections (m), Split by 8 Key Regions, 2025-2030
- i. Differentiated Connectivity and Network Slicing
- Figure 3.5: Types of Network Slice
- 3.2. Connectivity-as-a-Service
4. Country Readiness Index
- 4.1. Introduction to The Country Readiness Index
- Figure 4.1: Juniper Research Cellular IoT Market Country Readiness Index: Regional Definitions
- Table 4.2: Juniper Research Cellular IoT Market Country Readiness Index: Scoring Criteria
- Figure 4.3: Juniper Research Cellular IoT Market Country Readiness Index
- 4.2. Focus Markets
- i. 5G Infrastructure
- Figure 4.4: Total Cellular IoT Connectivity Revenue ($m), Split by Network Technology, 2025-2030
- ii. eSIM and iSIM Adoption
- 4.2.2. China
- Figure 4.5: Total Number of Cellular IoT Connections in China (m), Split by Network Technology, 2025-2030
- 4.2.3. The US
- Figure 4.6: Total Revenue from Cellular IoT Connections in the US ($m), 2025-2030
- Figure 4.7: Total Number of LTE-M and NB-IoT Connections in the US (m), 2025-2030
- i. 5G Infrastructure
- 4.3. Growth Markets
- Figure 4.8: Cellular IoT Market High-growth Countries
- 4.3.1. Brazil
- Figure 4.9: Total Revenue from Cellular IoT Connectivity in Brazil ($m), Split by Network Technology, 2025-2030
- 4.3.2. India
- Figure 4.10: Total Number of Cellular IoT Connections in India (m), Split by Network Technology, 2025-2030
- 4.4. Saturated Markets
- 4.5. Developing Markets
- Table 4.11: Juniper Research's Cellular IoT Market Country Readiness Index Heatmap: North America
- Table 4.12: Juniper Research's Cellular IoT Market Country Readiness Index Heatmap: Latin America
- Table 4.13: Juniper Research's Cellular IoT Market Country Readiness Index Heatmap: West Europe
- Table 4.14: Juniper Research's Cellular IoT Market Country Readiness Index Heatmap: Central & East Europe
- Table 4.15: Juniper Research's Cellular IoT Market Country Readiness Index Heatmap: Far East & China
- Table 4.16: Juniper Research's Cellular IoT Market Country Readiness Index Heatmap: Indian Subcontinent
- Table 4.17: Juniper Research's Cellular IoT Market Country Readiness Index Heatmap: Rest of Asia Pacific
- Table 4.18: Juniper Research's Cellular IoT Market Country Readiness Index Heatmap: Africa & Middle East
Competitor Leaderboard
1. Competitor Leaderboard
- 1.1. Why Read This Report
- Figure 1.1: Juniper Research's Cellular IoT Market Competitor Leaderboard: Vendors and Product Portfolios (1 of 2)
- Figure 1.1: Juniper Research's Cellular IoT Market Competitor Leaderboard: Vendors and Product Portfolios (2 of 2)
- Figure 1.2: Juniper Research's Cellular IoT Market Competitor Leaderboard: 15 Vendors
- Table 1.3: Juniper Research's Cellular IoT Market Competitor Leaderboard: 15 Vendors
- Table 1.4: Juniper Research's Cellular IoT Market Competitor Leaderboard Heatmap: 15 Vendors
2. Vendor Profiles
- 2.1 Vendor Profiles
- 2.1.1. AT&T
- i. Corporate Information
- Table 2.1: AT&T's Financial Information ($m), 2023-2024
- ii. Geographical Spread
- iii. Key Clients & Strategic Partnerships
- iv. High-level View of Offerings
- Figure 2.2: AT&T Control Center Features
- v. Juniper Research's View: Key Strengths & Strategic Development Opportunities
- i. Corporate Information
- 2.1.2. China Mobile
- i. Corporate Information
- Figure 2.3: China Mobile's Key Financial Metrics, 2023-2024
- ii. Geographical Spread
- iii. Key Clients & Strategic Partnerships
- iv. High-level View of Offerings
- v. Juniper Research's View: Key Strengths & Strategic Development Opportunities
- i. Corporate Information
- 2.1.3. Cisco
- i. Corporate Information
- ii. Geographical Spread
- iii. Key Clients & Strategic Partnerships
- iv. High-level View of Offerings
- Figure 2.4: Cisco Service Provider Partners
- v. Juniper Research's View: Key Strengths & Strategic Development Opportunities
- 2.1.4. Deutsche Telekom
- i. Corporate Information
- Table 2.5: Deutsche Telekom's Key Financial Metrics ($ billion), 2023-2024
- ii. Geographical Spread
- iii. Key Clients & Strategic Partnerships
- iv. High-level View of Offerings
- Figure 2.6: Deutsche Telekom IoT Connectivity Coverage
- Figure 2.7: Deutsche Telekom Platform Integrations
- v. Juniper Research's View: Key Strengths & Strategic Development Opportunities
- i. Corporate Information
- 2.1.5. emnify
- i. Corporate Information
- ii. Geographical Spread
- ii.Key Clients & Strategic Partnerships
- iv. High-level View of Offerings
- Figure 2.8: emnify's 5G Coverage
- v. Juniper Research's View: Key Strengths & Strategic Development Opportunities
- 2.1.6. Eseye
- i. Corporate Information
- ii. Geographical Spread
- iii. Key Clients & Strategic Partnerships
- iv. High-level View of Offerings
- Figure 2.9: SIM Switching Eseye
- Figure 2.10: Eseye's AnyNet Federation and Direct Operator Interconnects
- v. Juniper Research's View: Key Strengths & Strategic Development Opportunities
- 2.1.7. Huawei
- i. Corporate Information
- ii. Geographical Spread
- iii. Key Clients & Strategic Partnerships
- iv. High-level View of Offerings
- Figure 2.11: Huawei's IoT Connection Management Platform
- Figure 2.12: Huawei's IoT Device Management
- v. Juniper Research's View: Key Strengths & Strategic Development Opportunities
- 2.1.8. KORE Wireless
- i. Corporate Information
- ii. Geographical Spread
- iii. Key Clients & Strategic Partnerships
- iv. High-level View of Offerings
- Figure 2.13: KORE One Platform
- v. Juniper Research's View: Key Strengths & Strategic Development Opportunities
- 2.1.9. Orange Business
- i. Corporate Information
- ii. Geographical Spread
- Figure 2.14: Orange's Operations Map
- iii. Key Clients & Strategic Partnerships
- iv. High-level View of Offerings
- v. Juniper Research's View: Key Strengths & Strategic Development Opportunities
- 2.1.10. Tata Communications
- i. Corporate Information
- ii. Geographical Spread
- iii. Key Clients & Strategic Partnerships
- iv. High-level View of Offerings
- v. Juniper Research's View: Key Strengths & Strategic Development Opportunities
- 2.1.11. Telefonica Tech
- i. Corporate Information
- ii. Geographical Spread
- iii. Key Clients & Strategic Partnerships
- iv. High-level View of Offerings
- v. Juniper Research's View: Key Strengths & Strategic Development Opportunities
- 2.1.12. Telit Cinterion
- i. Corporate Information
- ii. Geographical Spread
- iii. Key Clients & Strategic Partnerships
- Figure 2.15: Telit Cinterion NExT(TM) eSIM Provisioning Portal
- iv. Juniper Research's View: Key Strengths & Strategic Development Opportunities
- 2.1.13. Verizon Business
- i. Corporate Information
- Table 2.16: Verizon's Key Financial Metrics, 2023-2024
- ii. Geographical Spread
- iii. Key Clients & Strategic Partnerships
- iv. High-level View of Offerings
- v. Juniper Research's View: Key Strengths & Strategic Development Opportunities
- i. Corporate Information
- 2.1.14. Vodafone Business
- i. Corporate Information
- ii. Geographical Spread
- iii. Key Clients & Strategic Partnerships
- iv. High-level View of Offerings
- Figure 2.17: Vodafone Business's LPWA Services Availability
- v. Juniper Research's View: Key Strengths & Strategic Development Opportunities
- 2.1.15. Wireless Logic
- i. Corporate Information
- ii. Geographical Spread
- iii. Key Clients & Strategic Partnerships
- iv. High-level View of Offerings
- v. Juniper Research's View: Key Strengths & Strategic Development Opportunities
- 2.1.1. AT&T
- 2.2. Juniper Research Leaderboard Assessment Methodology
- 2.3. Limitations & Interpretations
- Table 2.18: Juniper Research's Cellular IoT Market Competitor Leaderboard: 15 Vendors
- 2.4. Related Research
Data & Forecasting
1. Introduction and Methodology
- 1.1. Introduction
- Figure 1.1: Total Number of Cellular IoT Connections (m), Split by Network Technology, 2025-2030
- 1.2. Forecast Methodology
- Figure 1.2: Juniper Research Cellular IoT Market: Methodology Model
2. Market Summary and Future Market Outlook
- 2.1. Total Number of Cellular IoT Connections
- Figure & Table 2.1: Total Number of Cellular IoT Connections (m), Split by 8 Key Regions, 2025-2030
- 2.2. Total Connectivity Revenue from Cellular IoT
- Figure & Table 2.2: Total Connectivity Revenue from Cellular IoT ($m), Split by Key Regions, 2025-2030
- 2.3. Total Data Generated by Cellular IoT
- Figure & Table 2.3: Total Data Generated by Cellular IoT (PB), Split by 8 Key Regions, 2025-2030
- 2.4. Total Cellular IoT Modules Shipped
- Figure & Table 2.4: Total Cellular IoT Modules Shipped (m), Split by 8 Key Regions, 2025-2030
- 2.5. Total Expenditure on Cellular IoT Modules
- Figure & Table 2.5: Total Expenditure on Cellular IoT Modules ($m), Split by 8 Key Regions, 2025-2030
3. 4G IoT
- 3.1. Total Number of 4G IoT Connections
- Figure & Table 3.1: Total Number of 4G IoT Connections (m), Split by 8 Key Regions, 2025-2030
- 3.2. Total Connectivity Revenue from 4G IoT
- Figure & Table 3.2: Total Connectivity Revenue from 4G IoT ($m), Split by 8 Key Regions, 2025-2030
- Table 3.3: Proportion of Cellular IoT Connections that Are 2G & 3G, and 4G (%), 2023-2030
- 3.3. Total Data Generated by 4G IoT
- Figure & Table 3.4: Total Data Generated by 4G IoT (PB), Split by 8 Key Regions, 2025-2030
- 3.4. Total Number of 4G IoT Modules Shipped
- Figure & Table 3.5: Total Number of 4G IoT Modules Shipped (m), Split by 8 Key Regions, 2025-2030
- 3.5. Total Expenditure on 4G IoT Modules
- Figure & Table 3.6: Total Expenditure on 4G IoT Modules ($m), Split by 8 Key Regions, 2025-2030
- Table 3.7: Average Cost of a 4G IoT Module ($), Split by 8 Key Regions, 2025-2030
4. 5G IoT
- 4.1. Total Number of 5G IoT Connections
- Figure & Table 4.1: Total Number of 5G IOT connections (m) Split by 8 Key Regions, 2025-2030
- Table 4.2: Total Number of 5G IoT Connections (m), Split by 5G RedCap and Other 5G, 2025-2030
- 4.2. Total Connectivity Revenue from 5G IoT
- Figure & Table 4.3: Total Connectivity Revenue from 5G IoT ($m), Split by 8 Key Regions, 2025-2030
- Table 4.4: Total Connectivity Revenue from 5G IoT ($m), Split by 5G RedCap and Other 5G, 2025-2030
- 4.3. Total Data Generated by 5G IoT
- Figure & Table 4.5: Total Data Generated by 5G IoT (PB), Split by 8 Key Regions, 2025-2030
- Table 4.6: Total Data Generated by 5G IoT (PB), Split by 5G RedCap and Other 5G, 2025-2030
- 4.4. Total Number of 5G IoT Modules Shipped
- Figure & Table 4.7: Total Number of 5G IoT Modules Shipped (m), Split by 8 Key Regions, 2025-2030
- Table 4.8: Total Number of 5G IoT Modules Shipped (m), Split by RedCap and Other 5G, 2025-2030
- 4.5. Total Expenditure on 5G IoT Modules
- Figure & Table 4.9: Total Expenditure on 5G IoT Modules ($m), Split by 8 Key Regions, 2025-2030
- Table 4.10: Total Expenditure on 5G IoT Modules ($m), Split by RedCap and Other 5G, 2025-2030
5. LPWA
- 5.1. Total Number of LPWA Connections
- Figure & Table 5.1: Total Number of LPWA Connections (m), Split by 8 Key Regions, 2025-2030
- Figure 5.2: Total Number of LPWA Connections (m), Split by NB-IoT and LTE-M, 2025-2030
- 5.2. Total Connectivity Revenue from LPWA Connections
- Figure & Table 5.3: Total Connectivity Revenue from LPWA Connections ($m), Split by 8 Key Regions, 2025-2030
- Figure 5.4: Total Connectivity Revenue from LPWA Connections ($m), Split by NB-IoT and LTE-M, 2025-2030
- 5.3. Total Data Generated by LPWA Connections
- Figure & Table 5.5: Total Data Generated by LPWA Connections (PB), Split by 8 Key Regions, 2025-2030
- Table 5.6: Total Data Generated by LPWA Connections (PB), Split by NB-IoT and LTE-M, 2025-2030
- 5.4. Total Number of LPWA Modules Shipped
- Figure & Table 5.7: Total Number of LPWA Modules Shipped (m), Split by 8 Key Regions 2025-2030
- Table 5.8: Total Number of LPWA Modules Shipped (m), Split by NB-IoT and LTE-M, 2025-2030
- 5.5. Total Expenditure on LPWA Modules
- Figure & Table 5.9: Total Expenditure on LPWA Modules ($m), Split by 8 Key Regions, 2025-2030
- Table 5.10: Total Expenditure on LPWA Modules ($m), Split by NB-IoT and LTE-
 蜂巢式物联网市场:按组件、网路类型、应用和最终用户划分-2026-2032年全球市场预测
 蜂巢式物联网市场报告:按组件、类型、最终用途和地区划分(2026-2034 年)
 追踪物联网市场:Cat-M追踪物联网市场:低功耗广域网路和专有标准蜂窝模组市场:2026-2032年全球市场预测(依网路技术、外形规格、介面类型、等级和应用划分)
 2026年全球蜂巢式物联网市场报告
 蜂巢式物联网市场分析及预测(至2035年):按类型、产品类型、服务、技术、组件、应用、设备、部署类型、最终用户和功能划分
 全球蜂巢式物联网市场规模、份额、趋势和成长分析报告(2026-2034)
 全球550个最大的蜂窝物联网专案—第九版
 蜂巢式物联网市场规模、份额和成长分析(按组件、技术、应用、垂直产业和地区划分)-2026-2033年产业预测