


 |
市场调查报告书
商品编码
1764330
订阅经济全球市场:2025-2030Subscription Economy Market: 2025-2030 |
||||||
本报告对全球订阅经济市场进行了详细分析,包括关键成长机会和策略建议、市场前景、市场规模和预测,以及对前 20 家供应商的评估。
| 主要统计 | |
|---|---|
| 2025年的总收益 | 7,220亿美元 |
| 2030年的总收益 | 12亿美元 |
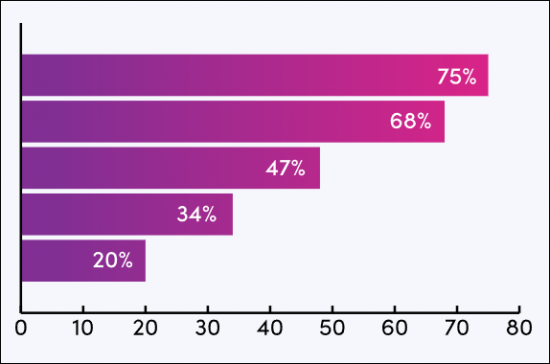
| 2025年~2030年的市场成长 | 68% |
| 预测期间 | 2025年~2030年 |
样品view
市场资料·预测报告
样品view
市场趋势·策略报告
目录
市场趋势·策略
第1章 重要事项和策略性建议
- 重要事项
- 策略性建议
第2章 市场形势
- 简介
- 订阅模式的类型
- 消费行为分析
- 趋势与促进因素
第3章 市场区隔分析
- 简介
- 软体
- 新闻与杂誌
- 数位娱乐
- 实体商品
- 实体商品盒
- 多服务
- 外送服务
- 健身与健康
- 出游即服务 (MaaS)
第4章 各国的准备度指标
- 各国的准备度指标的简介
- 焦点市场
- 成长市场
- 饱和市场
- 发展中市场
竞争排行榜
第1章 Juniper Research的竞争排行榜
- 读该报告的理由
第2章 企业简介
- Aria Systems
- Billsby
- Chargebee
- ChargeOver
- Cleverbridge
- Cloudmore
- FastSpring
- Gotransverse
- Maxio
- Oracle
- Ordway Labs
- Paddle
- Recharge
- Recurly
- Salesforce
- SAP
- Stripe
- Verifone
- Zoho
- Zuora
- Juniper Research排行榜的评估手法
- 相关调查
资料·预测
第1章 与简介调查手法
第2章 市场摘要
- 订阅的整体契约数
- 订阅付款的总数
- 订阅的总收益
第3章 付款方式的明细
- 转帐收益
- 付款通知单付款收益
- 数位钱包收益
- 开放式银行收益
- 卡片付款收益
- 替代付款收益
第4章 市场区隔的明细
- 数位音乐订阅的整体契约数
- 数位音乐订阅的总收益
- 数位影音订阅的整体契约数
- 数位影音订阅的总收益
- 电玩游戏订阅的整体契约数
- 电玩游戏订阅的总收益
- 数位朗读订阅的契约数
- 数位朗读订阅的收益
- 物理商品条款订阅的契约数
- 物理商品条款订阅的收益
- 物理商品箱订阅的契约数
- 物理商品箱订阅的收益
- 发送服务订阅的契约数
- 发送服务订阅的收益
- 健身·健康订阅的契约数
- 健身·健康订阅的收益
- 多服务订阅的契约数
- 多服务订阅的收益
- Mobility-as-a-Service(MaaS)订阅的契约数
- Mobility-as-a-Service(MaaS)订阅的收益
- 新闻·杂誌订阅的契约数
- 新闻·杂誌订阅的收益
- 软体订阅的契约数
- 软体订阅的收益
'Recurly, Zuora, and Zoho Top Juniper Research Subscription Economy Leaderboard for 2025'
| KEY STATISTICS | |
|---|---|
| Total revenue in 2025: | $722bn |
| Total revenue in 2030: | $1.2tn |
| 2025 to 2030 market growth: | 68% |
| Forecast period: | 2025-2030 |
Overview
Juniper Research's "Subscription Economy" research suite provides a comprehensive and insightful analysis of this progressing market, enabling stakeholders, from subscription management providers to regulators and subscription providers, to understand future growth, key trends and the competitive environment.
The market-leading study includes a consumer behaviour analysis which evaluates the key consumer behaviour according to age group; providing strategic recommendations for subscription management providers and subscription providers to maximise revenue. Additionally, it features Juniper Research's Country Readiness Index, which provides a country-level analysis of the current and future opportunities of subscriptions in each geography. The coverage can also be purchased as a full research suite containing all these elements, and a substantial discount.
The research suite includes several different options that can be purchased separately, including access to data mapping the adoption and future growth of the subscription economy market over the next 5 years, split by the following market segments:
|
|
It also provides an insightful study uncovering the latest trends and opportunities within the subscription economy market, including the use of AI and automation in subscription management platform solutions, and the rising adoption of subscription bundling that enables more flexible and simplified subscription management for consumers. Additionally, it features an extensive analysis of the 20 market leaders in the subscription economy space.
Collectively, these documents provide a critical tool for understanding this profitable market. They allow subscription management providers and subscription providers to shape their future strategy, and capitalise on future growth opportunities in digitally-transforming regions. This research suite's extensive coverage makes it a valuable tool for navigating this robust market.
All report content is delivered in the English language.
Key Features
- Key Takeaways & Strategic Recommendations: In-depth analysis of key development opportunities, key findings and key strategic recommendations for subscription management providers, subscription providers, and regulators.
- Market Outlook: Insights into key drivers and market trends within the subscription economy market; addressing challenges posed by subscription fatigue and highly saturated markets, and how these can be overcome. It also provides an analysis of the current and future trends in the subscription economy market; revealing strategic recommendations for subscription management providers and subscription providers to capitalise on changing consumer behaviour. Furthermore, it highlights key monetisation opportunities for subscription providers across multiple market segments (Delivery Service, Digital Music, Digital Spoken Word, Digital Video, Fitness and Wellness, Physical Goods Boxes, Physical Goods Items, MaaS, Multi-service, News and Magazines, and Video Games).
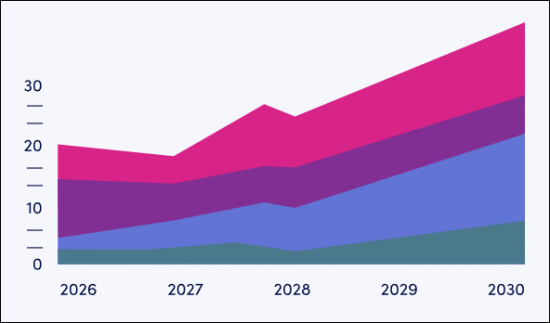
- Benchmark Industry Forecasts: The market size and forecast for the subscription economy market, including total subscription revenue, total number of subscription payments, and total number of subscriptions. The forecast further breaks down total subscription revenue and total number of subscriptions by the market segments, as well as by key payment method types, including direct debit, bill pay, digital wallets, Open Banking, card payments, and alternative payment methods.
- Juniper Research Competitor Leaderboard: Key player capability and capacity assessment for 20 subscription management providers, via the Juniper Research Competitor Leaderboard, featuring subscription market size for major players in the subscription management industry.
SAMPLE VIEW
Market Data & Forecasting Report
The numbers tell you what's happening, but our written report details why, alongside the methodologies.
SAMPLE VIEW
Market Trends & Strategies Report
A comprehensive analysis of the current market landscape, alongside strategic recommendations.
Market Data & Forecasting Report
The market-leading research suite for the "Subscription Economy" market includes access to the full set of forecast data of 157 tables and over 71,500 datapoints. Metrics in the research suite include:
- Total Number of Subscriptions
- Total Subscription Revenue
These metrics are provided for the following key market segments:
- Delivery Service
- Digital Music
- Digital Spoken Word
- Digital Video
- Fitness and Wellness
- Mobility-as-a-Service (MaaS)
- Multiservice
- Physical Goods Boxes
- Physical Goods Items
- Software
- News and Magazines
- Video Games
The forecast further splits the above metrics, as well as the total number of subscription payments, by the following payment types:
- Direct Debit
- Bill Pay
- Digital Wallets
- Open Banking
- Card Payments
- Alternative Payment Methods
Juniper Research Interactive Forecast Excel contains the following functionality:
- Statistics Analysis: Users benefit from the ability to search for specific metrics, displayed for all regions and countries across the data period. Graphs are easily modified and can be exported to the clipboard.
- Country Data Tool: This tool lets users look at metrics for all regions and countries in the forecast period. Users can refine the metrics displayed via a search bar.
- Country Comparison Tool: Users can select countries and compare each of them. The ability to export graphs is included in this tool.
- What-if Analysis: Here, users can compare forecast metrics against their own assumptions, via 5 interactive scenarios.
Market Trends & Strategies Report
This report provides a detailed outlook for the market; assessing market trends and the factors shaping the evolution of this growing market. Technological developments, particularly in AI, have led to real-time payments; enabling new subscription models such as usage-based models. It also evaluates challenges posed by tightening regulations, as governments continue to target subscription traps.
This report delivers an insightful analysis of the strategic opportunities for subscription management providers and subscription providers, and strategic recommendations to overcome emerging market challenges, such as subscription fatigue. It also features an evaluation of key market segment opportunities for subscription providers and subscription management providers; highlighting key markets with the highest growth potential.
Competitor Leaderboard Report
The Competitor Leaderboard report provides a detailed evaluation and market positioning for 20 leading vendors in the subscription economy space. The vendors are positioned as an established leader, leading challenger, or disruptor and challenger, based on capacity and capability assessments:
|
|
This document is centred around the Juniper Research Competitor Leaderboard; a vendor positioning tool that provides an at-a-glance view of the competitive landscape in a market, backed by a robust methodology.
Table of Contents
Market Trends & Strategies
1. Key Takeaways and Strategic Recommendations
- 1.1. Key Takeaways
- 1.2. Strategic Recommendations
2. Market Landscape
- 2.1. Introduction
- 2.1.1. Types of Subscription Models
- i. Flat-rate
- ii. Tiered
- iii. Per User
- iv. Freemium
- v. Usage-based
- vi. Per-feature
- vii. Summary
- 2.1.2. Consumer Behaviour Analysis
- i. Millennials
- ii. Other Generations
- Figure 2.1: Key Behavioural Characteristics of Each Generation in the Subscription Economy
- 2.1.3. Trends and Drivers
- i. Increasing Regulations
- Figure 2.2: Summary of EU Directives That Protect Consumers With Subscriptions
- ii. AI and Automation
- Figure 2.3: Key Benefits of AI in the Subscription Economy
- iii. Sustainability
- i. Increasing Regulations
- 2.1.1. Types of Subscription Models
3. Market Segment Analysis
- 3.1. Introduction
- 3.1.1. Software
- 3.1.2. News and Magazines
- 3.1.3. Digital Entertainment
- Figure 3.1: Total Digital Entertainment Revenue ($m), Split by 4 Key Segments, 2030
- i. Digital Video
- ii. Digital Music and Digital Spoken Word
- iii. Video Game
- 3.1.4. Physical Goods Items
- 3.1.5. Physical Goods Boxes
- 3.1.6. Multi-service
- 3.1.7. Delivery Service
- 3.1.8. Fitness and Wellbeing
- 3.1.9. Mobility-as-a-Service
4. Country Readiness Index
- 4.1. Introduction to Country Readiness Index
- Figure 4.1: Juniper Research's Country Readiness Index Scoring Criteria: Subscription Economy
- Figure 4.2: Juniper Research Country Readiness Index: Subscription Economy
- Figure 4.3: Subscription Economy Country Readiness Index: Market Segments
- 4.2. Focus Markets
- i. Increased Internet Users
- Figure 4.4: Total Number of Subscriptions (m), Split by the Top 5 Focus Market Countries, 2025-2030
- ii. Increased Banked Individuals
- iii. India
- i. Increased Internet Users
- 4.3. Growth Markets
- i. Africa and the Middle East
- Figure 4.5: Total Subscription Revenue (m), Split by Africa and the Middle East, 2025-2030
- ii. Latin America
- i. Africa and the Middle East
- 4.4. Saturated Markets
- Figure 4.6: Total Subscription Revenue ($m), Split by Leading Saturated Markets, 2025-2030
- i. Subscription Bundling
- ii. Personalisation
- 4.5. Developing Markets
- Figure 4.7: Total Subscription Revenue ($m), Split by Key Developing Markets, 2025-2030
- Figure 4.8: Juniper Research's Country Readiness Index Heatmap: North America
- Figure 4.9: Juniper Research's Country Readiness Index Heatmap: Latin America
- Figure 4.10: Juniper Research's Country Readiness Index Heatmap: West Europe
- Figure 4.11: Juniper Research's Country Readiness Index Heatmap: Central and East Europe
- Figure 4.12: Juniper Research's Country Readiness Index Heatmap: Far East & China
- Figure 4.13: Juniper Research's Country Readiness Index Heatmap: Indian Subcontinent
- Figure 4.14: Juniper Research's Country Readiness Index Heatmap: Rest of Asia Pacific
- Figure 4.15: Juniper Research's Country Readiness Index Heatmap: Africa and Middle East
Competitor Leaderboard
1. Juniper Research Competitor Leaderboard
- 1.1. Why Read This Report
- Figure 1.1: Juniper Research Competitor Leaderboard Vendors: Subscription Economy: Products and Portfolio
- Figure 1.2: Juniper Research Competitor Leaderboard: Subscription Economy
- Table 1.3: Juniper Research Competitor Leaderboard: Subscription Economy Vendor Ranking
- Table 1.4: Juniper Research Competitor Leaderboard Heatmap: Subscription Economy (Pg 1 of 2)
- Table 1.4: Juniper Research Competitor Leaderboard Heatmap: Subscription Economy (Pg 2 of 2)
2. Company Profiles
- 2.1.1. Aria Systems
- i. Corporate
- ii. Geographical Spread
- iii. Key Clients & Strategic Partnerships
- Figure 2.1: Services Offered by Aria Systems
- iv. High-level View of Offerings
- Figure 2.2: Products Offered by Aria Systems
- v. Juniper Research's View: Key Strengths & Strategic Development Opportunities
- 2.1.2. Billsby
- i. Corporate
- ii. Geographical Spread
- iii. Key Clients & Strategic Partnerships
- iv. High-level View of Offerings
- v. Juniper Research's View: Key Strengths & Strategic Development Opportunities
- 2.1.3. Chargebee
- i. Corporate
- ii. Geographical Spread
- iii. High-level View of Offerings
- iv. Juniper Research's View: Key Strengths & Strategic Development Opportunities
- 2.1.4. ChargeOver
- i. Corporate
- ii. Geographical Spread
- iii. Key Clients & Strategic Partnerships
- iv. High-level View of Offerings
- v. Juniper Research's View: Key Strengths & Strategic Development Opportunities
- 2.1.5. Cleverbridge
- i. Corporate
- ii. Geographical Spread
- iii. Key Clients & Strategic Partnerships
- iv. High-level View of Offerings
- v. Juniper Research's View: Key Strengths & Strategic Development Opportunities
- 2.1.6. Cloudmore
- i. Corporate
- ii. Geographical Spread
- iii. Key Clients & Strategic Partnerships
- iv. High-level View of Offerings
- v. Juniper Research's View: Key Strengths & Strategic Development Opportunities
- 2.1.7. FastSpring
- i. Corporate
- ii. Geographical Spread
- iii. Key Clients & Strategic Partnerships
- iv. High-level View of Offerings
- Figure 2.3: FastSpring's Subscription Management Process
- v. Juniper Research's View: Key Strengths & Strategic Development Opportunities
- 2.1.8. Gotransverse
- i. Corporate
- ii. Geographical Spread
- iii. Key Clients & Strategic Partnerships
- iv. High-level View of Offerings
- v. Juniper Research's View: Key Strengths & Strategic Development Opportunities
- 2.1.9. Maxio
- i. Corporate
- ii. Geographical Spread
- iii. Key Clients & Strategic Partnerships
- iv. High-level View of Offerings
- v. Juniper Research's View: Key Strengths & Strategic Development Opportunities
- 2.1.10. Oracle
- i. Corporate
- ii. Geographical Spread
- iii. Key Clients & Strategic Partnerships
- iv. High-level View of Offerings
- Figure 2.4: Oracle's Product Offerings
- v. Juniper Research's View: Key Strengths & Strategic Development Opportunities
- 2.1.11. Ordway Labs
- i. Corporate
- ii. Geographical Spread
- iii. Key Clients & Strategic Partnerships
- iv. High-level View of Offerings
- v. Juniper Research's View: Key Strengths & Strategic Development Opportunities
- 2.1.12. Paddle
- i. Corporate
- ii. Geographical Spread
- iii. Key Clients & Strategic Partnerships
- iv. High-level View of Offerings
- Figure 2.5: Paddle's Fraud Detection System
- v. Juniper Research's View: Key Strengths & Strategic Development Opportunities
- 2.1.13. Recharge
- i. Corporate
- Figure 2.6: Revenue Processed by Recharge, 2014-2023
- ii. Geographical Spread
- iii. Key Clients & Strategic Partnerships
- iv. High-level View of Offerings
- v. Juniper Research's View: Key Strengths & Strategic Development Opportunities
- i. Corporate
- 2.1.14. Recurly
- i. Corporate
- ii. Geographical Spread
- iii. Key Clients & Strategic Partnerships
- iv. High-level View of Offerings
- v. Juniper Research's View: Key Strengths & Strategic Development Opportunities
- 2.1.15. Salesforce
- i. Corporate
- Table 2.7: Salesforce's Financial Snapshot ($m), 2020-2024
- ii. Geographical Spread
- iii. Key Clients & Strategic Partnerships
- iv. High-level View of Offerings
- v. Juniper Research's View: Key Strengths & Strategic Development Opportunities
- i. Corporate
- 2.1.16. SAP
- i. Corporate
- Table 2.8: SAP's Financial Snapshot ($b), 2022-2024
- ii. Geographical Spread
- iii. Key Clients & Strategic Partnerships
- iv. High-level View of Offerings
- v. Juniper Research's View: Key Strengths & Strategic Development Opportunities
- i. Corporate
- 2.1.17. Stripe
- i. Corporate
- ii. Geographical Spread
- iii. Key Clients & Strategic Partnerships
- iv. High-level View of Offerings
- v. Juniper Research's View: Key Strengths & Strategic Development Opportunities
- 2.1.18. Verifone
- i. Corporate
- ii. Geographic Spread
- iii. Key Clients & Strategic Partnerships
- iv. High-level View of Offerings
- Figure 2.9: Products Offered by 2Checkout
- v. Juniper Research's View: Key Strengths & Strategic Development Opportunities
- 2.1.19. Zoho
- i. Corporate
- ii. Geographical Spread
- iii. Key Clients & Strategic Partnerships
- iv. High-level View of Offerings
- v. Juniper Research's View: Key Strengths & Strategic Development Opportunities
- 2.1.20. Zuora
- i. Corporate
- Table 2.10: Zuora's Select Financial Information ($m), 2020-2024
- ii. Geographical Spread
- iii. Key Clients & Strategic Partnerships
- iv. High-level View of Offerings
- v. Juniper Research's View: Key Strengths & Strategic Development Opportunities
- i. Corporate
- 2.1. Juniper Research Leaderboard Assessment Methodology
- 2.1.1. Limitations & Interpretations
- Table 2.11: Juniper Research Leaderboard Assessment Criteria: Subscription Economy
- 2.1.1. Limitations & Interpretations
- 2.2. Related Research
Data & Forecasting
1. Introduction and Methodology
- 1.1. Subscription Economy Market Summary and Future Outlook
- 1.2. Forecast Methodology
- Figure 1.1:Payment Methods Forecast Methodology
- Figure 1.2: Digital Goods & Services Subscription Forecast Methodology
- Figure 1.3: Physical Goods Subscription Forecast Methodology
2. Market Summary
- 2.1. Total Volume of Subscriptions
- Figure and Table 2.1: Number of Subscriptions per annum (m), Split by 8 Key Regions, 2025-2030
- 2.2. Total Volume Subscription Payments
- Figure and Table 2.2: Total Number of Subscription Payments per Annum (m), Split by 8 Key Regions, 2025-2030
- 2.3. Total Subscription Revenue
- Figure and Table 2.3: Total Subscription Revenue per annum ($m), Split by 8 Key Regions, 2020-2028
3. Payment Methods Splits
- 3.1. Direct Debit Revenue
- Figure 3.1: Total Revenue from Direct Debit Subscriptions per annum ($m), Split by 8 Key Regions, 2025-2030
- 3.2. Bill Pay Revenue
- Figure 3.2: Total Revenue from Bill Pay Subscriptions per annum ($m), Split by 8 Key Regions, 2025-2030
- 3.3. Digital Wallets Revenue
- Figure 3.3: Total Revenue from Digital Wallet Subscriptions per annum ($m), Split by 8 Key Regions, 2025-2030
- 3.4. Open Banking Revenue
- Figure 3.4: Total Revenue from Open Banking Subscriptions per annum ($m), Split by 8 Key Regions, 2025-2030
- 3.5. Card Payment Revenue
- Figure 3.5: Total Revenue from Card Payment Subscriptions per annum ($m), Split by 8 Key Regions, 2025-2030
- 3.6. Alternative Payment Revenue
- Figure 3.6: Total Revenue from Alternative Payment Methods Subscriptions per annum ($m), Split by 8 Key Regions, 2025-2030
4. Market Segment Splits
- 4.1. Total Digital Music Subscription Volume
- Figure and Table 4.1: Total Volume of Digital Video Subscriptions (m), Split by 8 Key Regions, 2025-2030
- 4.2. Total Digital Music Subscription Revenue
- Figure and Table 4.2: Total Spend on Digital Music Subscriptions per annum ($m), Split by 8 Key Regions, 2025-2030
- 4.3. Total Digital Video Subscription Volume
- Figure and Table 4.3: Total Volume of Digital Video Subscriptions (m), Split by 8 Key Regions, 2025-2030
- 4.4. Total Digital Video Subscription Revenue
- Figure and Table 4.4: Total Spend on Digital Video Streaming Subscriptions per annum ($m), Split by 8 Key Regions, 2025-2030
- 4.5. Total Video Game Subscription Volume
- Figure and Table 4.5: Total Volume of Video Game Subscriptions (m), Split by 8 Key Regions, 2025-2030
- 4.6. Total Video Game Subscription Revenue
- Figure and Table 4.6: Total Value of Video Game Subscriptions ($m), Split by 8 Key Regions, 2025-2030
- 4.7. Digital Spoken Word Subscription Volume
- Figure and Table 4.7: Total Volume of Digital Spoken Word Subscriptions (m), Split by 8 Key Regions, 2025-2030
- 4.8. Digital Spoken Word Subscription Revenue
- Figure and Table 4.8: Total Value of Digital Spoken Word Subscriptions ($m), Split by 8 Key Regions, 2025-2030
- 4.9. Physical Goods Items Subscription Volume
- Figure and Table 4.9: Total Volume of Physical Goods Items Subscriptions (m), Split by 8 Key Regions, 2025-2030
- 4.10. Physical Goods Items Subscription Revenue
- Figure and Table 4.10: Total Subscription Box Revenue per annum ($m), Split by 8 Key Regions, 2025-2030
- 4.11. Physical Goods Boxes Subscription Volume
- Figure and Table 4.11: Total Volume of Physical Goods Box Subscriptions (m), Split by 8 Key Regions, 2025-2030
- 4.12. Physical Goods Boxes Subscription Revenue
- Figure and Table 4.12: Total Subscription Box Revenue per annum ($m), Split by 8 Key Regions, 2025-2030
- 4.13. Delivery Service Subscription Volume
- Figure and Table 4.13: Total Delivery Service Subscription Revenue per annum ($m), Split by 8 Key Regions, 2025-2030
- 4.14. Delivery Service Subscription Revenue
- Figure and Table 4.14: Total Delivery Service Subscription Revenue per annum ($m), Split by 8 Key Regions, 2025-2030
- 4.15. Fitness and Wellness Subscription Volume
- Figure and Table 4.15: Total Volume of Fitness & Wellness Subscriptions per annum (m), Split by 8 Key Regions, 2025-2030
- 4.16. Fitness and Wellness Subscription Revenue
- Figure and Table 4.16: Total Revenue from Fitness & Wellness subscriptions per annum (m), 2025-2030
- 4.17. Multi-service Subscription Volume
- Figure and Table 4.17: Total Volume of Multi-service Subscriptions (m), Split by 8 Key Regions, 2025-2030
- 4.18. Multi-service Subscription Revenue
- Figure and Table 4.18: Total Multi-service Subscription Revenue per annum ($m), Split by 8 Key Regions, 2025-2030
- 4.19. Mobility-as-a-Service Subscription Volume
- Figure and Table 4.19: Total Volume of Mobility-as-a-Service subscriptions (m), Split by 8 Key Regions, 2025-2030
- 4.20. Mobility-as-a-Service Subscription Volume
- Figure and Table 4.20: Total Mobility-as-a-Service Subscription Revenue ($m), Split by 8 Key Regions, 2021-2028
- 4.21. News & Magazine Subscription Volume
- Figure and Table 4.21: Total Volume of News & Magazine Subscriptions (m), Split by 8 Key Regions, 2025-2030
- 4.22. News & Magazine Subscription Revenue
- Figure and Table 4.22: Total Revenue for News & Magazine Subscriptions ($m), Split into 8 Key Regions, 2025-2030
- 4.23. Software Subscription Volume
- Figure and Table 4.23: Total Volume of Software Subscriptions (m), Split by 8 Key Regions, 2025-2030
- 4.24. Software Subscription Revenue
- Figure 4.24: Total Revenue of Software Subscriptions ($m), Split by 8 Key Regions, 2025-2030