


 |
市场调查报告书
商品编码
1777931
B2B付款市场:2025-2030年B2B Payments Market: 2025-2030 |
||||||
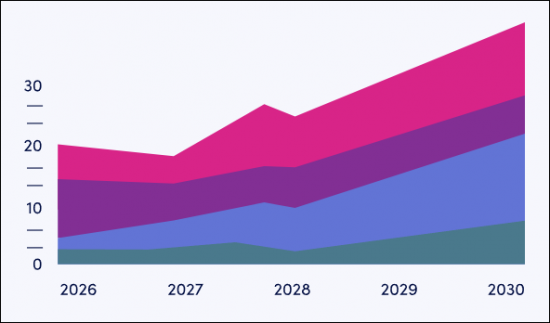
跨境贸易蓬勃发展,儘管受到关税影响,但预计到2030年,跨境B2B支付规模仍将达180亿美元。
| 主要统计 | |
|---|---|
| 2025年的整体交易额: | 1,870亿美元 |
| 2030年的整体交易额: | 2,240亿美元 |
| 从2025年~2030年的市场成长率: | 20% |
| 预测期间: | 2025-2030年 |
本研究资料包对 B2B 支付市场进行了全面而深入的分析,帮助从 B2B 支付平台提供者到监管机构和银行等利害关係人了解未来成长、关键趋势和竞争格局。
本研究套件提供多种个人购买选项。 "市场趋势与策略" 部分包含对 B2B 支付关键发展的深入分析,包括新的支付类型和自动化系统。此外,Juniper Research 的国家准备指数提供了 61 个不同地区 B2B 支付现状及未来机会的逐国分析。
"数据与预测" 部分提供未来五年 B2B 支付市场采用情况和未来成长的数据,并按跨境和国内交易、业务规模和支付方式进行细分。
此外, "竞争排行榜" 对 B2B 支付领域的 19 家市场领导者进行了全面分析, "未来领导者指数" 则重点介绍了 18 家有望成为市场重要参与者的创新公司。
报告为全英语版。
范例视图
市场资料&预测报告
样品
市场趋势与策略报告
市场数据与预测报告
此研究套件包含 158 个表格和预测的完整集合,包含超过 61,000 个资料点。此研究套件包含以下指标:
- B2B付款的总数
- B2B付款的总额
- 进行跨境付款的企业数
这些指标针对以下主要市场提供:
- 国内B2B付款
- 跨境B2B付款
此数据也依支付方式分类:
- 现金
- 支票
- 卡
- 虚拟卡
- 电报汇款
- 即时支付
- 其他
此数据也按与小型、中型和大型公司的交易进行细分。
Juniper Research 的互动式预测 (Excel) 包含以下功能:
- 统计分析:统计分析:搜寻资料期间所有地区和国家显示的特定指标。图表易于编辑,并可汇出至剪贴簿。
- 国家/地区资料工具:此工具可让您查看预测期间所有地区和国家的指标。您可以使用搜寻栏缩小显示的指标范围。
- 国家比较工具:让您选择和比较各国。此工具包含汇出图表的功能。
- 假设分析:五个个互动式场景,让使用者比较不同的预测假设。
竞争排行榜报告
竞争排行榜报告透过两种供应商定位工具,对大型成熟供应商和新兴颠覆性供应商进行了详细的评估和市场定位。 Juniper Research 的竞争排行榜根据 19 家领先的 B2B 支付平台的能力,将其分为几组。
目标供应商包括以下 19 家公司:
|
|
|
该报告还包含一个“功能领导者指数”,该指数以可视化的方式展现了课题B2B支付市场主导地位的公司的竞争定位。
|
|
|
目录
市场趋势·策略
第1章 重要点和策略性建议
- 重要点
- 策略性建议
第2章 市场形势和市场区隔
- 定义和范围
- 主要趋势
- 课题
- 付款者,加盟店,PSP的一般性课题
- 资费带来的课题
- 解决方案和机遇
- 嵌入式金融与金融科技集成
- 供应链金融与营运资本解决方案
- 即时数据与分析
- 数位钱包与身分识别
- 协作生态系统
- 诈欺防制与强化安全措施
- 合规即服务
- 跨国 B2B 和境内 B2B 支付
- 国内B2B付款
- 跨境B2B付款
- B2B付款流通管道
- 即时付款/即时付款
- 支票
- 卡
- 不是即时的银行支付
- 区块链付款网路
- 中央银行数位货币(CBDC)
- 稳定币
- 附加价值服务
- 付款通知单财政
- AP/AR自动化
- 贸易金融
- 附加价值技术
- AI
- 付款的自动化
- 违法行为检测
- 外汇管理与全球结算
- 区块链
- CBDC
第3章 各国准备指数
- 各国准备指数:简介
- 地区分析
- 北美
- 美国
- 南美
- 阿根廷
- 巴西
- 西欧
- EU
- 英国
- 中欧·东欧
- 波兰
- 远东及中国
- 中国
- 日本
- 印度半岛
- 印度
- 其他亚太地区
- 澳洲
- 马来西亚
- 非洲和中东
- 奈及利亚
- 沙乌地阿拉伯
- 北美
竞争排行榜
第1章 Juniper Research的竞争的排行榜
第2章 竞争排行榜:企业简介
- 业者简介
- ACI Worldwide
- American Express
- Banking Circle
- CGI
- Discover
- ECS Fin
- Finastra
- FIS
- Fiserv
- Flutterwave
- IBM
- Mastercard
- Montran Corporation
- Ripple
- Spendesk
- Stripe
- SWIFT
- Visa
- Wise
- Juniper Research的排行榜评估手法
- 限制与解释
第3章 Juniper Research的Future Leaders Index
第4章 未来的领导者目录业者简介
- 业者简介
- 3S Money
- AccessPay
- Airwallex
- Apron
- Airwallex
- Apron
- Balance
- Billie
- Brex
- Hokodo
- Jeeves
- Jeeves
- Mondu
- Billie
- Pliant
- Routable
- Sila
- Spenmo
- Juniper Research的Future Leaders Index:评估手法
- 限制与解释
- 相关调查
资料·预测
第1章 市场形势
第2章 预测概要
- 总量
- 总合金额
- 支付流通管道
第3章 国内B2B付款预测
- 调查手法与假设
- 国内预测
- 国内B2B交易数量
- 国内B2B交易额
- 卡片付款
- 即时支付
- 国内付款流通管道
第4章 跨境B2B付款
- 调查手法与前提
- 跨国预测
- 交易数量
- 交易的价值
- 电报汇款
- 跨境付款流通管道
'B2B Payment Cross-border Transactions to Hit 18 Billion by 2030, as Cross-border Activity Intensifies Despite Tariffs'
| KEY STATISTICS | |
|---|---|
| Total transaction value in 2025: | $187tn |
| Total transaction value in 2030: | $224tn |
| 2025 to 2030 market growth: | 20% |
| Forecast period: | 2025-2030 |
Overview
Juniper Research's "B2B Payments" research suite provides a comprehensive and insightful analysis of this market; enabling stakeholders from B2B payment platform providers to regulators and banks, to understand future growth, key trends and the competitive environment.
The research suite includes several different options that can be purchased separately. The Market Trends & Strategies element includes an insightful analysis of the key areas of progress within B2B payments, including new payment types and automation systems. Additionally, it features Juniper Research's Country Readiness Index, which provides a country-level analysis of the current and future opportunities for B2B payments in 61 different geographies.
The Data & Forecasting element includes access to data mapping the adoption and future growth of the B2B payments market over the next five years, split by cross-border versus domestic transactions, by business size and by payment method.
Additionally, the Competitor Leaderboard document features two vendor positioning models: the Competitor Leaderboard, revealing an extensive analysis of the 19 market leaders in the B2B payments space, and a Future Leaders Index; covering the 18 leading innovators who are becoming important in the market.
The coverage can also be purchased as a full research suite containing the Market Trends & Strategies, Data & Forecasting, and Competitor Leaderboard & Future Leaders Index, and a substantial discount.
Collectively, these documents provide a critical tool for understanding this important market. They allow B2B payment platform providers and payments companies to shape their future strategy; capitalising on future growth opportunities. This research suite's extensive coverage makes it a valuable tool for navigating this market.
All report content is delivered in the English language.
Key Features
- Key Takeaways & Strategic Recommendations: In-depth analysis of key development opportunities, key findings and key strategic recommendations for B2B payment platforms, cross-border payment specialists, banks, and regulators.
- Market Outlook: A breakdown of the B2B payments market by its component segments, with insight into the relative challenges of domestic and cross-border payments. It also examines, in detail, a range of payment types. Value-added services are analysed; assessing their place in the market and what businesses are looking for from these services. The research examines key emerging technologies in the B2B payments market, how they are used in the market, and how they will affect the market in the future. A Country Readiness Index is also included; assessing growth prospects for B2B payments across 61 key countries.
- Benchmark Industry Forecasts: Extensive forecasts for the number and value of B2B payments, split by domestic and cross-border. This is further split by payment channel (cash, cheque, card, virtual card, wire transfer, instant payment, and other means) and by business size (small, medium, and large).
- Juniper Research Competitor Leaderboard & Future Leaders Index: Key player capability and capacity assessment for 19 B2B payment platforms, via the Juniper Research Competitor Leaderboard. The study also contains a Future Leaders Index; positioning 18 key emerging players shaking up the B2B payments market.
SAMPLE VIEW
Market Data & Forecasting Report
The numbers tell you what's happening, but our written report details why, alongside the methodologies.
SAMPLE VIEW
Market Trends & Strategies Report
A comprehensive analysis of the current market landscape, alongside strategic recommendations.
Market Data & Forecasting Report
The market-leading research suite for the "B2B Payments" market includes access to the full set of forecast data of 158 tables and over 61,000 datapoints. Metrics in the research suite include:
- Total Number of B2B Payments
- Total Value of B2B Payments
- Number of Businesses Making Cross-border Payments
These metrics are provided for the following key market verticals:
- Domestic B2B Payments
- Cross-border B2B Payments
This data is also split by the following payment methods:
- Cash
- Cheque
- Card
- Virtual Card
- Wire Transfer
- Instant Payment
- Other Means
The data is also split by transactions being made by small, medium, and large businesses.
Juniper Research Interactive Forecast Excel contains the following functionality:
- Statistics Analysis: Users benefit from the ability to search for specific metrics, displayed for all regions and countries across the data period. Graphs are easily modified and can be exported to the clipboard.
- Country Data Tool: This tool enables users to look at metrics for all regions and countries in the forecast period. Users can refine the metrics displayed via a search bar.
- Country Comparison Tool: Users can select and compare countries. The ability to export graphs is included in this tool.
- What-if Analysis: Here, users can compare forecast metrics against their own assumptions, via 5 interactive scenarios.
Market Trends & Strategies Report
This report examines the "B2B Payments" market landscape in detail; assessing market trends and factors shaping the evolution of this growing market. The report delivers comprehensive analysis of the strategic opportunities in the B2B payments landscape; assessing key market segments, including real-time payments, A2A payments, credit card and debit cards, virtual cards, and other digital payment methods. It also examines their challenges and opportunities, such as the impact of the Trump Administration's tariffs and other economic policies. The report includes evaluation of key country-level opportunities for B2B payments growth; looking at the unique nature of individual B2B payment markets, from new real-time payment rails to the emergence of stablecoins for cross-border transactions.
Competitor Leaderboard Report
The Competitor Leaderboard report provides a detailed evaluation and market positioning for both the larger, established vendors, as well as for the newer, emerging disruptors: via two different vendor positioning tools. The Juniper Research Competitor Leaderboard offers coverage of 19 leading B2B payment platforms; positioning them as established leaders, leading challengers, or disruptors and challengers, based on capacity and capability assessments.
The 19 vendors included are:
|
|
|
The document also features a Feature Leaders Index. The Juniper Research Future Leaders Index provides a visual representation of the competitive positioning of companies in the B2B payments market which are challenging dominant players.
The 18 innovators included are:
|
|
|
Together, the Competitor Leaderboard and the Future Leaders Index give a comprehensive guide to the competitive landscape within B2B payments; providing an important resource for stakeholders.
Table of Contents
Market Trends & Strategies
1. Key Takeaways & Strategic Recommendations
- 1.1. Key Takeaways
- 1.2. Strategic Recommendations
2. Market Landscape & Segmentation
- 2.1. Introduction
- 2.1.1. The Context
- 2.2. Definition & Scope
- 2.3 Key Trends
- 2.3.1. Electronic Payments Increasingly Replacing Paper Cheques
- 2.3.2. Embedded Finance Drives Efficiency and Growth
- 2.3.3. Shift to Real-time Payments
- 2.3.4. A2A (Account-to-account) Payments
- 2.3.5. Pay by Bank and Instant Payments
- 2.3.6. Rise of Virtual Cards
- 2.3.7. Rising Levels of Automation
- 2.4. Challenges
- 2.4.1. General Challenges for Payers, Merchants and PSPs
- i. Fragmented Payment Workflows & Reconciliation Complexity
- ii. Payment Delays
- iii. Lack of Transparency
- iv. Cybersecurity & Fraud Risk
- v. Regulatory Compliance
- vi. Resistance to Technology Adoption
- 2.4.1. General Challenges for Payers, Merchants and PSPs
- 2.5. Challenges Induced by Tariffs
- Table 2.1: Impact of Tariffs for B2B Payment Stakeholders
- Figure 2.2: Impact of Tariffs for B2B Payment Stakeholders
- i. The Domestic Impact of Tariffs
- ii. Cross-border Impact of Tariffs
- 2.6. Solutions & Opportunities
- 2.6.1. Embedded Finance & Fintech Integration
- 2.6.2. Supply Chain Financing & Working Capital Solutions
- i. Enhanced Cashflow Management
- ii. Flexible Payment Options
- 2.6.3. Real-time Data & Analytics
- i. Services Consolidation
- 2.6.4. Digital Wallets and Identity
- 2.6.5. Collaborative Ecosystems
- 2.6.6. Fraud Prevention & Enhanced Security Measures
- 2.6.7. Compliance-as-a-service
- 2.7. Cross-border Versus Domestic B2B Payments
- 2.7.1. Domestic B2B Payments
- i. Automation
- ii. Data-driven Payment Decisions
- 2.7.2. Cross-border B2B Payments
- i. Seamless Cross-border Transactions
- ii. Interoperability
- 2.7.1. Domestic B2B Payments
- 2.8. B2B Payments Channels
- 2.8.1. Real-time Payments/Instant Payments
- 2.8.2. Cheques
- 2.8.3. Cards
- i. Corporate Cards
- ii. Virtual Cards
- 2.8.4. Non-instant Bank Payments
- 2.8.5. Blockchain Payment Networks
- 2.8.6. Central Bank Digital Currencies (CBDCs)
- 2.8.7. Stablecoins
- 2.9. Value-added Services
- 2.9.1. Invoice Financing
- 2.9.2. AP/AR Automation
- 2.9.3. Trade Financing
- 2.10. Value-added Technologies
- 2.10.1. AI
- 2.10.2. Payment Automation
- 2.10.3. Fraud Detection
- 2.10.4. FX Management and Global Payments
- 2.10.5. Blockchain
- 2.10.6. CBDCs
3. Country Readiness Index
- 3.1. Introduction to the Country Readiness Index
- Figure 3.1: Juniper Research's Country Readiness Index Scoring Criteria: B2B Payments
- Figure 3.2: Juniper Research Country Readiness Index: B2B Payments
- Figure 3.3: B2B Payments Country Readiness Index: Market Segments
- 3.2. Regional Analysis
- 3.2.1. North America
- i. US
- 3.2.2. Latin America
- i. Argentina
- ii. Brazil
- 3.2.3. West Europe
- i. EU
- ii. UK
- 3.2.4. Central & East Europe
- i. Poland
- 3.2.5. Far East & China
- i. China
- ii. Japan
- 3.2.6. Indian Subcontinent
- i. India
- 3.2.7. Rest of Asia Pacific
- i. Australia
- ii. Malaysia
- 3.2.8. Africa & Middle East
- i. Nigeria
- ii. Saudi Arabia
- Figure 3.4: Juniper Research's Country Readiness Index Heatmap: North America
- Figure 3.5: Juniper Research's Country Readiness Index Heatmap: Latin America
- Figure 3.6: Juniper Research's Country Readiness Index Heatmap: West Europe60
- Figure 3.7: Juniper Research's Country Readiness Index Heatmap: Central and East Europe
- Figure 3.8: Juniper Research's Country Readiness Index Heatmap: Far East & China
- Figure 3.9: Juniper Research's Country Readiness Index Heatmap: Indian Subcontinent
- Figure 3.10: Juniper Research's Country Readiness Index Heatmap: Rest of Asia Pacific
- Figure 3.11: Juniper Research's Country Readiness Index Heatmap: Africa and Middle East
- 3.2.1. North America
Competitor Leaderboard
1. Juniper Research Competitor Leaderboard
- 1.1. Why Read This Report
- Table 1.1: Juniper Research's Competitor Leaderboard: B2B Payments Vendors Included & Product Portfolio
- Figure 1.2: Juniper Research's Competitor Leaderboard for B2B Payments
- Table 1.3: Juniper Research B2B Payments Vendors & Positioning
- Table 1.4: Juniper Research's Competitor Leaderboard Heatmap B2B Payments Vendors (Part 1 of 2)
- Table 1.4: Juniper Research's Competitor Leaderboard Heatmap B2B Payments Vendors (Part 2 of 2)
2. Competitor Leaderboard Company Profiles
- 2.1. Vendor Profiles
- 2.1.1. ACI Worldwide
- i. Corporate
- Table 2.1: ACI Worldwide's Financial Snapshot ($m), 2022-2024
- ii. Geographical Spread
- iii. Key Clients & Strategic Partnerships
- iv. High-level View of Offerings
- v. Juniper Research's View: Key Strengths & Strategic Development Opportunities
- i. Corporate
- 2.1.2. American Express
- i. Corporate
- Table 2.2: American Express' Financial Snapshot ($m), 2022-2024
- ii. Geographical Spread
- iii. Key Clients & Strategic Partnerships
- iv. High-level View of Offerings
- v. Juniper Research's View: Key Strengths & Strategic Development Opportunities
- i. Corporate
- 2.1.3. Banking Circle
- i. Corporate
- ii. Geographical Spread
- iii. Key Clients & Strategic Partnerships
- iv. High-level View of Offerings
- v. Juniper Research's View: Key Strengths & Strategic Development Opportunities
- 2.1.4. CGI
- i. Corporate
- Table 2.3: CGI's Financial Snapshot ($m), 2022-2024
- ii. Geographical Spread
- iii. Key Clients & Strategic Partnerships
- iv. High-level View of Offerings
- Figure 2.4: CGI's All Payments Solution
- v. Juniper Research's View: Key Strengths & Strategic Development Opportunities
- i. Corporate
- 2.1.5. Discover
- i. Corporate
- Table 2.5: Discover's Financial Snapshot ($m), 2022-2024
- ii. Geographical Spread
- iii. Key Clients & Strategic Partnerships
- iv. High-level View of Offerings
- v. Juniper Research's View: Key Strengths & Strategic Development Opportunities
- i. Corporate
- 2.1.6. ECS Fin
- i. Corporate
- ii. Geographical Spread
- iii. Key Clients & Strategic Partnerships
- iv. High-level View of Offerings
- v. Juniper Research's View: Key Strengths & Strategic Development Opportunities
- 2.1.7. Finastra
- i. Corporate
- ii. Geographical Spread
- iii. Key Clients & Strategic Partnerships
- iv. High-level View of Offerings
- v. Juniper Research's View: Key Strengths & Strategic Development Opportunities
- 2.1.8. FIS
- i. Corporate
- Figure 2.6: FIS' Financial Snapshot ($m), 2022-2024
- ii. Geographical Spread
- iii. Key Clients & Strategic Partnerships
- iv. High-level View of Offerings
- v. Juniper Research's View: Key Strengths & Strategic Development Opportunities
- i. Corporate
- 2.1.9. Fiserv
- i. Corporate
- Table 2.7: Fiserv's Financial Snapshot ($m), 2022-2024
- ii. Geographical Spread
- iii. Key Clients & Strategic Partnerships
- iv. High-level View of Offerings
- v. Juniper Research's View: Key Strengths & Strategic Development Opportunities
- i. Corporate
- 2.1.10. Flutterwave
- i. Corporate
- Table 2.8: Flutterwave's Rounds of Funding ($m), 2017-2022
- ii. Geographical Spread
- iii. Key Clients & Strategic Partnerships
- iv. High-level View of Offerings
- v. Juniper Research's View: Key Strengths & Strategic Development Opportunities
- i. Corporate
- 2.1.11. IBM
- i. Corporate
- Table 2.9: IBM's Financial Snapshot ($m), 2022-2024
- ii. Geographical Spread
- iii. Key Clients & Strategic Partnerships
- iv. High-level View of Offerings
- v. Juniper Research's View: Key Strengths & Strategic Development Opportunities
- i. Corporate
- 2.1.12. Mastercard
- i. Corporate
- Table 2.10: Mastercard's Financial Snapshot ($m), 2022-2024
- ii. Geographical Spread
- iii. Key Clients & Strategic Partnerships
- iv. High-level View of Offerings
- v. Juniper Research's View: Key Strengths & Strategic Development Opportunities
- i. Corporate
- 2.1.13. Montran Corporation
- i. Corporate
- ii. Geographical Spread
- iii. Key Clients & Strategic Partnerships
- iv. High-level View of Offerings
- v. Juniper Research's View: Key Strengths & Strategic Development Opportunities
- 2.1.14. Ripple
- i. Corporate
- Figure 2.11: Ripple's Funding Rounds ($m), 2015-2019
- ii. Geographical Spread
- iii. Key Clients & Strategic Partnerships
- iv. High-level View of Offerings
- Figure 2.12: How Ripple's Cross-border Payments Work
- v. Juniper Research's View: Key Strengths & Strategic Development Opportunities
- i. Corporate
- 2.1.15. Spendesk
- i. Corporate
- Table 2.13: Spendesk's Funding Rounds ($m), 2017-2022
- ii. Geographical Spread
- iii. Key Clients & Strategic Partnerships
- iv. High-level View of Offerings
- v. Juniper Research's View: Key Strengths & Strategic Development Opportunities
- i. Corporate
- 2.1.16. Stripe
- i. Corporate
- Table 2.14: Stripe's Funding Rounds ($m), 2019-2023
- ii. Geographical Spread
- iii. Key Clients & Strategic Partnerships
- iv. High-level View of Offerings
- v. Juniper Research's View: Key Strengths & Strategic Development Opportunities
- i. Corporate
- 2.1.17. SWIFT
- i. Corporate
- Table 2.15: SWIFT's Financial Snapshot ($m), 2021-2023
- ii. Geographical Spread
- iii. Key Clients & Strategic Partnerships
- iv. High-level View of Offerings
- v. Juniper Research's View: Key Strengths & Strategic Development Opportunities
- i. Corporate
- 2.1.18. Visa
- i. Corporate
- Table 2.16: Visa's Financial Snapshot ($m), 2022-2024
- ii. Geographical Spread
- iii. Key Clients & Strategic Partnerships
- iv. High-level View of Offerings
- Figure 2.17: How Visa B2B Connect Works
- v. Juniper Research's View: Key Strengths & Strategic Development Opportunities
- i. Corporate
- 2.1.19. Wise
- i. Corporate
- Figure 2.18: Wise's Financial Snapshot ($m), 2022-2024
- ii. Geographical Spread
- iii. Key Clients & Strategic Partnerships
- iv. High-level View of Offerings
- v. Juniper Research's View: Key Strengths & Strategic Development Opportunities
- i. Corporate
- 2.1.1. ACI Worldwide
- 2.2. Juniper Research Competitor Leaderboard Assessment Methodology
- 2.2.1. Limitations & Interpretations
- Table 2.19: Juniper Research's Competitor Leaderboard Scoring Criteria - B2B Payments
- 2.2.1. Limitations & Interpretations
3. Juniper Research Future Leaders Index
- Table 3.1: Juniper Research Future Leaders Index - B2B Payments Vendors & Product Portfolio
- Figure 3.2: Juniper Research Future Leaders Index - B2B Payments
- Table 3.3: Juniper Research Future Leaders Index Ranking - B2B Payments
- Table 3.4: Juniper Research Future Leaders Index - B2B Payments Heatmap
4. Future Leaders Index Vendor Profiles
- 4.1. Vendor Profiles
- 4.1.1. 3S Money
- i. Corporate
- ii. Geographical Spread
- iii. Key Clients & Strategic Partnerships
- iv. High-level View of Offerings
- v. Juniper Research's View: Key Strengths & Strategic Development Opportunities
- 4.1.2. AccessPay
- i. Corporate
- ii. Geographical Spread
- iii. Key Clients & Strategic Partnerships
- iv. High-level View of Offerings
- v. Juniper Research's View: Key Strengths & Strategic Development Opportunities
- 4.1.3. Airwallex
- i. Corporate
- Table 4.1: Airwallex's Rounds of Funding ($m), 2018-2025
- ii. Geographical Spread
- iii. Key Clients & Strategic Partnerships
- iv. High level View of Offerings
- v. Juniper Research's View: Key Strengths & Strategic Development Opportunities
- i. Corporate
- 4.1.4. Apron
- i. Corporate
- ii. Geographical Spread
- iii. Key Clients & Strategic Partnerships
- iv. High-level View of Offerings
- v. Juniper Research's View: Key Strengths & Strategic Development Opportunities
- 4.1.5. Aria
- i. Corporate
- ii. Geographical Spread
- iii. Key Clients & Strategic Partnerships
- iv. High-level View of Offerings
- v. Juniper Research's View: Key Strengths & Strategic Development Opportunities
- 4.1.6. Autobooks
- i. Corporate
- ii. Geographical Spread
- iii. Key Clients & Strategic Partnerships
- iv. High-level View of Offerings
- v. Juniper Research's View: Key Strengths & Strategic Development Opportunities
- 4.1.7. Balance
- i. Corporate
- ii. Geographical Spread
- iii. Key Clients & Strategic Partnerships
- iv. High-level View of Offerings
- v. Juniper Research's View: Key Strengths & Strategic Development Opportunities
- 4.1.8. Billie
- i. Corporate
- ii. Geographical Spread
- iii. Key Clients & Strategic Partnerships
- iv. High-level View of Offerings
- v. Juniper Research's View: Key Strengths & Strategic Development Opportunities
- 4.1.9. Brex
- i. Corporate
- Table 4.2: Brex's Funding Rounds ($m), 2018-2022
- ii. Geographical Spread
- iii. Key Clients & Strategic Partnerships
- iv. High-level View of Offerings
- v. Juniper Research's View: Key Strengths & Strategic Development Opportunities
- i. Corporate
- 4.1.10. Hokodo
- i. Corporate
- ii. Geographical Spread
- iii. Key Clients & Strategic Partnerships
- iv. High-level View of Offerings
- v. Juniper Research's View: Key Strengths & Strategic Development Opportunities
- 4.1.11. Jeeves
- i. Corporate
- ii. Geographical Spread
- iii. Key Clients & Strategic Partnerships
- iv. High-level View of Offerings
- v. Juniper Research's View: Key Strengths & Strategic Development Opportunities
- 4.1.12. Modulr
- i. Corporate
- ii. Geographical Spread
- iii. Key Clients & Strategic Partnerships
- iv. High-level View of Offerings
- v. Juniper Research's View: Key Strengths & Strategic Development Opportunities
- 4.1.13. Mondu
- i. Corporate
- ii. Geographical Spread
- iii. Key Clients & Strategic Partnerships
- iv. High-level View of Offerings
- v. Juniper Research's View: Key Strengths & Strategic Development Opportunities
- 4.1.14. Paytron
- i. Corporate
- ii. Geographical Spread
- iii. Key Clients & Strategic Partnerships
- iv. High-level View of Offerings
- v. Juniper Research's View: Key Strengths & Strategic Development Opportunities
- 4.1.15. Pliant
- i. Corporate
- Table 4.3: Pliant's Rounds of Funding ($m), 2021-2025
- ii. Geographical Spread
- iii. Key Clients & Strategic Partnerships
- High-level View of Offerings
- iv. Juniper Research's View: Key Strengths & Strategic Development Opportunities
- i. Corporate
- 4.1.16. Routable
- i. Corporate
- ii. Geographical Spread
- iii. Key Clients & Strategic Partnerships
- iv. High-level View of Offerings
- v. Juniper Research's View: Key Strengths & Strategic Development Opportunities
- 4.1.17. Sila
- i. Corporate
- ii. Geographical Spread
- iii. Key Clients & Strategic Partnerships
- iv. High-level View of Offerings
- v. Juniper Research's View: Key Strengths & Strategic Development Opportunities
- 4.1.18. Spenmo
- i. Corporate
- ii. Geographical Spread
- iii. Key Clients & Strategic Partnerships
- iv. High-level View of Offerings
- v. Juniper Research's View: Key Strengths & Strategic Development Opportunities
- 4.1.1. 3S Money
- 4.2. Juniper Research Future Leaders Index Assessment Methodology
- 4.3. Limitations & Interpretations
- Table 4.5: Juniper Research Future Leaders Index: B2B Payments Criteria
- 4.4. Related Research
Data & Forecasting
1. Market Landscape
- 1.1. Introduction
- 1.2. Definitions
- Figure 1.1: Juniper Research's 8 Key Regions - Definition
2. Forecast Overview
- 2.1. Total Volume
- Figure & Table 2.1: Total Volume of B2B Payments (m), Split by 8 Key Regions, 2025-2030
- 2.2. Total Value
- Figure & Table 2.2: Total Value of B2B Payments ($m), Split by 8 Key Regions, 2025-2030
- 2.3. Payment Channel
- Figure & Table 2.3: Total Value of B2B Payments ($m), Split by Payment Channel, 2025-2030
3. Domestic B2B Payments Forecast
- 3.1. Introduction
- 3.2. Methodology and Assumptions
- Figure 3.1: B2B Domestic Payments Market - Forecast Methodology
- 3.3. Domestic Forecasts
- 3.3.1. Number of Domestic B2B Transactions
- Figure & Table 3.2: Number of Domestic B2B Payments per annum (m), Split by 8 Key Regions, 2025-2030
- 3.3.2. Value of Domestic B2B Transactions
- Figure & Table 3.3: Total Value of B2B Domestic Payments ($m), Split by 8 Key Regions, 2025-2030
- 3.3.3. Card Payments
- Figure & Table 3.4: Total Value of Domestic B2B Payments via Card ($m), Split by 8 Key Regions, 2025-2030
- 3.3.4. Instant Payments
- Figure & Table 3.5: Total Value of Domestic B2B Payments via Instant Payments ($m), Split by 8 Key Regions, 2025-2030
- 3.3.5. Domestic Payment Channels
- Figure & Table 3.6: Total Value of Domestic B2B Payments ($m), Split by Payment Channel, 2025-2030
- 3.3.1. Number of Domestic B2B Transactions
4. Cross-border B2B Payments
- 4.1. Introduction
- 4.2. Methodology & Assumptions
- Figure 4.1: B2B Cross-border B2B Payments - Forecast Methodology
- 4.3. Cross-border Forecasts
- 4.3.1. Number of Transactions
- Figure & Table 4.2: Total Number of Outflow Cross-border B2B Payments per annum (m), Split by 8 Key Regions, 2025-2030
- 4.3.2. Value of Transactions
- Figure & Table 4.3: Total Value of Cross-border Outflow Payments ($m), Split by 8 Key Regions, 2025-2030
- 4.3.3. Wire Transfer
- Figure & Table 4.4: Total Value of Cross-border Payments via Wire Transfer ($m), Split by 8 Key Regions, 2024-2030
- 4.3.4. Cross-border Payments Channels
- Figure & Table 4.5: Total Value of Cross-border B2B Payments ($m), Split by Payments Channel, 2025-2030
- 4.3.1. Number of Transactions
 2026年全球全平台游戏手把市场报告
 B2B支付市场:按类型、支付方式、公司规模及最终用户产业划分-2026-2032年全球市场预测
 B2B支付市场规模、份额、成长及全球产业分析:按类型、应用和地区分類的洞察,以及2026-2034年的预测
 B2B支付市场规模、份额、趋势和预测(按支付类型、支付方式、公司规模、行业和地区划分,2026-2034年)全方位金融服务平台市场(按服务类型、客户类型、组织规模、部署类型和分销管道划分)-2026-2032年全球预测出口保证平台市场按产品类型、保固期、风险类别、最终用户产业和通路划分,全球预测(2026-2032年)全球B2B支付市场(2024-2030年)
 B2B支付市场规模、份额和成长分析(按支付类型、支付方式、支付方法、行业垂直领域、公司规模和地区划分)-2026-2033年行业预测亚太地区B2B支付,2025-2030年
 2032 年 B2B 金融科技与企业银行市场预测:按解决方案类型、公司规模、最终用户和地区进行的全球分析