


 |
市场调查报告书
商品编码
1808070
智慧电网市场:2025-2030年Smart Grid Market: 2025-2030 |
||||||
"在虚拟发电厂的推动下,到2030年,智慧电网将支援全球43%的电力供应"
| 主要统计 | |
|---|---|
| 2025年的全球智慧电网普及率 | 24.2% |
| 2030年的全球智慧电网普及率 | 42.7% |
| 2030年的全球智慧电表出货数 | 26亿 |
| 预测期间 | 2025-2030年 |
概述
本研究套件提供了对全球能源转型前沿的智慧电网市场的全面了解。我们探讨了改变该行业的关键颠覆性因素,从分散式能源资源的整合和虚拟发电厂的兴起,到人工智慧驱动的智慧化日益重要的作用,以及对强大网路安全和合规性日益增长的需求。我们也重点介绍了新兴市场如何推动下一波智慧电錶成长,并透过超越传统基础设施来加速电网现代化。
该套件提供对趋势和挑战的深入分析,以及明确的建议和机会评估,确保供应商能够将产业变化转化为可行的策略。我们为利害关係人提供量化智慧电网市场潜力和社会经济影响所需的洞察。此外,我们的竞争力排行榜对15家领先的智慧电网供应商进行了独家评估。
报告内容均为英语。
主要的特征
- 国家准备指数:提供评估全球 60 多个市场智慧电网成熟度和投资潜力的基准。该指数可协助供应商和公用事业公司识别具有即时性的市场和需要长期发展的市场。它还透过将采用与监管环境、政策支援和基础设施发展相结合,为确定市场准入和投资策略的优先顺序提供路线图。
- 市场趋势与机会:对重塑智慧电网的技术、监管和商业因素进行深入评估。它分析了分散式能源 (DER)、虚拟发电厂 (VPP) 和人工智慧驱动的智能,以及不断变化的消费者和产消者行为的影响。这些见解与策略建议直接相关,帮助供应商和公用事业公司将趋势转化为机会,同时降低采用过程中的风险和障碍。
- 全面的产业预测:提供五年市场规模和预测,涵盖部署、收入、能源成本节约和减排。本报告按智慧电錶连接技术(4G、5G、LTE-M、NB-IoT)及其相关收入进行详细细分,为供应商提供清晰的洞察,帮助他们了解不断变化的需求、未来发展趋势,以及如何根据市场机会调整产品路线图。
- Juniper Research 竞争力排行榜:对 15 家领先的智慧电网供应商进行独立评估,分析其优势、创新和整体市场影响力,从而识别行业领导者和挑战者。
样品view
市场资料·预测报告
样品
市场趋势·策略报告
市场数据与预测报告
本研究套件包含 49 个表格和超过 21,500 个资料点的完整市场预测资料。
- 智慧电网
- 智慧电网应用完成率 (%)
- 智慧电网软体收入
- 智慧电网节能量 (TWh)
- 智慧电网能源成本节省
- 智慧电网减量 (MMT CO2e)
- 智慧电网排放成本节省
- 智慧电錶:
- 运作中的智慧电錶数量
- 智慧电錶出货量
- 支援蜂窝网路的智慧电錶数量
- 智慧电錶资料使用量 (PB)
- 智慧电錶 SIM 卡 (%) 与连线收入 (美元)
- 2G
- 3G
- 4G
- 5G
- LTE-M
- NB-IoT
- 智慧电表硬体设备收益
Juniper Research 互动式预测 (Excel):
- 统计分析:显示预测期间所有地区和国家的资料。图表可轻鬆修改并汇出至剪贴簿。
- 国家/地区资料工具:此工具可让您查看预测期间内所有主要地区和国家/地区的指标。您可以使用搜寻栏缩小显示的指标范围。
- 国家比较工具:选择不同的国家进行比较。此工具包含汇出图表的功能。
- 假设分析:透过五个互动式情境将预测指标与您自己的假设进行比较。
竞争排行榜报告
主要企业:
|
|
|
目录
市场趋势·策略
第1章 重要点和策略性建议
- 重要点
- 策略性建议
第2章 市场形势
- 智慧电网定义
- 概要
- 全球招募
- 关注市场
- 财务预测
- 消费者和公共事业对产业的影响
- 实行技术
- 全球招募
第3章 趋势,课题,机会
- 新的趋势
- 人工智慧驱动的电网自动化与决策
- 概述
- 人工智慧相关智慧电网专利数量成长
- 资料管理与品质
- 人工智慧系统的能耗
- 进阶计量基础设施 (AMI)
- 概述
- 客户互动能力
- 具有动态定价和即时支付功能的负载测量
- 采用差距与数位包容性
- 分散式能源 (DER)
- 概述
- 主要的分散式能源
- 先进的控制与编排平台
- 资料互通性
- 再生能源
- 概述
- 再生能源 + 储能混合系统
- 电网整形逆变器
- 预测准确度和可预测性
- 虚拟发电厂 (VPP)
- 概述
- 产业耦合(跨部门协作)
- 跨国虚拟发电厂
- 经济可行性与商业模式
- 人工智慧驱动的电网自动化与决策
- 主要课题
- 网路安全
- 概述
- 标准和协定不匹配
- 零信任
- 监管复杂性和合规性
- 概述
- 电网碎片化
- 新兴合规工具
- 资料隐私与消费者信任
- 概述
- 安全风险
- 维护隐私
- 合成数据
- 网路安全
- 利害关係人机遇
- 公用事业和电网营运商
- 技术提供者和製造商
- 政策制定者和监管机构
- 投资者和专案开发商
第4章 各国准备指数
- 焦点市场
- 主要的特征
- 关注市场
- 相关利益者的策略性建议
- 成长市场
- 主要的特征
- 关注市场
- 相关利益者的策略性建议
- 饱和市场
- 主要的特征
- 关注市场
- 相关利益者的策略性建议
- 新兴国家市场
- 主要的特征
- 关注市场
- 相关利益者的策略性建议
- 地区热图
註脚
竞争排行榜
第1章 智慧电网的竞争排行榜
第2章 业者简介
- ABB
- Cisco Systems
- Eaton
- Fujitsu
- GE Vernova
- Hitachi Energy
- Honeywell
- IBM
- Itron
- Landis+Gyr
- Oracle
- Panasonic
- Schneider Electric
- Siemens
- Tantalus
第3章 调查手法
- 竞争排行榜调查手法
- 限制与解释
- 相关调查
註脚
资料·预测
第1章 市场形势
- 智慧电网定义
- 概要
- 全球招募
- 关注市场
- 财务预测
- 消费者和公共事业经营者的影响
- 实行技术
- 全球招募
第2章 智慧电网市场预测
- 预测手法与前提条件
- 智慧电网的引进率
- 智慧电网软体收益
- 智慧电网的能源削减数量
- 智慧电网的能源降低成本额
- 智慧电网的排放削减数量
- 智慧电网的排放降低成本额
第3章 智慧电表市场预测
- 预测手法与前提条件
- 智慧电表的运作情形
- 智慧电表的出货数
- 蜂巢式智慧电表
- 智慧电表SIM
- 智慧电表资料使用数量
- 智慧电表收益
- 智慧电表硬体设备收益
- 智慧电表连接收益
'Smart Grids to Support 43% of Global Electricity Supply by 2030, Driven by Virtual Power Plants'
| KEY STATISTICS | |
|---|---|
| Global smart grid coverage in 2025: | 24.2% |
| Global smart grid coverage by 2030: | 42.7% |
| Smart meter shipments globally by 2030: | 2.6bn |
| Forecast period: | 2025-2030 |
Overview
Our cutting-edge "Smart Grid" research suite provides a comprehensive view of a market at the forefront of the global energy transition. It examines the major disruptions transforming the sector, from the integration of distributed energy resources and the rise of virtual power plants to the growing role of AI-driven intelligence and the mounting need for robust cyber security and compliance. It also highlights how emerging markets are driving the next wave of smart metering growth; leapfrogging legacy infrastructure to accelerate grid modernisation.
The suite combines detailed analysis of trends and challenges with clear recommendations and opportunity appraisals throughout; ensuring vendors can translate industry shifts into actionable strategies. It is supported by robust datasets covering grid deployment, associated revenue, energy cost savings, and avoided emissions; giving stakeholders the insights they need to quantify smart grids' market potential and socioeconomic impact.
Alongside this, the Competitor Leaderboard offers an independent evaluation of 15 leading smart grid vendors; highlighting the capabilities that set market leaders apart and the strategies challengers must adopt to compete.
Available as individual components, or as a complete package at a discounted rate, our smart grid research suite equips stakeholders with the intelligence required to succeed in a market that is being reshaped by decentralisation, prosumer participation, and intelligent grid management.
All report content is delivered in the English language.
Key Features
- Country Readiness Index: Benchmarks for 60+ markets worldwide; assessing smart grids' maturity and investment potential. This enables vendors and utilities to identify markets primed for immediate opportunity versus long-term development. By mapping deployment levels against regulatory environments, policy support, and infrastructure readiness, this Index offers a clear roadmap for prioritising market entry and investment strategies.
- Market Trends & Opportunities: In-depth appraisal of the technological, regulatory, and commercial forces reshaping the smart grid. It explores the impact of distributed energy resources, virtual power plants, and AI-driven intelligence, alongside evolving consumer and prosumer behaviour. These insights are tied directly to strategic recommendations; helping vendors and utilities turn trends into opportunities while mitigating risks and adoption barriers.
- Comprehensive Industry Forecasts: 5-year market sizing and forecasts covering deployment, revenue, energy cost savings, and emissions reductions. Includes detailed splits by smart meter connectivity technologies (4G, 5G, LTE-M, NB-IoT), and associated revenue; giving vendors clear insight into shifting demand, future roll-outs, and how to align product roadmaps with market opportunity.
- Juniper Research Competitor Leaderboard: Independent evaluation of 15 leading smart grid vendors; assessing their strengths, innovations, and overall market impact to identify the sector's leaders and challengers.
SAMPLE VIEW
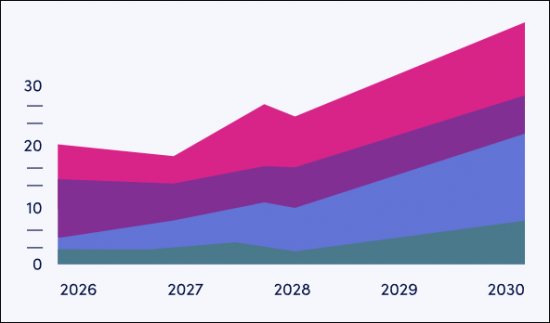
Market Data & Forecasting Report
The numbers tell you what's happening, but our written report details why, alongside the methodologies.
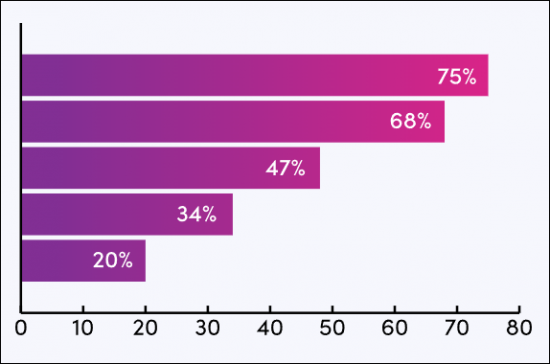
SAMPLE VIEW
Market Trends & Strategies Report
A comprehensive analysis of the current market landscape, alongside strategic recommendations.
Market Data & Forecasting Report
The market-leading research suite for the "Smart Grid" market includes access to the full set of market forecast data of 49 tables and more than 21,500 datapoints.
Metrics in the research suite include:
- Smart Grid:
- Smart Grid Completion (%)
- Smart Grid Software Revenue ($m)
- Smart Grid Energy Savings (TWh)
- Smart Grid Energy Cost Savings ($m)
- Smart Grid Emissions Savings (MMT CO2e)
- Smart Grid Emissions Cost Savings ($m)
- Smart Metering:
- Smart Meters in Service (m)
- Smart Meter Shipments (m)
- Cellular Smart Meters (m)
- Smart Meter Data Usage (PB)
- Smart Meter SIMs (%) and Connectivity Revenue ($m), both split by:
- 2G
- 3G
- 4G
- 5G
- LTE-M
- NB-IoT
- Smart Meter Hardware Revenue ($m)
Juniper Research's Interactive Forecast Excel contains the following functionality:
- Statistics Analysis: Users benefit from the ability to search for specific metrics; displayed for all regions and countries across the data period. Graphs are easily modified and can be exported to the clipboard.
- Country Data Tool: This tool lets users look at metrics for all key regions and countries in the forecast period. Users can refine the metrics displayed via a search bar.
- Country Comparison Tool: Users can select and compare different countries. The ability to export graphs is included in this tool.
- What-if Analysis: Here, users can compare forecast metrics against their own assumptions, via five interactive scenarios.
Market Trends & Strategies Report
This report provides an in-depth assessment of the "Smart Grid" landscape; analysing the technological, regulatory and commercial forces that will shape the sector over the next five years. It examines the impact of distributed energy resources, virtual power plants, AI-driven grid intelligence, and cyber security, alongside evolving consumer and prosumer behaviour; highlighting how these trends will drive change across the market.
The study ties emerging challenges directly to strategic recommendations; ensuring vendors and utilities can translate disruption into actionable opportunities. It identifies the partnerships, business models, and technology pathways that will prove most effective, while also providing guidance on how stakeholders can overcome regulatory and operational barriers.
Competitor Leaderboard Report
This "Smart Grid" market study includes a Competitor Leaderboard report; providing detailed evaluation and market positioning of 15 smart grid vendors. The vendors are positioned as established leaders, leading challengers, or disruptors and challengers, based on product and capability assessments.
Juniper Research's Competitor Leaderboard for Smart Grid includes the following key players:
|
|
|
This report is centred around the Juniper Research Competitor Leaderboard; a vendor positioning tool that provides an at-a-glance view of the competitive landscape in a market, backed by robust methodology.
Table of Contents
Market Trends & Strategies
1. Key Takeaways & Strategic Recommendations
- 1.1. Key Takeaways
- 1.2. Strategic Recommendations
2. Market Landscape
- 2.1. Introduction
- 2.2. Defining the Smart Grid
- 2.3. Overview
- 2.3.1. Global Adoption
- Figure 2.1: Regional Breakdown of Smart Meters in Service by 2030
- i. Markets to Watch
- 2.3.2. Financial Outlook
- Figure 2.2: Smart Grid Software Revenue ($m), Split by 8 Key Regions, 2025-2030
- 2.3.3. Impact on Consumers & Utilities
- Figure 2.3: Regional Breakdown of Smart Grid Emissions Cost Savings by 2030
- 2.3.4. Enabling Technologies
- Figure 2.4: Smart Meter SIMs (m), Split by Technology, 2025-2030
- 2.3.1. Global Adoption
3. Trends, Challenges & Opportunities
- 3.1. Introduction
- 3.2. Emerging Trends
- 3.2.1. AI-driven Grid Automation & Decision-making
- i. Overview
- ii. Growth in AI-related Smart Grid Patents
- iii. Data Management & Quality
- iv. Energy Consumption of AI Systems
- Figure 3.1: Projected Data Centre Electricity Consumption, 2020-2030 (TWh)
- 3.2.2. Advanced Metering Infrastructure
- i. Overview
- ii. Customer Engagement Features
- iii. Strain from Dynamic Tariffs & Real-time Settlement
- iv. Disparities in Roll-out & Digital Inclusion
- 3.2.3. Distributed Energy Resources
- i. Overview
- ii. Key DERs
- Figure 3.2: Total Energy Saved via Heat Pumps (MWh), Split by 8 Key Regions, 2025-2029
- iii. Advanced Control & Orchestration Platforms
- iv. Data Interoperability
- 3.2.4. Renewable Energy Sources
- i. Overview
- ii. Hybrid Renewable-plus Storage Systems
- Figure 3.3: Total Energy Generated by Renewable Sources (TWh), 2025-2029
- iii. Grid-forming Inverters
- iv. Forecasting & Predictability
- 3.2.5. Virtual Power Plants
- i. Overview
- ii. Sector Coupling
- iii. Cross-border VPPs
- iv. Economic Viability & Business Models
- 3.2.1. AI-driven Grid Automation & Decision-making
- 3.3. Key Challenges
- 3.3.1. Cyber Security
- i. Overview
- ii. Inconsistent Standards & Protocols
- iii. Zero Trust
- 3.3.2. Regulatory Complexity & Compliance
- i. Overview
- ii. Grid Fragmentation
- iii. Emerging Compliance Tools
- 3.3.3. Data Privacy & Consumer Trust
- i. Overview
- ii. Security Risks
- iii. Maintaining Privacy
- iv. Synthetic Data
- 3.3.1. Cyber Security
- 3.4. Stakeholder Opportunities
- 3.4.1. Utilities & Grid Operators
- i. Invest in Infrastructure & Intelligence
- ii. Champion Data Quality & Governance
- iii. Prioritise Interoperability & Open Standards
- 3.4.2. Technology Providers & Manufacturers
- i. Develop Low-energy, Scalable AI Tools
- ii. Offer Plug and Play Interoperability
- iii. Build Cyber Resilience Into Every Layer
- 3.4.3. Policymakers & Regulators
- i. Mandate Digital Inclusion
- ii. Simplify & Harmonise Regulatory Frameworks
- iii. Incentivise Open Standards and Secure Design
- 3.4.4. Investors & Project Developers
- i. Hybrid Systems & Flexible Assets
- ii. Focus on Enabling Infrastructure
- 3.4.1. Utilities & Grid Operators
4. Country Readiness Index
- 4.1. Introduction
- Figure 4.1: Juniper Research's 8 Key Regions
- Table 4.2: Juniper Research Smart Grid Country Readiness Index: Scoring Criteria
- Figure 4.3: Juniper Research Country Readiness Index - Smart Grid
- Figure 4.4: Juniper Research Competitive Web - Smart Grid Regional Opportunities
- 4.2. Focus Markets
- Figure 4.5: List of Focus Markets
- 4.2.1. Key Characteristics
- i. High Digital Maturity
- ii. Strong Regulatory Support
- iii. Large-scale Smart Meter Penetration
- iv. Advanced Power Infrastructure
- v. Commercial Viability
- 4.2.2. Markets to Watch
- i. Australia
- ii. China
- iii. Germany
- iv. Japan
- v. South Korea
- vi. UK
- vii. US
- 4.2.3. Strategic Recommendations for Stakeholders
- i. Optimise Existing Infrastructure with Advanced Grid Intelligence
- ii. Enable Cross-sector Integration through Open Standards
- iii. Monetise Flexibility Services & Demand Response
- iv. Advance Consumer-centric Innovations
- v. Strengthen Cyber Security Protocols
- 4.3. Growth Markets
- Figure 4.6: List of Growth Markets
- 4.3.1. Key Characteristics
- i. Rapid Increase in Smart Grid Investment
- ii. Improving Regulatory Landscape
- iii. Emerging Digital Infrastructure
- iv. High Potential for Cost Savings & Efficiency Gains
- v. Strong Long-term Market Outlook
- 4.3.2. Markets to Watch
- i. Malaysia
- ii. Thailand
- iii. Vietnam
- 4.3.3. Strategic Recommendations for Stakeholders
- i. Design Smart Grid Architectures with Future Scalability in Mind
- ii. Accelerate Urban Pilots That Demonstrate Quick Wins
- iii. Work Proactively with Governments to Shape Regulation
- iv. Localise Technology for Infrastructure Gaps & Grid Instability
- v. Develop Capacity-building Partnerships with Local Utilities
- vi. Quantify & Communicate Socioeconomic Impact
- 4.4. Saturated Markets
- Figure 4.7: List of Saturated Markets
- 4.4.1. Key Characteristics
- i. High Smart Meter & Grid Technology Penetration
- ii. Rigid Regulatory Frameworks
- iii. Limited Room for New Entrants
- iv. Focus Shift from Deployment to Performance Optimisation
- v. Growing Pressure Around Consumer Engagement
- 4.4.2. Markets to Watch
- i. Austria
- ii. Finland
- iii. Ireland
- 4.4.3. Strategic Recommendations for Stakeholders
- i. Focus on Grid Intelligence, Not Grid Expansion
- ii. Enable Deep Integration of Distributed Energy Resources
- iii. Offer Lifecycle Services & Platform Upgrades
- iv. Push for Regulatory Innovation
- v. Reframe Value Around Consumer-centric Services
- vi. Invest in Cyber Security Resilience
- 4.5. Developing Markets
- Figure 4.8: List of Developing Markets
- 4.5.1. Key Characteristics
- i. Low Smart Grid & Metering Penetration
- ii. Inconsistent or Undeveloped Policy Frameworks
- iii. Basic Connectivity & Power Infrastructure Constraints
- iv. Significant Electrification & Access Gaps
- v. Untapped Opportunity for Leapfrogging
- 4.5.2. Markets to Watch
- i. Argentina
- ii. Bangladesh
- iii. Egypt
- iv. Kenya
- v. Mexico
- vi. Nigeria
- vii. Pakistan
- viii. South Africa
- ix. Ukraine
- x. United Arab Emirates (UAE)
- 4.5.3. Strategic Recommendations for Stakeholders
- i. Integrate Smart Grid Planning with National Electrification Goals
- ii. Support Policy Development Through Technical Assistance
- iii. Prioritise Decentralised Solutions
- iv. Design for Resilience & Simplicity
- v. Enable Local Workforce Development
- vi. Leverage Development Finance & Blended Investment Models
- 4.6. Regional Heatmaps
- 4.6.1. North America
- 4.6.2. Latin America
- 4.6.3. West Europe
- 4.6.4. Central & East Europe
- 4.6.5. Far East & China
- 4.6.6. Indian Subcontinent
- 4.6.7. Rest of Asia Pacific
- 4.6.8. Africa & Middle East
Endnotes
Competitor Leaderboard
1. Smart Grid Competitor Leaderboard
- Why Read this Report?
- Vendor Takeaways & Strategic Recommendations
- Table 1.1: Juniper Research Competitor Leaderboard: Smart Grid Vendors
- Figure 1.2: Juniper Research Competitor Leaderboard: Smart Grid
- Figure 1.3: Juniper Research Competitor Leaderboard: Smart Grid Vendors & Positioning
- Table 1.4: Juniper Research Smart Grid Competitor Leaderboard Heatmap
2. Vendor Profiles
- 2.1. ABB
- i. Corporate Information
- Table 2.1: Financial Overview, ABB ($bn)
- ii. Geographical Spread
- iii. Key Clients & Strategic Partnerships
- iv. High-level View of Offerings
- Figure 2.2: ABB Microgrid Community
- v. Juniper Research's View: Key Strengths & Strategic Development Opportunities
- i. Corporate Information
- 2.2. Cisco Systems
- i. Corporate Information
- Table 2.3: Financial Overview, Cisco Systems ($bn)
- ii. Geographical Spread
- iii. Key Clients & Strategic Partnerships
- iv. High-level View of Offerings
- Figure 2.4: Cisco Secure SD-WAN Architecture for DERs
- v. Juniper Research's View: Key Strengths & Strategic Development Opportunities
- i. Corporate Information
- 2.3. Eaton
- i. Corporate Information
- Table 2.5: Financial Overview, Eaton ($bn)
- ii. Geographical Spread
- iii. Key Clients & Strategic Partnerships
- iv. High-level View of Offerings
- Figure 2.6: Eaton xStorage Energy Storage Container
- v. Juniper Research's View: Key Strengths & Strategic Development Opportunities
- i. Corporate Information
- 2.4. Fujitsu
- i. Corporate Information
- Table 2.7: Financial Overview, Fujitsu ($bn)
- ii. Geographical Spread
- iii. Key Clients & Strategic Partnerships
- iv. High-level View of Offerings
- v. Juniper Research's View: Key Strengths & Strategic Development Opportunities
- i. Corporate Information
- 2.5. GE Vernova
- i. Corporate Information
- Table 2.8: Financial Overview, GE Vernova ($bn)
- ii. Geographical Spread
- iii. Key Clients & Strategic Partnerships
- iv. High-level View of Offerings
- Figure 2.9: GridOS DERMS System Architecture
- v. Juniper Research's View: Key Strengths & Strategic Development Opportunities
- i. Corporate Information
- 2.6. Hitachi Energy
- i. Corporate Information
- Table 2.10: Financial Overview, Hitachi ($bn)
- ii. Geographical Spread
- iii. Key Clients & Strategic Partnerships
- iv. High-level View of Offerings
- v. Juniper Research's View: Key Strengths & Strategic Development Opportunities
- i. Corporate Information
- 2.7. Honeywell
- i. Corporate Information
- Table 2.11: Financial Overview, Honeywell ($bn)
- ii. Geographical Spread
- iii. Key Clients & Strategic Partnerships
- iv. High-level View of Offerings
- v. Juniper Research's View: Key Strengths & Strategic Development Opportunities
- i. Corporate Information
- 2.8. IBM
- i. Corporate Information
- Table 2.12: Financial Overview, IBM ($bn)
- ii. Geographical Spread
- iii. Key Clients & Strategic Partnerships
- iv. High-level View of Offerings
- v. Juniper Research's View: Key Strengths & Strategic Development Opportunities
- i. Corporate Information
- 2.9. Itron
- i. Corporate Information
- Table 2.13: Financial Overview, Itron ($bn)
- ii. Geographical Spread
- iii. Key Clients & Strategic Partnerships
- iv. High-level View of Offerings
- v. Juniper Research's View: Key Strengths & Strategic Development Opportunities
- i. Corporate Information
- 2.10. Landis+Gyr
- i. Corporate Information
- Table 2.14: Financial Overview, Landis+Gyr ($bn)
- ii. Geographical Spread
- iii. Key Clients & Strategic Partnerships
- iv. High-level View of Offerings
- v. Juniper Research's View: Key Strengths & Strategic Development Opportunities
- i. Corporate Information
- 2.11. Oracle
- i. Corporate Information
- Table 2.15: Financial Overview, Oracle ($bn)
- ii. Geographical Spread
- iii. Key Clients & Strategic Partnerships
- iv. High-level View of Offerings
- v. Juniper Research's View: Key Strengths & Strategic Development Opportunities
- i. Corporate Information
- 2.12. Panasonic
- i. Corporate Information
- Table 2.16: Financial Overview, Panasonic ($bn)
- ii. Geographical Spread
- iii. Key Clients & Strategic Partnerships
- iv. High-level View of Offerings
- v. Juniper Research's View: Key Strengths & Strategic Development Opportunities
- i. Corporate Information
- 2.13. Schneider Electric
- i. Corporate Information
- Table 2.17: Financial Overview, Schneider Electric ($bn)
- ii. Geographical Spread
- iii. Key Clients & Strategic Partnerships
- iv. High-level View of Offerings
- Figure 2.18: Schneider Electric EcoStruxure Grid Overview
- v. Juniper Research's View: Key Strengths & Strategic Development Opportunities
- i. Corporate Information
- 2.14. Siemens
- i. Corporate Information
- Table 2.19: Financial Overview, Siemens Smart Infrastructure ($bn)
- ii. Geographical Spread
- iii. Key Clients & Strategic Partnerships
- iv. High-level View of Offerings
- v. Juniper Research's View: Key Strengths & Strategic Development Opportunities
- i. Corporate Information
- 2.15. Tantalus
- i. Corporate Information
- Table 2.20: Financial Overview, Tantalus ($m)
- ii. Geographical Spread
- iii. Key Clients & Strategic Partnerships
- iv. High-level View of Offerings
- Figure 2.21: Tantalus TruSense Gateway Composition
- v. Juniper Research's View: Key Strengths & Strategic Development Opportunities
- i. Corporate Information
3. Methodology
- 3.1. Competitor Leaderboard Assessment Methodology
- 3.2. Limitations & Interpretations
- Table 3.1: Juniper Research Smart Grid Competitor Leaderboard Criteria
- 3.3. Related Research
Endnotes
Data & Forecasting
1. Market Landscape
- 1.1. Introduction
- 1.2. Defining the Smart Grid
- 1.3. Overview
- 1.3.1. Global Adoption
- i. Markets to Watch
- 1.3.2. Financial Outlook
- 1.3.3. Impact on Consumers & Utilities
- 1.3.4. Enabling Technologies
- 1.3.1. Global Adoption
2. Smart Grid Market Forecasts
- 2.1. Introduction
- 2.2. Forecast Methodology & Assumptions
- Figure 2.1: Smart Grid Forecast Methodology
- 2.3. Smart Grid Completion
- Figure & Table 2.2: Global Smart Grid Completion, Year End (%), 2025-2030
- 2.4. Smart Grid Software Revenue
- Figure & Table 2.3: Smart Grid Software Revenue ($m), Split by 8 Key Regions, 2025-2030
- 2.5. Smart Grid Energy Savings
- Figure & Table 2.4: Smart Grid Energy Savings (TWh), Split by 8 Key Regions, 2025-2030
- 2.6. Smart Grid Energy Cost Savings
- Figure & Table 2.5: Smart Grid Energy Cost Savings ($m), Split by 8 Key Regions, 2025-2030
- 2.7. Smart Grid Emissions Savings
- Figure & Table 2.6: Smart Grid Emissions Savings (MMT CO2e), Split by 8 Key Regions, 2025-2030
- 2.8. Smart Grid Emissions Cost Savings
- Figure & Table 2.7: Smart Grid Emissions Cost Savings ($m), Split by 8 Key Regions, 2025-2030
3. Smart Meter Market Forecasts
- 3.1. Introduction
- 3.2. Forecast Methodology & Assumptions
- Figure 3.1: Smart Meter Forecast Methodology
- 3.3. Smart Meters in Service
- Figure & Table 3.2: Smart Meters in Service (m), Split by 8 Key Regions, 2025-2030
- 3.4. Smart Meter Shipments
- Figure & Table 3.3: Smart Meter Shipments (m), Split by 8 Key Regions, 2025-2030
- 3.5. Cellular Smart Meters
- Figure & Table 3.4: Cellular Smart Meters (m), Split by 8 Key Regions, 2025-2030
- 3.6. Smart Meter SIMs
- Figure & Table 3.5: Smart Meter SIMs (m), Split by Technology, 2025-2030
- 3.7. Smart Meter Data Usage
- Figure & Table 3.6: Smart Meter Data Usage (PB), Split by 8 Key Regions, 2025-2030
- 3.8. Smart Meter Revenue
- Figure & Table 3.7: Smart Meter Revenue ($m), Split by 8 Key Regions, 2025-2030
- Table 3.8: Smart Meter Revenue ($m), Split by Source, 2025-2030
- Table 3.9: Smart Meter Revenue (%), Split by Source, 2025-2030
- 3.9. Smart Meter Hardware Revenue
- Figure & Table 3.10: Smart Meter Hardware Revenue ($m), Split by 8 Key Regions, 2025-2030
- 3.10. Smart Meter Connectivity Revenue
- Figure & Table 3.11: Smart Meter Connectivity Revenue ($m), Split by 8 Key Regions, 2025-2030

