


 |
市场调查报告书
商品编码
1827027
即时支付市场:2025-2030Instant Payments Market: 2025-2030 |
||||||
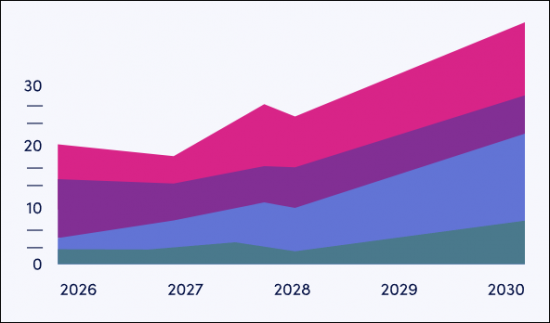
"到 2029 年,全球即时支付市场规模将超过 110 兆美元:欧洲监管和 FedNow 的影响将加速成长"
| 主要统计 | |
|---|---|
| 2025年的即时付款交易总额: | 60兆美元 |
| 2030年的即时付款交易总额: | 1亿2900万美元 |
| 2025年~2030年的市场成长率: | 115% |
| 预测期间: | 2025-2030年 |
概述
本研究套件对快速成长的即时支付市场进行了多方面的策略分析,提供利益相关方,包括银行、支付基础设施提供者、监管机构和企业,全面了解未来市场成长、关键趋势和竞争格局。
本报告提供全英文版本。
主要特点
- 关键要点和策略建议:本报告详细分析了关键市场机会、关键发现,并为即时支付平台、商家、支付服务提供者、银行等提供了策略建议。
- 市场展望:本报告分析了推动即时支付市场扩张的新兴趋势和因素,并探讨了成长障碍,例如诈欺风险和企业谨慎性。报告还比较了消费者和企业领域的用例,并突出了采用率的差异。国家准备指数评估了61个国家在即时支付领域的地位、技术准备及其未来成长潜力。
- 产业预测基准:概述即时支付市场,并预测 B2B 和消费者、国内和国际交易的交易量和价值。
- Juniper Research 竞争排行榜:根据综合市场能力、产品供应和竞争定位对 17 个即时支付平台进行评估。
样品view
市场资料&预测报告
样品
市场趋势&策略报告
市场资料&预测报告
本研究套件包含 39 个表格和超过 24,000 个资料点的完整预测资料。
主要的指标:
- 即时付款的整体交易数量
- 即时付款的整体交易额
主要市场区隔:
- 消费者取向即时付款
- 国内消费者取向即时付款
- 国际消费者取向即时付款
- B2B即时付款
- 国内B2B即时付款
- 国际B2B即时付款
Juniper Research 互动式预测 (Excel) 提供以下内容功能:
- 统计分析:显示资料期间所有地区和国家的图表。图表可轻鬆修改并汇出至剪贴簿。
- 国家/地区资料工具:查看预测期间所有地区和国家的指标。使用搜寻栏缩小查看指标的范围。
- 国家比较工具:选择要比较的国家。此工具包含汇出图表的功能。
- 假设分析:五个互动式场景允许使用者比较预测假设。
竞争排行榜报告
目标供应商包括以下 17 家公司:
|
|
目录
市场趋势与策略
第1章 重要点和策略性建议
- 重要点
- 策略性建议
第2章 即时付款-市场形势
- 简介
- 即时付款的结构
- 概要
- 即时付款功能
- 即时付款的优点
- 即时付款的技术层
- 支付轨道
- 课题与限制
- 背景
- 新兴趋势
- 概述
- 推动即时支付的技术创新
- 监理趋势
- 产品相关支付趋势
- 消费者即时支付 vs. B2B 即时支付
- 消费者即时支付
- B2B 即时支付
第3章 即时付款:市场区隔分析
- P2P付款
- 线上电子商务付款
- 商店内即时付款
- 跨国付款
第4章 即时付款:各国准备指数
- 简介
- 成长市场
- 饱和市场
- 新兴国家市场
竞争排行榜
第1章 竞争排行榜
第2章 企业简介
- 业者简介
- ACI Worldwide
- Bottomline
- Finastra
- FIS
- Fiserv
- FSS
- Jack Henry
- Mastercard
- Montran Corporation
- Nexi
- Pelican AI
- SWIFT
- Tata Consultancy Services
- Tietoevry
- Visa
- Volante Technologies
- Worldline
- 竞争排行榜评估手法
- 相关调查
资料&预测
第1章 即时付款:简介·调查手法
第2章 市场摘要
- 整体交易数量
- 整体交易额
- 国内交易
- 跨国交易
第3章 B2B付款
- 整体交易数量
- 整体交易额
- 国内交易
- 跨国交易
第4章 消费者付款
- 整体交易数量
- 整体交易额
- 国内交易
- 跨国交易
'Instant Payments to Exceed $110 Trillion by 2029 Globally, Accelerated by European Regulation & FedNow Impact'
| KEY STATISTICS | |
|---|---|
| Total instant payments transaction value in 2025: | $60tn |
| Total instant payments transaction value in 2030: | $129tn |
| 2025 to 2030 market growth: | 115% |
| Forecast period: | 2025-2030 |
Overview
Juniper Research's "Instant Payments" research suite provides a wide-ranging and strategic analysis of this market; enabling stakeholders - from banks, infrastructure providers, regulators, and businesses - to understand future growth, key trends, and the competitive environment.
The research suite includes several different options that can be purchased separately. The Market Trends & Strategies element includes an insightful analysis of the key areas of real-time payments' transformation and innovation, including key trends and challenges to market expansion. Additionally, it features Juniper Research's Country Readiness Index, which provides a country-level analysis of the current and future opportunities for instant payments in 61 different geographies.
The Data & Forecasting element includes access to data mapping the adoption and future growth of the instant payments market over the next five years; split by cross-border versus domestic transactions, and B2B versus consumer.
Additionally, the Competitor Leaderboard document features an extensive analysis of the 17 market leaders in the instant payments space; positioning them based on capability and capacity, as well as on their product offering itself; offering a robust analysis of each vendor.
The coverage can also be purchased as a full research suite containing the Market Trends & Strategies, Data & Forecasting, and Competitor Leaderboard, and at a substantial discount.
Collectively, these documents provide a critical tool for understanding this important market. They allow instant payment providers and payments companies to shape their future strategy; capitalising on future growth opportunities. The research suite's extensive coverage makes it a valuable tool for navigating this high-growth market.
All report content is delivered in the English language.
Key Features
- Key Takeaways & Strategic Recommendations: In-depth analysis of key development opportunities, key findings, and key strategic recommendations for instant payment platforms, merchants, payment service providers, and banks.
- Market Outlook: Insights into emerging trends and drivers of the expansion of the instant payments market; addressing factors limiting its growth, such as scam risk and business hesitancy. It provides analysis of the different use cases in both the consumer and business sectors; breaking down which have witnessed different adoption rates among instant payment services. Juniper Research's Country Readiness Index positions 61 countries in their relative place in the real-time payments space; their readiness for the technology and their future growth.
- Benchmark Industry Forecasts: This provides an overview of the instant payments market, including the volume and value of instant payments transactions, split by B2B and consumer payments, and by domestic and cross-border payments.
- Juniper Research Competitor Leaderboard: Key player capability and capacity assessment for 17 instant payment platforms, via the Juniper Research Competitor Leaderboard.
SAMPLE VIEW
Market Data & Forecasting Report
SAMPLE VIEW
Market Trends & Strategies Report
The numbers tell you what's happening, but our written report details why, alongside the methodologies.
A comprehensive analysis of the current market landscape, alongside strategic recommendations.
Market Data & Forecasting Report
The market-leading research suite for the "Instant Payments" market includes access to the full set of forecast data of 39 tables and over 24,000 datapoints.
Metrics in the research suite include:
- Total Number of Instant Payments
- Total Value of Instant Payments
These metrics are provided for the following key market splits:
- Consumer Instant Payments
- Domestic Consumer Instant Payments
- Cross-border Consumer Instant Payments
- B2B Instant Payments
- Domestic B2B Instant Payments
- Cross-border B2B Instant Payments
Juniper Research Interactive Forecast Excel contains the following functionality:
- Statistics Analysis: Users benefit from the ability to search for specific metrics; displayed for all regions and countries across the data period. Graphs are easily modified and can be exported to the clipboard.
- Country Data Tool: This tool enables users to look at metrics for all regions and countries in the forecast period. Users can refine the metrics displayed via a search bar.
- Country Comparison Tool: Users can select and compare countries. The ability to export graphs is included in this tool.
- What-if Analysis: Here, users can compare forecast metrics against their own assumptions, via 5 interactive scenarios.
Market Trends & Strategies Report
This report examines the Instant Payments market landscape in detail; assessing market trends and factors shaping the evolution of this transforming market. It delivers comprehensive analysis of the strategic opportunities in the instant payments landscape; assessing ways in which the market is changing based on different scheme types and trends, and what this means for overall market growth.
The report also examines key challenges and opportunities, as well as providing an evaluation of key country-level opportunities for instant payments growth via a Country Readiness Index. Combined, the report provides an insightful resource for key stakeholders.
Competitor Leaderboard Report
The Competitor Leaderboard report provides coverage of 17 leading "Instant Payments" vendors; positioning them as established leaders, leading challengers, or disruptors and challengers based on capacity and capability assessments.
The 17 vendors included are:
|
|
The Competitor Leaderboard gives a comprehensive guide to the competitive landscape within instant payments; providing an important resource for stakeholders.
Table of Contents
Market Trends & Strategies
1. Key Takeaways & Strategic Recommendations
- 1.1. Key Takeaways
- 1.2. Strategic Recommendations
2. Instant Payments - Market Landscape
- 2.1. Introduction
- 2.1.1. Definition and Core Features of Instant Payments
- 2.1.2. Differentiation: Instant vs Faster Payments
- 2.1.3. Global Adoption
- 2.2. How Instant Payments Work
- 2.2.1. Overview
- i. Main Process
- Figure 2.1: Example Instant Payments System - The Clearing House Real-time Payments (RTP) Network
- ii. Additional Supporting Functions
- i. Main Process
- 2.2.2. Instant Payments Features
- 2.2.3. Benefits of Instant Payment
- 2.2.4. Technological Layer of Instant Payment
- 2.2.5. Payment Rails
- i. Pix (Brazil)
- ii. UPI (India)
- iii. Faster Payments (UK)
- iv. PromptPay (Thailand)
- Figure 2.2: PromptPay Payment Infrastructure
- v. SEPA Instant Credit (EU)
- Figure 2.3: Map of SEPA Member Countries
- 2.2.6. Challenges And Limitations
- i. Overview
- ii. Fraud Prevention
- iii. Ways To Minimise Fraud
- Figure 2.4: Request to Pay Loop
- iv. Other Considerations
- 2.2.1. Overview
- 2.3. Background
- 2.3.1. Historical Background
- 2.3.2. Modern Days
- 2.3.3. Latest Developments
- 2.4. Emerging Trends
- 2.4.1. Overview
- 2.4.2. Technological Innovations Driving Instant Payments
- i. The Rise Of Digital Wallets
- ii. AI's Potential
- iii. Internet of Things (IoT)
- iv. The Integration Of Digital Assets
- v. Decentralised Networks and Blockchain
- vi. Open Banking
- Figure 2.5: Provision of Services in Open Banking
- 2.4.3. Regulatory Trends
- 2.4.4. Product-related Payment Trends
- i. The Use of Data
- ii. Fraud Detection and AML
- 2.5. Consumer vs B2B Instant Payments
- 2.5.1. Consumer Instant Payments
- i. Opportunities
- ii. Adoption
- iii. Use Cases
- 2.5.2. B2B Instant Payments
- i. Opportunities
- ii. Adoption
- iii. Use Cases
- 2.5.1. Consumer Instant Payments
3. Instant Payments: Segment Analysis
- 3.1. P2P Payments
- 3.1.1. Market
- 3.1.2. Opportunities
- 3.1.3. Limitations
- 3.1.4. Future Outlook
- 3.2. Online eCommerce Payments
- 3.2.1. Overview
- 3.2.2. Opportunities
- 3.2.3. Limitations
- 3.2.4. Future Outlook
- 3.3. In-store Instant Payments
- 3.3.1. Market
- 3.3.2. Opportunities
- 3.3.3. Limitations
- 3.3.4. Future Outlook
- 3.4. Cross-border Payments
- 3.4.1. The Latest Progress Within Cross-border Instant Payments
- 3.4.2. Project Nexus
- Figure 3.1: How Payments Are Processed in Nexus
- 3.4.3. Financial Inclusion
- 3.4.4. Barriers to Further Expansion of Cross-border Instant Payments
4. Instant Payments: Country Readiness Index
- 4.1. Introduction
- Figure 4.1: Juniper Research Country Readiness Index: Regional Definitions
- Table 4.2: Juniper Research Country Readiness Index Scoring Criteria: Instant Payments
- Figure 4.3: Juniper Research Country Readiness Index: Instant Payments
- Table 4.4: Instant Payments Country Readiness Index: Market Segments
- 4.1.1. Focus Markets
- 4.1.2. Established Instant Payment Rails
- 4.1.3. Institutional Support
- 4.1.4. Country-level Assessment: The US
- 4.2. Growth Markets
- 4.2.1. Emerging Economies
- 4.2.2. Developed Economies
- 4.2.3. Country-level Assessment: The UAE
- 4.3. Saturated Markets
- 4.3.1. Cross-border Co-operation
- 4.3.2. Additional Services
- 4.3.3. Country-level Assessment: The UK
- 4.3.4. Country-level Assessment: Mexico
- 4.4. Developing Markets
- 4.4.1. Limited Infrastructure
- Table 4.5: Juniper Research Country Readiness Index Heatmap: North America
- Table 4.6: Juniper Research Country Readiness Index Heatmap: Latin America
- Table 4.7: Juniper Research Country Readiness Index Heatmap: West Europe
- Table 4.8: Juniper Research Country Readiness Index Heatmap: Central & East Europe
- Table 4.9: Juniper Research Country Readiness Index Heatmap: Far East & China
- Table 4.10: Juniper Research Country Readiness Index Heatmap: Indian Subcontinent
- Table 4.11: Juniper Research Country Readiness Index Heatmap: Rest of Asia Pacific
- Table 4.12: Juniper Research Country Readiness Index Heatmap: Africa & Middle East
- 4.4.1. Limited Infrastructure
Competitor Leaderboard
1. Juniper Research Competitor Leaderboard
- 1.1. Why Read This Report
- Table 1.1: Juniper Research Competitor Leaderboard: Instant Payments Vendors Included & Product Portfolio
- Figure 1.2: Juniper Research Competitor Leaderboard for Instant Payments
- Table 1.3: Juniper Research Instant Payments Vendors & Positioning
- Table 1.4: Juniper Research Competitor Leaderboard Heatmap - Instant Payments Vendors
2. Company Profiles
- 2.1. Vendor Profiles
- 2.1.1. ACI Worldwide
- i. Corporate
- Figure 2.1: ACI Worldwide's Financial Snapshot ($m), 2022-2024
- ii. Geographical Spread
- iii. Key Clients & Strategic Partnerships
- iv. High-level View of Offerings
- v. Juniper Research's View: Key Strengths & Strategic Development Opportunities
- i. Corporate
- 2.1.2. Bottomline
- i. Corporate
- ii. Geographical Spread
- iii. Key Clients & Strategic Partnerships
- iv. High-level View of Offerings
- v. Juniper Research's View: Key Strengths & Strategic Development Opportunities
- 2.1.3. Finastra
- i. Corporate
- ii. Geographical Spread
- iii. iii. Key Clients & Strategic Partnerships
- iv. High-level View of Offerings
- v. Juniper Research's View: Key Strengths & Strategic Development Opportunities
- 2.1.4. FIS
- i. Corporate
- Table 2.2: FIS' Financial Snapshot ($m), 2022-2024
- ii. Geographical Spread
- iii. Key Clients & Strategic Partnerships
- iv. High-level View of Offerings
- v. Juniper Research's View: Key Strengths & Strategic Development Opportunities
- i. Corporate
- 2.1.5. Fiserv
- i. Corporate
- Table 2.3: Fiserv's Financial Snapshot ($m), 2022-2024
- ii. Geographical Spread
- iii. Key Clients & Strategic Partnerships
- iv. High-level View of Offerings
- v. Juniper Research's View: Key Strengths & Strategic Development Opportunities
- i. Corporate
- 2.1.6. FSS
- i. Corporate
- Table 2.4: FSS' Rounds of Funding ($m), 2000-2014
- ii. Geographical Spread
- iii. Key Clients & Strategic Partnerships
- iv. High-level View of Offerings
- v. Juniper Research's View: Key Strengths & Strategic Development Opportunities
- i. Corporate
- 2.1.7. Jack Henry
- i. Corporate
- Table 2.5: Jack Henry's Financial Snapshot ($m), 2022-2024
- ii. Geographical Spread
- iii. Key Clients & Strategic Partnerships
- iv. High-level View of Offerings
- v. Juniper Research's View: Key Strengths & Strategic Development Opportunities
- i. Corporate
- 2.1.8. Mastercard
- i. Corporate
- Table 2.6: Mastercard's Financial Snapshot ($m), 2022-2024
- ii. Geographical Spread
- iii. Key Clients & Strategic Partnerships
- iv. High-level View of Offerings
- Figure 2.7: Mastercard's Real-time Payments Solution
- v. Juniper Research's View: Key Strengths & Strategic Development Opportunities
- i. Corporate
- 2.1.9. Montran Corporation
- i. Corporate
- ii. Geographical Spread
- iii. Key Clients & Strategic Partnerships
- iv. High-level View of Offerings
- v. Juniper Research's View: Key Strengths & Strategic Development Opportunities
- 2.1.10. Nexi
- i. Corporate
- Table 2.8: Nexi's Financial Snapshot ($m), 2023-2024
- ii. Geographical Spread
- iii. Key Clients & Strategic Partnerships
- iv. High-level View of Offerings
- v. Juniper Research's View: Key Strengths & Strategic Development Opportunities
- i. Corporate
- 2.1.11. Pelican AI
- i. Corporate
- ii. Geographical Spread
- iii. Key Clients & Strategic Partnerships
- iv. High-level View of Offerings
- v. Juniper Research's View: Key Strengths & Strategic Development Opportunities
- 2.1.12. SWIFT
- i. Corporate
- Table 2.9: SWIFT's Financial Snapshot ($m), 2021-2024
- ii. Geographical Spread
- iii. Key Clients & Strategic Partnerships
- iv. High-level View of Offerings
- v. Juniper Research's View: Key Strengths & Strategic Development Opportunities
- i. Corporate
- 2.1.13. Tata Consultancy Services
- i. Corporate
- Table 2.10: Tata Consultancy Services' Financial Snapshot ($m), 2022-2024
- ii. Geographical Spread
- iii. Key Clients & Strategic Partnerships
- iv. High-level View of Offerings
- v. Juniper Research's View: Key Strengths & Strategic Development Opportunities
- i. Corporate
- 2.1.14. Tietoevry
- i. Corporate
- Table 2.11: Tietoevry's Financial Snapshot ($m), 2022-2024
- ii. Geographical Spread
- iii. Key Clients & Strategic Partnerships
- iv. High-level View of Offerings
- Figure 2.12: Instant Payments for Participants Schematic
- v. Juniper Research's View: Key Strengths & Strategic Development Opportunities
- i. Corporate
- 2.1.15. Visa
- i. Corporate
- Table 2.13: Visa's Financial Snapshot ($m), 2022-2024
- ii. Geographical Spread
- iii. Key Clients & Strategic Partnerships
- iv. High-level View of Offerings
- v. Juniper Research's View: Key Strengths & Strategic Development Opportunities
- i. Corporate
- 2.1.16. Volante Technologies
- i. Corporate
- ii. Geographical Spread
- iii. Key Clients & Strategic Partnerships
- iv. High-level View of Offerings
- v. Juniper Research's View: Key Strengths & Strategic Development Opportunities
- 2.1.17. Worldline
- i. Corporate
- Table 2.14: Worldline's Financial Snapshot ($m), 2022-2024
- ii. Geographical Spread
- iii. Key Clients & Strategic Partnerships
- iv. High-level View of Offerings
- v. Juniper Research's View: Key Strengths & Strategic Development Opportunities
- i. Corporate
- 2.1.1. ACI Worldwide
- 2.2. Juniper Research Competitor Leaderboard Assessment Methodology
- 2.2.1. Limitations & Interpretations
- Table 2.15: Juniper Research Competitor Leaderboard Scoring Criteria - Instant Payments
- 2.2.1. Limitations & Interpretations
- 2.3. Related Research
Data & Forecasting
1. Instant Payments: Introduction & Methodology
- 1.1. Introduction
- 1.2. Methodology & Assumptions
- Figure 1.1: Consumer Instant Payments Methodology
- Figure 1.2: B2B Instant Payments Methodology
2. Market Summary
- 2.1. Total Volume
- Figure & Table 2.1: Total Volume of Instant Payments per annum (m), Split by 8 Key Regions, 2025-2030
- 2.2. Total Value
- Figure & Table 2.2: Total Value of Instant Payments per annum ($m), Split by 8 Key Regions, 2025-2030
- 2.3. Domestic Transactions
- Figure & Table 2.3: Total Value of Instant Domestic Payments per annum ($m), Split by 8 Key Regions, 2025-2030
- 2.4. Cross-border Transactions
- Figure & Table 2.4: Total Value of Instant Cross-border Payments per annum ($m), Split by 8 Key Regions, 2025-2030
3. B2B Payments
- 3.1. B2B Volume
- Figure & Table 3.1: Total Number of Instant B2B Transactions per annum (m), Split by 8 Key Regions, 2025-2030
- 3.2. B2B Value
- Figure & Table 3.2: Total Value of Instant Payment B2B Transactions per annum ($m), Split by 8 Key Regions, 2025-2030
- 3.3. Domestic B2B Transactions
- Figure & Table 3.3: Total Value of Instant Payment Domestic B2B Transactions per annum ($m), Split by 8 Key Regions, 2025-2030
- 3.4. Cross-border B2B Transactions
- Figure & Table 3.4: Total Value of Cross-border B2B Payments via Instant Payment per annum ($m), Split by 8 Key Regions, 2025-2030
4. Consumer Payments
- 4.1. Total Volume
- Figure & Table 4.1: Total Number of Instant Payment Consumer Transactions per annum (m), Split by 8 Key Regions, 2025-2030
- 4.2. Total Value
- Figure & Table 4.2: Total Value of Instant Payment Consumer Transactions per annum ($m), Split by 8 Key Regions, 2025-2030
- 4.3. Domestic Consumer Transactions
- Figure & Table 4.3: Total Value of Instant Payment Domestic Consumer Transactions per annum ($m), Split by 8 Key Regions, 2025-2030
- 4.4. Cross-border Consumer Transactions
- Figure & Table 4.4: Total Value of Instant Payment Cross-border Consumer Transactions per annum ($m), Split by 8 Key Regions, 2025-2030
 2026年全球补丁编配平台市场报告
 即时支付市场分析及至2035年预测:依类型、产品、服务、技术、组件、应用、最终用户、部署模式及类型划分
 支付编配市场:按产品、支付方式、部署模式和垂直产业划分 - 2026-2032 年全球预测2025年即时支付全球市场报告2025年支付监控全球市场报告
 印度 POS 支付市场评估:依组件、依终端类型、依部署、依最终用户、依地区、机会、预测,2018-2032年日本 POS 支付市场评估:依组件、按终端类型、按作业系统、依最终用户、依地区、机会、预测,2018-2032年美国 POS 支付市场评估:依组件、依终端类型、依作业系统、依最终用户、依地区、机会、预测(2017-2031年)全球 POS 支付市场评估:依组件、终端类型、最终用户、地区、机会和预测(2017-2031年)
 即时支付的监管状况和合规挑战