


 |
市场调查报告书
商品编码
1393959
细胞和基因疗法融资和资本交易分析:融资、联盟、併购(M&A)、技术转移、IPO/SPAC和其他交易(2021-2023年)Cell and Gene Therapy Funding and Deals Analysis: Financings, Partnering, M&A, Tech Transfers, IPOs/SPACs, Other Deals, 2021-2023 |
||||||
基因和细胞疗法的概念已经研究了几十年,但早期存在重大挑战。 透过一步一步的进步以及 CRISPR 和下一代定序 (NGS) 等支援工具的逐步引入,细胞和基因疗法已成为一个非常活跃的领域。 许多经过验证的治疗方法现已获得批准。
随着技术进步降低了进入该行业的壁垒,已有超过 1,500 家治疗和工具公司进入该领域。
本报告追踪 2021 年及以后的细胞和基因治疗 (CGT) 交易活动。 该报告提供了 2021 年至 2023 年的图形季度趋势,以及涵盖 2022 年第一季至 2023 年第三季的 2,000 多笔资本交易的具体细节。 近年来,细胞和基因治疗(CGT)相关领域受到了广泛的关注和资助。 本报告追踪的资本利得税投资、收购和其他交易从 2023 年第一季到第三季超过 200 亿美元。 如何利用资本利得税(CGT)这个成长最快的市场之一的商机,为此,我们需要了解正在做哪些专案、正在做多少专案、谁在做什么样的专案专案、有多少、正在做多少个项目。
本报告分析内容(部分):
- 季度资助金额(2021-2023 年)
- 资本利得税领域资本交易的详细资料(2022-2023 年):总计超过 2000 笔
- 创投(合资)/私募基金数量(季度)
- 依时间顺序分为多个类别(创投、併购和其他领域)介绍趋势
- 按类型划分的资本交易趋势:技术/研究/策略联盟、创投/私人投资、併购(M&A)/策略投资、授权协议、首次公开发行/SPAC、製造/供应链、公共赞助/慈善事业、教育、分销、联合行销、分拆、重组、交易完成/终止、合资、诉讼和解。
- 按交易类型(併购 (M&A)、策略投资、综合交易、联盟)划分的资本交易最活跃的公司
- 资本交易的地区细分(%,北美、欧洲、亚太地区和其他地区)
- 最常见的融资类型(每季度,按类别)(技术/研究/策略合作、创投/私人投资、併购 (M&A)/策略投资、授权协议、首次公开发行/SPAC、製造/供应链)(总计)
随着细胞和基因治疗正在成为一个竞争激烈的市场,本报告特别提到了 1000 多家公司。
目录
第 1 章执行摘要
- 简介
- 2023 年前 9 个月投资额达 271 亿美元
- 每季的融资金额
- 季度融资金额:按类别划分(2021 年第一季 - 2023 年第三季)
- 每季交易数量:按类别划分(2021 年第一季 - 2023 年第三季)
- 扩大合作、製造/供应链交易、授权协议、分销/联合行销强调细胞和基因治疗活动
- 不常见的资本利得税交易类型摘要
- 最活跃的公司
第 2 章创投 (VC) 和私募基金
- 流动创投/私募基金
第 3 章策略投资
- 对细胞和基因治疗的策略性投资
第 4 章 IPO/FPO/SPAC
- 在北美,大部分利润来自 IPO、FPO 和 SPAC。
第 5 章企业併购(M&A)
- 虽然平均金额下降,但併购交易数量增加
第 6 章技术/研究/策略合作
- CGT 市场上有广泛的合作
第 7 章授权协议
- 细胞和基因治疗市场的许可协议水准稳定
第 8 章製造/供应链
- CGT 的製造和供应链管理活动显着成长
第 9 章公众支持、教育与慈善活动
- CGT 市场较少关注公共支持、病患/消费者/学员教育和慈善事业
第 10 章分销/合作行销
- 资本利得税分配与联合行销交易概述
第 11 章其他:合资、重组、解散、分立
- 影响细胞和基因治疗的其他类型交易摘要
While the concepts of gene therapy and cell therapy have been investigated for decades, there were major challenges in the early years. Through incremental progress, and the gradual introduction of enabling tools such as CRISPR and next-generation sequencing (NGS), cell and gene therapy has emerged into a highly active area. There are now many approved therapies with proven track records.
As the technologies have lowered the barriers to entry for the industry, over 1,500 therapy or tools companies have been created or have become involved in this field.
This report, Kalorama's “Cell and Gene Therapy Funding and Deals Analysis: Financings, Partnering, M&A, Tech Transfers, IPOs/SPACs, Other Deals, 2021-2023”, tracks the dealmaking activities in cell and gene therapy since 2021. The report provides informative graphs of quarterly trends from 2021-2023, and also includes the specific details of over 2,000 deals covering the Q1 2022-Q3 2023 period. A lot of attention and funding is being given to the areas related to cell and gene therapy (CGT) recently. Kalorama's tracked CGT investments, acquisitions, and other deals amounted to more than $20 billion in the first three quarters of 2023. Understanding the volumes of deals that have been made, who is making which type and how many, and the deals' details, is critical to finding how to take advantage of the opportunities in one of the fastest-growing markets.
Kalorama's report is designed to provide companies entering or already in this market with knowledge of the trends in deals that will shape future growth and competition.
The following is just some of the information in this report:
- Quarterly Funding Amounts 2021-2023
- Specific details of 2000+ CGT Deals from 2022-2023
- Venture Capital/Private Funding Round Amounts, By Quarter
- Chronological Trends Presented in Multiple Categories (VC, M&A, Other Areas)
- Deals by Type - Technology/Research/Strategic Collaboration; Venture Capital/Private Investment; Acquisition, Merger, Strategic Investment; Licensing; Public Offering/SPAC; Manufacturing, Supply Chain; Outreach, Philanthropy, Education; Distribution, Co-Marketing; Spinout, Restructure; Conclude/Terminate Deal; Joint Venture; and Settle Litigation
- Most Active Deal-Making Companies, by Type of Deal (Acquisition/Merger/ Strategic Investment, Overall Deals, Collaborations)
- Regional Breakdown of Dealmaking [North America, Europe, APAC, Rest of World] (%)
- Most Frequent Types of Deals, by Quarter, by Category [Technology/Research/Strategic Collaboration; Venture Capital/Private Investment; Acquisition, Merger, Strategic Investment; Licensing; Public Offering/SPAC; and Manufacturing, Supply Chain] (Total number)
No report published by a major market research publisher has tackled the current Cell and Gene Therapy dealmaking space more comprehensively.
There isn't a more comprehensive exploration of the current Cell and Gene Therapy dealmaking landscape by any major market research publisher. As Cell and Gene Therapy is becoming a highly competitive marketplace, over a thousand companies are specifically referenced in this report.
Table of Contents
Chapter 1: Executive Summary
- Introduction
- $27.1 Billion in Investment in First Nine Months of 2023
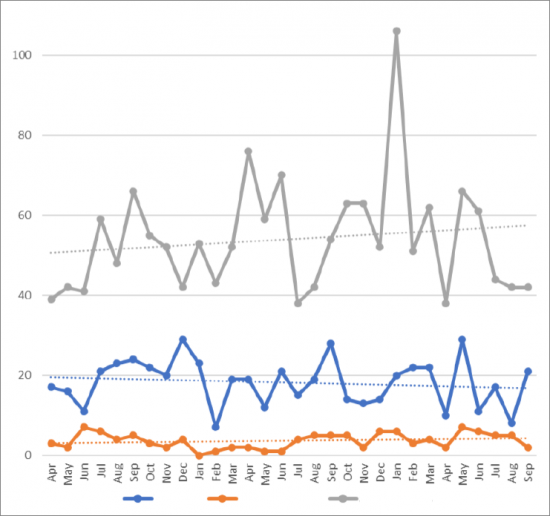
- Figure 1-1: Total Deals per Month, Apr 2021-Sep 2023 (count)
- Figure 1-2: Total Deals per Month by Type, Apr 2021-Sep 2023 [VC/Private, IPO/FPO/SPAC; and All Other Deals] (count)
- Quarterly Funding Amounts
- Table 1-1: Total Quarterly Funding, by Type, Q1-Q3 2023 [M&A; Venture Capital/Private; IPO/FPO; Collab; SPAC; and Strat inv] ($M)
- Table 1-2: Total Quarterly Funding, by Type, 2022 [M&A; Venture Capital/Private; IPO/FPO; Collab; SPAC; and Strat inv] ($M)
- Table 1-3: Total Quarterly Funding, by Type, 2021 [M&A; Venture Capital/Private; IPO/FPO; Collab; SPAC; and Strat inv] ($M)
- Figure 1-3: Total Quarterly Funding, Q1 2021- Q3 2023 ($M)
- Figure 1-4: Total Quarterly Funding, by Type, Q1 2021-Q3 2023 [M&A; Venture Capital/Private; IPO/FPO; Collab; SPAC; and Strat inv] ($M)
- Quarterly Funding Category Shares, Q1 2021 Through Q3 2023
- Table 1-4: Total Quarterly Funding Share, by Type, 2023 [M&A; Venture Capital/Private; IPO/FPO; Collab; SPAC; and Strat inv] (%)
- Table 1-5: Total Quarterly Funding Share, by Type, 2022 [M&A; Venture Capital/Private; IPO/FPO; Collab; SPAC; and Strat inv] (%)
- Table 1-6: Total Quarterly Funding Share, by Type, 2021 [M&A; Venture Capital/Private; IPO/FPO; Collab; SPAC; and Strat inv] ($M)
- Figure 1-5: Total Quarterly Funding Share, by Type, Q1 2021-Q3 2023 [M&A; Venture Capital/Private; IPO/FPO; Collab; SPAC; and Strat inv] (%)
- Figure 1-6: 2021 Funding Share, by Type of Funding [M&A; Venture Capital/Private; IPO/FPO; Collab; SPAC; and Strat inv] (%)
- Figure 1-7: 2022 Funding Share, by Type of Funding [M&A; Venture Capital/Private; IPO/FPO; Collab; SPAC; and Strat inv] (%)
- Figure 1-8: 2023 Funding Share, by Type of Funding [M&A; Venture Capital/Private; IPO/FPO; Collab; SPAC; and Strat inv] (%)
- Quarterly Deal Counts by Category, Q1 2021 - Q3 2023
- Table 1-7: Quarterly Count of Deals, By 2023 Quarter, By Category [Technology/Research/Strategic Collaboration; Venture Capital/Private Investment; Acquisition, Merger, Strategic Investment; Licensing; Public Offering/SPAC; Manufacturing, Supply Chain; Outreach, Philanthropy, Education; Distribution, Co-Marketing; Spinout, Restructure; Conclude/Terminate Deal; Joint Venture; and Settle Litigation] (total number) (%)
- Table 1-8: Quarterly Count of Deals, by 2022 Quarter, By Category [Technology/Research/Strategic Collaboration; Venture Capital/Private Investment; Acquisition, Merger, Strategic Investment; Licensing; Public Offering/SPAC; Manufacturing, Supply Chain; Outreach, Philanthropy, Education; Distribution, Co-Marketing; Spinout, Restructure; Conclude/Terminate Deal; Joint Venture; and Settle Litigation] (total number) (%)
- Table 1-9: Quarterly Count of Deals, by 2021 Quarter, By Category [Technology/Research/Strategic Collaboration; Venture Capital/Private Investment; Acquisition, Merger, Strategic Investment; Licensing; Public Offering/SPAC; Manufacturing, Supply Chain; Outreach, Philanthropy, Education; Distribution, Co-Marketing; Spinout, Restructure; Conclude/Terminate Deal; Joint Venture; and Settle Litigation] (total number) (%)
- Table 1-10: Yearly Shares of Number of Deals, By Category [Technology/Research/Strategic Collaboration; Venture Capital/Private Investment; Acquisition, Merger, Strategic Investment; Licensing; Public Offering/SPAC; Manufacturing, Supply Chain; Outreach, Philanthropy, Education; Distribution, Co-Marketing; Spinout, Restructure; Conclude/Terminate Deal; Joint Venture; and Settle Litigation], 2021-2023 partial (%)
- Growth in Collaborations, Manufacturing/Supply Chain Deals, Licensing, Distribution/ Co-Marketing Highlight Activity in Cell and Gene Therapy
- Figure 1-9: Yearly Shares of Number of Deals, By Category [Technology/Research/Strategic Collaboration; Venture Capital/Private Investment; Acquisition, Merger, Strategic Investment; Licensing; Public Offering/SPAC; Manufacturing, Supply Chain; Outreach, Philanthropy, Education; Distribution, Co-Marketing; Spinout, Restructure; Conclude/Terminate Deal; Joint Venture; and Settle Litigation], 2021-2023 partial (%)
- Figure 1-10: Most Frequent Types of Deals, by Quarter, by Category [Technology/Research/Strategic Collaboration; Venture Capital/Private Investment; Acquisition, Merger, Strategic Investment; Licensing; Public Offering/SPAC; and Manufacturing, Supply Chain], 2021-2023 partial (Total number)
- A Look at Less Frequent CGT Deal Types
- Figure 1-11: Lower Frequency Deal Types, by Quarter, by Category [Outreach, Philanthropy, Education; Distribution, Co-Marketing; Spinout, Restructure; Conclude/Terminate Deal; Joint Venture; and Settle Litigation] (total number)
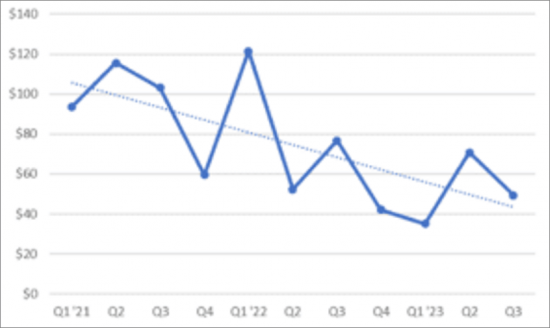
- Figure 1-12: Merger/ Acquisition Amount, by Quarter [Q1 2021 - Q3 2023] ($M)
- Figure 1-13: Venture Capital/Private Funding Round Amount, by Quarter [Q1 2021-Q3 2023] ($M)
- Figure 1-14: IPO/FPO Amount, by Quarter [Q1 2021-Q3 2023] ($M)
- Figure 1-15: SPAC Portion Amount, by Year 2021-2023 ($M)
- Most Active Companies
- Table 1-11: Most Active Companies in CGT Deals, Collaborations, Overall 2021-2023
- Figure 1-16: Most Active Companies in CGT Deals, Collaborations, Overall 2021-2023
Chapter 2: Venture Capital & Private Funding
- VC/Private Funding in Flux
- Figure 2-1: Total Number of VC/Private Funding Deals by Month, Jan 2021-Sep 2023 (count)
- Figure 2-2: Average VC/Private Funding Round Amount, by Quarter Q1 2021- Q1 2023 ($M)
- Table 2-1: Regional Venture Capital/Private Funding, by Quarter Q1 2021-Q3 2023, by Region[North America, Europe, APAC, Rest of World] ($M) (%)
- Figure 2-3: Quarterly Venture Capital/Private Total Funding, Q1 2021- Q1 2023, by Region [North America, Europe, APAC, Rest of World] ($M)
- Table 2-2: Regional Venture Capital/Private Funding Shares, by Quarter Q1 2021-Q3 2023, [North America, Europe, APAC, Rest of World] (%)
- Figure 2-4: Regional Venture Capital/Private Funding Shares, by Quarter Q1 2021-Q3 2023, by Region [North America, Europe, APAC, Rest of World] (%)
- Figure 2-5: Venture Capital/Private Funding Round Amounts, By Quarter [Q1 2021-Q3 2023] ($M)
- Figure 2-6: Scaled Venture Capital/Private Funding Round Amounts, By Quarter [Q1 2021-Q3 2023] ($M)
- Table 2-3: Venture Capital/Private Fundraising Deals, Q3 2023
- Table 2-4: Venture Capital/Private Fundraising Deals, Q2 2023
- Table 2-5: Venture Capital/Private Fundraising Deals, Q1 2023
- Table 2-6: Venture Capital/Private Fundraising Deals, Q4 2022
- Table 2-7: Venture Capital/Private, Q3 2022
- Table 2-8: Venture Capital/Private Fundraising Deals, Q2 2022
- Table 2-9: Venture Capital/Private Fundraising Deals, Q1 2022
Chapter 3: Strategic Investments
- Strategic Investments in Cell and Gene Therapy
- Figure 3-1: Total Number of Strategic Investments, By Quarter [Q1 2021-Q3 2023] (count)
- Figure 3-2: Average Strategic Investment Amount, By Quarter [Q1 2021-Q3 2023] ($M)
- Figure 3-3: Total Strategic Investments, By Quarter [Q1 2021-Q3 2023] ($M)
- Table 3-1: Strategic Investment Total Amounts, Counts, and Averages by Quarter, Q1 2021-Q3 2023, ($M)
- Table 3-2: Strategic Investments, January 2021-September 2023
- Table 3-3: Most Active in Acquisition/Merger/Strategic Investment, 2021-2023
- Figure 3-4: Most Active in Acquisition/Merger/ Strategic Investment, 2021-2023
Chapter 4: IPOs, FPOs, & SPACs
- North America Sees the Majority of Proceeds from IPOs, FPOs, SPACs
- Figure 4-1: Total Number of IPOs/ FPOs, By Month [Jan 2021-Sep 2023] (count)
- Figure 4-2: Average IPO/FPO Proceeds, By Quarter [Q1 2021-Q3 2023] ($M)
- Table 4-1: Quarterly IPO/FPO Total Funding, Q1 2021-Q3 2023, by Region [North America, Europe, APAC] ($M)
- Figure 4-3: Total IPO/FPO Funding, By Quarter [Q1 2021-Q3 2023], by Region [North America, Europe, APAC] ($M)
- Table 4-2: Regional IPO/FPO Funding Shares, by Quarter, Q1 2021-Q3 2023, by Region [North America, Europe, APAC] (%)
- Figure 4-4: Regional IPO/FPO Funding Shares, By Quarter, Q1 2021-Q3 2023, by Region [North America, APAC, and Europe) (%)
- Figure 4-5: IPO/FPO Amounts, By Quarter [Q1 2021-Q3 2023] ($M)
- Table 4-3: Quarterly SPAC Funding Portion, Q1 2021-Q3 2023 ($M)
- Figure 4-6: Quarterly SPAC Funding Portion Total and Average, Q1 2021-Q3 2023 ($M)
- Table 4-4: IPO/FPO Deals, Q3 2023
- Table 4-5: IPO/FPO Deals, Q2 2023
- Table 4-6: IPO/FPO Deals, Q1 2023
- Table 4-7: IPO/FPO Deals, Q4 2022
- Table 4-8: IPO/FPO Deals, Q3 2022
- Table 4-9: IPO/FPO Deals, Q2 2022
- Table 4-10: IPO/FPO Deals, Q1 2022
- Table 4-11: SPAC Portion, January 2021-September 2023 ($M)
- Figure 4-7: SPAC Portion Amount, by Year, 2021-2023 ($M)
Chapter 5: Mergers & Acquisitions (M&A)
- Growing Numbers of M&A, Despite Lower Average Value
- Figure 5-1: Total Number of Mergers and Acquisitions, By Month [Jan 2021-Sep 2023] (count)
- Figure 5-2: Average Merger/Acquisition Amount, By Quarter [Q1 2021-Q3 2023] ($M)
- Table 5-1: Quarterly Merger and Acquisition Values, Counts, and Averages, Q1 2021-Q3 2023 ($M) (Total count)
- Figure 5-3: Merger/Acquisition Transactions Global Total, By Quarter [Q1 2022- Q3 2023] ($M)
- Figure 5-4: Merger/Acquisition Amounts, by Quarter [Q1 2021-Q3 2023] ($M)
- Table 5-2: Mergers and Acquisitions Announcements, Q3 2023 ($M)
- Table 5-3: Mergers and Acquisitions Announcements, Q2 2023 ($M)
- Table 5-4: Mergers and Acquisitions Announcements, Q1 2023 ($M)
- Table 5-5: Mergers and Acquisitions, Q4 2022 ($M)
- Table 5-6: Mergers and Acquisitions, Q3 2022 ($M)
- Table 5-7: Mergers and Acquisitions, Q2 2022 ($M)
- Table 5-8: Mergers and Acquisitions, Q1 2022 ($M)
- Table 5-9: Most Active in Acquisition/Merger/Strategic Investment, 2021-2023 (count)
- Figure 5-5: Most Active in Acquisition/Merger/Strategic Investment, 2021-2023
Chapter 6: Technology/Research/Strategic Collaborations
- CGT Market Sees a Broad Variety of Collaborations
- Figure 6-1: Total Number of Tech/Research/Strategic Collaborations, By Month [Jan 2021-Sep 2023] (count)
- Figure 6-2: Total Number of Collaborations with Upfront and/or Milestone Payments, By Quarter [Q1 2021-Q3 2023] ($M)
- Table 6-1: Collaboration Upfront and Future/Milestone Payments, Counts, Averages, Q1 2021-Q3 2023 ($M) (count)
- Figure 6-3: Average Collaboration Upfront Payment, By Quarter [Q1 2021-Q3 2023] ($M)
- Figure 6-4: Research Collaboration Upfront Payments, By Quarter [Q1 2021-Q3 2023] ($M)
- Figure 6-5: Average Collaboration Future/Milestone Payments, By Quarter [Q1 2021-Q3 2023] ($M)
- Figure 6-6: Total Collaboration Future/Milestone Payments, By Quarter [Q2 2021-Q3 2023] ($M)
- Table 6-2: Technology/Research/Strategic Collaboration Deals, Q3 2023
- Table 6-3: Technology/Research/Strategic Collaboration Deals, Q2 2023
- Table 6-4: Technology/Research/Strategic Collaboration Deals, Q1 2022-Q3 2023
- Table 6-5: Most Active in Research/Strategic Collaborations, 2021-2023 (count)
- Figure 6-7: Most Active in Research/Strategic Collaborations, 2021-2023 (count)
Chapter 7: Licensing
- Stable Levels of Licensing in the Cell and Gene Therapy Market
- Figure 7-1: Total Number of Licensing Deals, By Month [Jan 2021-Sep 2023] (count)
- Table 7-1: Licensing Deals, Q3 2023
- Table 7-2: Licensing Deals, Q2 2023
- Table 7-3: Licensing Deals, Q1 2022-Q1 2023
- Table 7-4: Most Active Companies in Licensing Deals, 2021-2023 (count)
- Figure 7-2: Most Active Companies in Licensing Deals, 2021-2023 (count)
Chapter 8: Manufacturing and Supply Chain
- Major Growth in Manufacturing and Supply Chain Management Activity in CGT
- Figure 8-1: Total Number of Supply/ Manufacturing Deals, By Month [Jan 2021-Sep 2023] (count)
- Table 8-1: Manufacturing and Supply Chain Deals, Q3 2023
- Table 8-2: Manufacturing and Supply Chain Deals, Q2 2023
- Table 8-3: Manufacturing and Supply Chain Deals, Q1 2022-Q3 2023
- Table 8-4: Most Active Companies in Manufacturing/ Supply Deals, 2021-2023 (count)
- Figure 8-2: Most Active Companies in Manufacturing/ Supply Deals, 2021-2023 (count)
Chapter 9: Public Outreach, Education, & Philanthropy
- CGT Market Focusing Less on Public Outreach, Patient/ Consumer/ Trainee Education, and Philanthropy
- Figure 9-1: Total Number of Outreach/ Philanthropy/ Education Deals, By Month [Jan 2021-Sep 2023] (count)
- Table 9-1: Outreach, Education, & Philanthropy Deals, January 2022-Aug 2023
Chapter 10: Distribution & Co-Marketing
- A Look at CGT Distribution and Co-Marketing Deals
- Figure 10-1: Total Number of Distribution/ Co-Marketing Deals, by Month [Jan 2021-Sep 2023] (count)
- Table 10-1: Distribution & Co-Marketing Deals, Q3 2023
- Table 10-2: Distribution & Co-Marketing Deals, Q2 2023
- Table 10-3: Distribution & Co-Marketing Deals, Q1 2022-Q1 2023
Chapter 11: Other - JV, Restructuring, Termination, Spinoffs
- A Look at Other Types of Deals Impacting Cell and Gene Therapy
- Figure 11-1: Total Number of JV, Restructuring, Termination, By Month [Jan 2021-Sep 2023] (Total count)
- Table 11-1: Restructuring, JV, Termination, Spinoffs, January 2022-Sep 2023
 细胞及基因治疗药物传递市场-全球及区域分析:依治疗类型、传递方式及区域-分析与预测(2025-2035)
 细胞疗法製造市场规模、份额、按治疗类型、细胞来源、业务规模和地区进行的成长分析 - 产业预测,2025 年至 2032 年
 美国细胞治疗材料市场:市场规模、份额、趋势分析(按产品、最终用途和地区)、细分市场预测(2025-2033)
 自动化细胞处理系统市场产业趋势及全球预测 - 依细胞疗法处理步骤、依业务规模、依最终用户、依主要地区细胞和基因治疗市场(按治疗类型、应用、最终用户和地区划分)
 日本细胞治疗市场报告(按细胞类型、治疗类型、治疗领域、最终用户和地区)2025-2033同类细胞疗法市场:细胞疗法类别,细胞来历,各标的适应症,各治疗领域,各主要地区
 细胞治疗技术市场、规模、占有率、趋势、行业分析报告:依治疗类型、技术、应用、地区、2025-2034市场预测
 细胞治疗的共同研究及授权契约:2016年~2025年
 细胞和基因治疗生物製造市场-全球和区域分析:按产品类型、应用、用途、最终用户和区域-分析和预测(2025-2035)