


 |
市场调查报告书
商品编码
1795417
全球阀门定位器市场(按驱动类型、行业、类型和地区)预测至 2030 年Valve Positioner Market by Type (Pneumatic Positioners, Electro-pneumatic Positioners, Digital Positioners), Actuation (Single Acting Positioners, Double Acting Positioners), Industry (Oil & Gas, Energy & Power) and Region - Global Forecast to 2030 |
||||||
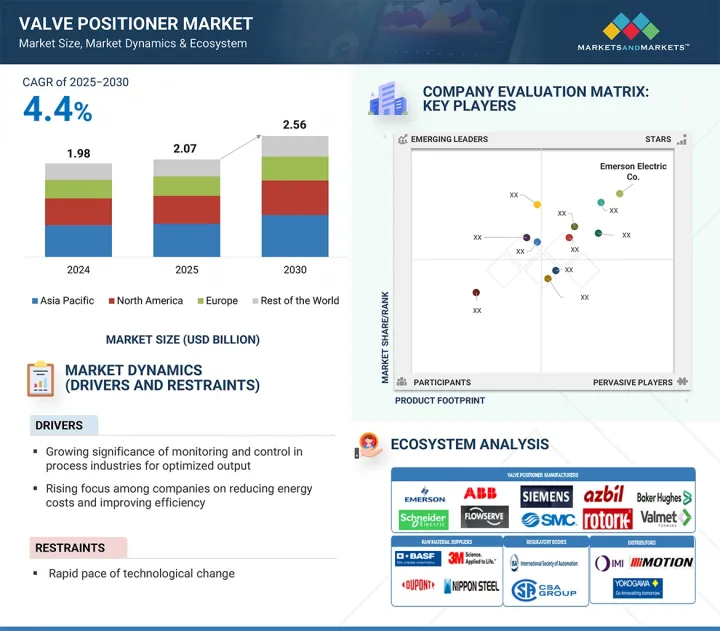
全球阀门定位器市场预计将从 2025 年的 20.7 亿美元成长到 2030 年的 25.6 亿美元,复合年增长率为 4.4%。
推动这一成长的动力源于对精确控制、流程自动化以及整个工业营运向智慧阀门管理转型的需求日益增长。随着各行各业寻求优化製程响应能力、减少阀门相关故障并满足严格的品质标准,阀门定位器正成为在波动的运作条件下实现稳定性能的关键部件。金属和采矿、化学加工、製药和发电等行业正在扩大其对先进阀门定位器的应用,以可靠地控制压力敏感的关键任务应用。
| 调查范围 | |
|---|---|
| 调查年份 | 2021-2030 |
| 基准年 | 2024 |
| 预测期 | 2025-2030 |
| 对价单位 | 金额(十亿美元) |
| 按细分市场 | 依经营类型、行业、类型、地区 |
| 目标区域 | 北美、欧洲、亚太地区及其他地区 |
此外,在批次频繁变化且流量可变的製造环境中,阀门定位器正被用于提高产量并减少浪费。与智慧仪器网路、状态监控系统和工厂控制架构的集成,提高了操作灵活性并减少了人工干预。随着对自适应控制、远端性能优化和生命週期效率的需求不断增长,阀门定位器有望在全球各行业实现下一代工业自动化策略方面发挥重要作用。
预计在预测期内,单作用执行器将占据阀门定位器市场的最大份额,这得益于在优先考虑安全性、可靠性和能源效率的关键製程工业中,单作用执行器的应用日益广泛。石油和天然气、水和污水处理以及化学加工等行业越来越多地选择单作用致动器,因为它们具有故障安全功能——在发生空气异常时能够自动将阀门返回到指定位置(打开或关闭)。此功能可确保操作安全并最大限度地降低危险环境中的风险。数位阀门定位器与单作用致动器的集成,透过实现精确控制、即时诊断和预测性维护,进一步增强了该领域的主导地位。这些优势不仅可以提高系统效能,还可以减少停机时间和维护成本。此外,单作用致动器的低空气消费量和易于安装使其非常适合简单性和可靠性至关重要的偏远和危险场所。随着各行各业寻求简化业务并与永续性目标保持一致,单作用致动器透过提供支援合规性和业务连续性的强大、经济高效的解决方案来巩固其市场主导地位。
2024年,能源和电力产业占据阀门定位器市场第二大份额,这得益于发电和配电领域对高效流量控制和系统可靠性提升的需求不断增长。随着全球能源消费量的增加和电网的日益复杂,公用事业公司越来越多地部署先进的阀门定位器,以优化热电厂、核能和可再生能源发电中蒸气、燃气和冷却系统的控制。现代电力设施正在采用智慧阀门定位器,以实现更严格的控制迴路,减少设备的机械应力,并改善负载管理。向生物质能、太阳能和地热能等再生能源来源的转变进一步加剧了对精确流量调节的需求,使得阀门定位器成为确保製程稳定性和效率的关键部件。此外,世界各地不断升级老化电力基础设施和增加新发电能力的努力也正在推动这些解决方案的采用。阀门定位器还支援排放法规并有助于满足严格的能源效率法规,从而增强了其作为不断发展的能源格局中一项重要技术的作用。
亚太地区是阀门定位器市场成长最快的地区,预计在预测期内将实现最高的复合年增长率。这一快速成长的动力源自于工业化进程的加速、基础设施的建设以及石油天然气、化学、水和用水和污水处理以及发电等关键产业日益普及的自动化技术。中国、印度、韩国和东南亚等国家正在大力投资,以实现製造业和流程工业的现代化,以提高生产力并满足日益增长的国内和出口需求。该地区大力推进工业4.0和智慧製造,加速了数位阀门定位器的普及,这些定位器具有精确控制、远距离诊断和系统整合等优势。此外,政府支持清洁能源、高效水资源管理和工业自动化的措施也为市场扩张创造了有利环境。升级老化基础设施和满足更严格的环境法规的需求进一步推动了对先进阀门控制解决方案的需求。随着对能源效率、永续性和运作可靠性的日益关注,亚太地区正逐渐成为阀门定位器应用的关键枢纽,并巩固了其作为最具活力和发展最快的区域市场的地位。
本报告研究了全球阀门定位器市场,提供了按驱动类型、行业、类型和地区分類的趋势信息,以及参与市场的公司概况。
目录
第一章 引言
第二章调查方法
第三章执行摘要
第四章重要考察
第五章市场概述
- 介绍
- 市场动态
- 价值链分析
- 生态系分析
- 定价分析
- 影响客户业务的趋势/中断
- 技术分析
- 波特五力分析
- 主要相关人员和采购标准
- 案例研究
- 贸易分析
- 专利分析
- 2025-2026年主要会议和活动
- 标准和法规
- 人工智慧/生成人工智慧对阀门定位器市场的影响
- 2025年美国关税对阀门定位器市场的影响
第六章 阀门定位器市场(依驱动类型)
- 介绍
- 单作用
- 双作用
第七章阀门定位器市场(按行业)
- 介绍
- 石油和天然气
- 水和污水处理
- 能源与电力
- 化学品
- 纸和纸浆
- 製药
- 金属和采矿
- 食品/饮料
- 其他的
第八章 阀门定位器市场(按类型)
- 介绍
- 气动定位器
- 电控气动定位器
- 数位定位器
第九章 阀门定位器市场(按地区)
- 介绍
- 北美洲
- 美国
- 加拿大
- 墨西哥
- 欧洲
- 英国
- 德国
- 法国
- 其他的
- 亚太地区
- 中国
- 日本
- 印度
- 其他的
- 其他地区
- 中东和非洲
- 南美洲
第十章 竞争格局
- 概述
- 主要参与企业的策略/优势,2023-2025年
- 2020-2024年收益分析
- 2024年市场占有率分析
- 竞争力评估矩阵:2024年主要参与企业评估
- 竞争力评估矩阵:Start-Ups/中小企业评估,2024 年
- 竞争场景
第十一章 公司简介
- 主要参与企业
- EMERSON ELECTRIC CO.
- ABB
- FLOWSERVE CORPORATION
- SIEMENS
- SCHNEIDER ELECTRIC
- SMC CORPORATION
- AZBIL CORPORATION
- BAKER HUGHES
- ROTORK PLC
- VALMET
- 其他公司
- SAMSONCONTROLS.NET.
- VRG CONTROLS, LLC
- FESTO SE & CO. KG(FESTO)
- BADGER METER, INC.
- CONTROLAIR
- CRANE COMPANY
- CHRISTIAN BURKERT GMBH & CO. KG
- GEMU GROUP
- DWYER INSTRUMENTS LTD
- VRC
- POWER-GENEX LTD.
- VAL CONTROLS
- BRAY INTERNATIONAL
- NIHON KOSO CO., LTD.
- SPIRAX SARCO LIMITED
第十二章 附录
With a CAGR of 4.4%, the global valve positioner market is projected to grow from USD 2.07 billion in 2025 to USD 2.56 billion by 2030. Growth is expected to be driven by the increasing need for precision control, automation of flow processes, and the shift toward intelligent valve management across industrial operations. As industries aim to optimize process responsiveness, reduce valve-related failures, and meet stringent quality standards, valve positioners are becoming critical components in achieving consistent performance under variable operating conditions. Industries such as metals and mining, chemical processing, pharmaceuticals, and power generation are expanding the use of advanced valve positioners to ensure tight control in pressure-sensitive and mission-critical applications.
| Scope of the Report | |
|---|---|
| Years Considered for the Study | 2021-2030 |
| Base Year | 2024 |
| Forecast Period | 2025-2030 |
| Units Considered | Value (USD Billion) |
| Segments | By Type, Actuation, Industry, and Region |
| Regions covered | North America, Europe, APAC, RoW |
Additionally, manufacturing environments with frequent batch changes and variable flows adopt positioners to improve throughput and reduce waste. Integration with smart instrumentation networks, condition monitoring systems, and plant control architectures enhances operational flexibility and reduces manual intervention. As the demand for adaptive control, remote performance optimization, and lifecycle efficiency increases, valve positioners are expected to play a growing role in enabling next-generation industrial automation strategies across global sectors.
By actuation type, the single-acting segment is expected to hold the largest market share during the forecast period.
The single-acting actuation segment is projected to hold the largest share of the valve positioner market during the forecast period, driven by its growing adoption in critical process industries that prioritize safety, reliability, and energy efficiency. Industries such as oil & gas, water & wastewater treatment, and chemical processing are increasingly selecting single-acting actuators due to their fail-safe capability-automatically returning the valve to a predetermined position (open or closed) in the event of air failure. This functionality ensures operational security and minimizes risks in high-stakes environments. The integration of digital valve positioners with single-acting actuators is further strengthening the segment's dominance, enabling precise control, real-time diagnostics, and predictive maintenance. These benefits not only enhance system performance but also reduce downtime and maintenance costs. Moreover, single-acting actuators consume less air and are easier to install, making them well-suited for remote or hazardous locations where simplicity and reliability are essential. As industries aim to streamline operations and align with sustainability goals, single-acting actuation offers a robust, cost-effective solution that supports compliance and operational continuity, reinforcing its leading position in the market.
Industry
By industry, the energy and power sector is likely to hold the second-largest market share during the forecast period.
The energy and power sector secured the second-largest share in the valve positioner market during 2024, supported by the growing demand for efficient flow control and enhanced system reliability in power generation and distribution. As global energy consumption rises and power grids become more complex, utilities are increasingly implementing advanced valve positioners to optimize control over steam, gas, and cooling systems in thermal, nuclear, and renewable energy plants. Modern power facilities are adopting smart valve positioners to enable tighter control loops, reduce mechanical stress on equipment, and improve load management. The transition toward renewable energy sources-such as biomass, solar thermal, and geothermal-further strengthens the need for accurate flow regulation, making valve positioners a critical component in ensuring process stability and efficiency. Moreover, ongoing efforts to upgrade aging power infrastructure and add new generation capacity worldwide are driving the adoption of these solutions. Valve positioners also support emission control and help meet stringent energy efficiency regulations, reinforcing their role as an essential technology in the evolving energy landscape..
By Region, Asia Pacific is projected to be the fastest-growing market during the forecast period.
Asia Pacific is projected to be the fastest-growing region in the valve positioner market, registering the highest CAGR during the forecast period. This rapid growth is driven by expanding industrialization, infrastructure development, and increasing adoption of automation technologies across key sectors such as oil & gas, chemicals, water and wastewater treatment, and power generation. Countries like China, India, South Korea, and Southeast Asian nations are making significant investments in modernizing their manufacturing and process industries to enhance productivity and meet rising domestic and export demands. The region's push toward Industry 4.0 and smart manufacturing is accelerating the deployment of digital valve positioners, which offer benefits such as precise control, remote diagnostics, and system integration. Moreover, government initiatives supporting clean energy, efficient water management, and industrial automation are creating a favorable environment for market expansion. The need to upgrade aging infrastructure and meet stricter environmental regulations further fuels demand for advanced valve control solutions. With growing focus on energy efficiency, sustainability, and operational reliability, the Asia Pacific is emerging as a key hub for valve positioner adoption, driving its position as the most dynamic and rapidly advancing regional market..
Breakdown of primaries
A variety of executives from key organizations operating in the valve positioner market were interviewed in-depth, including CEOs, marketing directors, and innovation and technology directors.
- By Company Type: Tier 1 - 45%, Tier 2 - 35%, and Tier 3 - 20%
- By Designation: Directors - 45%, C-level - 30%, and Others - 25%
- By Region: North America - 45%, Europe - 25%, Asia Pacific - 20%, and RoW - 10%
Note: Other designations include sales and product managers and project engineers. The three tiers of the companies are defined based on their total revenue in 2024: Tier 1 - revenue greater than or equal to USD 1 billion; Tier 2 - revenue between USD 100 million and USD 1 billion; and Tier 3 revenue less than or equal to USD 100 million.
Major players profiled in this report are as follows:
Emerson Electric Co. (US), Siemens (Germany), ABB (Switzerland), Flowserve Corporation (US), Schneider Electric (France), SMC Corporation (Japan), Azbil Corporation (Japan), Baker Hughes (US), Rotork plc (UK), Valmet (Finland), samsoncontrols.net. (Germany), VRG Controls, LLC (US), Festo SE & Co. KG (Festo) (Germany), Badger Meter, Inc. (US), ControlAir (US), Crane Company (US), Christian Burkert GmbH & Co. KG (Germany), GEMU Group (Germany), Dwyer Instruments, LLC (US), VRC (US), POWER GENEX (South Korea), Val Controls (Denmark), Bray International (US), NIHON KOSO CO., LTD. (Japan), Spirax Sarco Limited (UK).
The study provides a detailed competitive analysis of these key players in the valve positioner market, presenting their company profiles, most recent developments, and key market strategies.
Study Coverage
In this report, the valve positioner market has been segmented based on type, actuation, industry, and region. The type segment includes digital, electro-pneumatic, and pneumatic. The actuation segment comprises single-acting and double-acting. The industry segment comprises oil & gas, energy & power, water & wastewater treatment, food & beverages, metals & mining, chemicals, pharmaceuticals, pulp & paper, and other industries. The market has been segmented into four regions - North America, Asia Pacific, Europe, and Rest of the World (RoW).
Reasons to buy the report
The report will help the leaders/new entrants in this market with information on the closest approximations of the revenue numbers for the overall market and the sub-segments. This report will help stakeholders understand the competitive landscape and gain more insights to position their businesses better and plan suitable go-to-market strategies. The report also helps stakeholders understand the valve positioner market's pulse and provides information on key market drivers, restraints, challenges, and opportunities.
Key Benefits of Buying the Report
- Analysis of key drivers (growing significance of monitoring and control in process industries for optimized output, valve positioners are helping industries cut energy costs and improve efficiency as global energy demand continues to rise, rising adoption of smart valve positioners in various plant operations), restraints (fast-changing technology are slowing the adoption of valve positioners), opportunities (increasing focus on remote operations and decentralized plants, focus of industry players on offering improved customer service), and challenges (positioner overshoot and oversized valves hinder operation of control valves) influencing the growth of the valve positioner market.
- Product Development/Innovation: Detailed insights on upcoming technologies, research and development activities, and new product launches in the valve positioner market.
- Market Development: Comprehensive information about lucrative markets - the report analyses the valve positioner market across varied regions.
- Market Diversification: Exhaustive information about new products/services, untapped geographies, recent developments, and investments in the valve positioner market.
- Competitive Assessment: In-depth assessment of market shares, growth strategies, and service offerings of leading players like Emerson Electric Co. (US), ABB (Switzerland), Siemens (Germany), Flowserve Corporation (US), Schneider Electric (France), and others.
TABLE OF CONTENTS
1 INTRODUCTION
- 1.1 STUDY OBJECTIVES
- 1.2 MARKET DEFINITION
- 1.3 STUDY SCOPE
- 1.3.1 MARKETS COVERED AND REGIONAL SCOPE
- 1.3.2 INCLUSIONS AND EXCLUSIONS
- 1.3.3 YEARS CONSIDERED
- 1.4 CURRENCY CONSIDERED
- 1.5 LIMITATIONS
- 1.6 STAKEHOLDERS
- 1.7 SUMMARY OF CHANGES
2 RESEARCH METHODOLOGY
- 2.1 RESEARCH DATA
- 2.1.1 SECONDARY AND PRIMARY RESEARCH
- 2.1.2 SECONDARY DATA
- 2.1.2.1 List of key secondary sources
- 2.1.2.2 Key data from secondary sources
- 2.1.3 PRIMARY DATA
- 2.1.3.1 List of key primary interview participants
- 2.1.3.2 Breakdown of primaries
- 2.1.3.3 Key data from primary sources
- 2.1.3.4 Key industry insights
- 2.2 MARKET SIZE ESTIMATION METHODOLOGY
- 2.2.1 BOTTOM-UP APPROACH
- 2.2.1.1 Approach to estimate market size using bottom-up analysis (demand side)
- 2.2.2 TOP-DOWN APPROACH
- 2.2.2.1 Approach to estimate market size using top-down analysis (supply side)
- 2.2.1 BOTTOM-UP APPROACH
- 2.3 MARKET BREAKDOWN AND DATA TRIANGULATION
- 2.4 RESEARCH ASSUMPTIONS
- 2.5 RISK ANALYSIS
3 EXECUTIVE SUMMARY
4 PREMIUM INSIGHTS
- 4.1 ATTRACTIVE GROWTH OPPORTUNITIES FOR KEY PLAYERS IN VALVE POSITIONER MARKET
- 4.2 VALVE POSITIONER MARKET, BY TYPE
- 4.3 VALVE POSITIONER MARKET, BY ACTUATION
- 4.4 VALVE POSITIONER MARKET, BY INDUSTRY
- 4.5 VALVE POSITIONER MARKET, BY COUNTRY
5 MARKET OVERVIEW
- 5.1 INTRODUCTION
- 5.2 MARKET DYNAMICS
- 5.2.1 DRIVERS
- 5.2.1.1 Growing significance of monitoring and control in process industries for optimized output
- 5.2.1.2 Increasing pressure to cut costs and operate more efficiently
- 5.2.1.3 Seamless integration with advanced control systems
- 5.2.2 RESTRAINTS
- 5.2.2.1 Rapid changes in industrial automation technologies
- 5.2.3 OPPORTUNITIES
- 5.2.3.1 Shift toward remote operations and decentralized facilities
- 5.2.3.2 Unlocking automation with self-powered valve positioners in remote sites
- 5.2.4 CHALLENGES
- 5.2.4.1 Challenges associated with oversized control valves and positioner overshoot
- 5.2.1 DRIVERS
- 5.3 VALUE CHAIN ANALYSIS
- 5.4 ECOSYSTEM ANALYSIS
- 5.5 PRICING ANALYSIS
- 5.5.1 AVERAGE SELLING PRICE OF DIFFERENT TYPES OF VALVE POSITIONERS, BY KEY PLAYER, 2024
- 5.6 TRENDS/DISRUPTIONS IMPACTING CUSTOMER BUSINESS
- 5.7 TECHNOLOGY ANALYSIS
- 5.7.1 KEY TECHNOLOGIES
- 5.7.1.1 Digital communication protocols
- 5.7.1.2 Position feedback sensors
- 5.7.2 ADJACENT TECHNOLOGIES
- 5.7.2.1 SCADA
- 5.7.3 COMPLEMENTARY TECHNOLOGIES
- 5.7.3.1 Digital twin
- 5.7.1 KEY TECHNOLOGIES
- 5.8 PORTER'S FIVE FORCES ANALYSIS
- 5.8.1 THREAT OF NEW ENTRANTS
- 5.8.2 THREAT OF SUBSTITUTES
- 5.8.3 BARGAINING POWER OF SUPPLIERS
- 5.8.4 BARGAINING POWER OF BUYERS
- 5.8.5 INTENSITY OF COMPETITIVE RIVALRY
- 5.9 KEY STAKEHOLDERS AND BUYING CRITERIA
- 5.9.1 KEY STAKEHOLDERS IN BUYING PROCESS
- 5.9.2 BUYING CRITERIA
- 5.10 CASE STUDIES
- 5.11 TRADE ANALYSIS
- 5.11.1 IMPORT DATA (HS CODE 8481)
- 5.11.2 EXPORT DATA (HS CODE 8481)
- 5.12 PATENT ANALYSIS
- 5.13 KEY CONFERENCES AND EVENTS, 2025-2026
- 5.14 STANDARDS AND REGULATIONS
- 5.14.1 STANDARDS
- 5.14.2 REGULATORY BODIES, GOVERNMENT AGENCIES, AND OTHER ORGANIZATIONS
- 5.15 IMPACT OF AI/GENERATIVE AI ON VALVE POSITIONER MARKET
- 5.15.1 INTRODUCTION
- 5.15.2 IMPACT OF AI ON VALVE POSITIONER MARKET
- 5.15.3 TOP USE CASES AND MARKET POTENTIAL
- 5.16 IMPACT OF 2025 US TARIFF ON VALVE POSITIONER MARKET
- 5.16.1 INTRODUCTION
- 5.16.2 KEY TARIFF RATES
- 5.16.3 PRICE IMPACT ANALYSIS
- 5.16.4 IMPACT ON COUNTRY/REGION
- 5.16.4.1 US
- 5.16.4.2 Europe
- 5.16.4.3 Asia Pacific
- 5.16.5 IMPACT ON INDUSTRIES
6 VALVE POSITIONER MARKET, BY ACTUATION
- 6.1 INTRODUCTION
- 6.2 SINGLE-ACTING
- 6.2.1 EASY WORKING MECHANISM TO FUEL MARKET GROWTH
- 6.3 DOUBLE-ACTING
- 6.3.1 GROWING DEMAND FOR COMPACT-SIZE VALVES TO DRIVE MARKET
7 VALVE POSITIONER MARKET, BY INDUSTRY
- 7.1 INTRODUCTION
- 7.2 OIL & GAS
- 7.2.1 EMPHASIS ON REDUCING OPERATIONAL COSTS AND ENHANCE EFFICIENCY OF PLANTS TO DRIVE MARKET
- 7.3 WATER & WASTEWATER TREATMENT
- 7.3.1 RISING DEMAND FOR EFFECTIVE WATER MANAGEMENT ACROSS ENERGY AND URBAN INFRASTRUCTURE SECTORS TO FUEL MARKET GROWTH
- 7.4 ENERGY & POWER
- 7.4.1 INCREASING INVESTMENTS IN ENERGY SECTORS TO OFFER LUCRATIVE GROWTH OPPORTUNITIES
- 7.5 CHEMICALS
- 7.5.1 RISING FOCUS ON BOOSTING CHEMICAL PLANT SAFETY TO FUEL MARKET GROWTH
- 7.6 PAPER & PULP
- 7.6.1 ADOPTION OF DIGITALIZED PROCESSES TO OFFER LUCRATIVE GROWTH OPPORTUNITIES
- 7.7 PHARMACEUTICALS
- 7.7.1 STRINGENT REGULATORY GUIDELINES AND INCREASING COMPLEXITIES IN PRODUCT LINES TO BOOST DEMAND
- 7.8 METALS & MINING
- 7.8.1 INCREASING PRESSURE TO OPTIMIZE PROCESSES AND REDUCE UNPLANNED DOWNTIME TO SUPPORT MARKET GROWTH
- 7.9 FOOD & BEVERAGES
- 7.9.1 RISING SUSTAINABLE INTENSIFICATION OF AGRICULTURE TO BOOST PRODUCTIVITY TO FUEL MARKET GROWTH
- 7.10 OTHER INDUSTRIES
8 VALVE POSITIONER MARKET, BY TYPE
- 8.1 INTRODUCTION
- 8.2 PNEUMATIC POSITIONERS
- 8.2.1 ABILITY TO WORK EFFICIENTLY IN ADVERSE ENVIRONMENTAL CONDITIONS TO BOOST DEMAND
- 8.3 ELECTRO-PNEUMATIC POSITIONERS
- 8.3.1 ABILITY TO OFFER SOLUTIONS WITHOUT SIGNIFICANT INFRASTRUCTURE OR WORKFORCE TRAINING UPGRADES TO FUEL MARKET GROWTH
- 8.4 DIGITAL POSITIONERS
- 8.4.1 RISING DEMAND FOR AUTOMATED AND DATA-DRIVEN PLANT OPERATIONS TO FOSTER MARKET GROWTH
9 VALVE POSITIONER MARKET, BY REGION
- 9.1 INTRODUCTION
- 9.2 NORTH AMERICA
- 9.2.1 US
- 9.2.1.1 Growing investment in automation technologies to drive market
- 9.2.2 CANADA
- 9.2.2.1 Emphasis on improving water and wastewater infrastructure to foster market growth
- 9.2.3 MEXICO
- 9.2.3.1 Focus on expanding electricity generation, transmission, and distribution infrastructure to support market growth
- 9.2.1 US
- 9.3 EUROPE
- 9.3.1 UK
- 9.3.1.1 Rising focus digital automation to offer lucrative growth opportunities
- 9.3.2 GERMANY
- 9.3.2.1 Development of national hydrogen core network to foster market growth
- 9.3.3 FRANCE
- 9.3.3.1 Increasing demand for precision control technologies across energy sector to fuel market growth
- 9.3.4 REST OF EUROPE
- 9.3.1 UK
- 9.4 ASIA PACIFIC
- 9.4.1 CHINA
- 9.4.1.1 Emphasis on industrial modernization to boost demand
- 9.4.2 JAPAN
- 9.4.2.1 Need to optimize flow regulation and pressure control in fuel-based power plants to support market growth
- 9.4.3 INDIA
- 9.4.3.1 Government-led initiatives to boost adoption of automation components to fuel market growth
- 9.4.4 REST OF ASIA PACIFIC
- 9.4.1 CHINA
- 9.5 ROW
- 9.5.1 MIDDLE EAST & AFRICA
- 9.5.1.1 GCC
- 9.5.1.1.1 Adoption of Industry 4.0 technologies to offer lucrative growth opportunities
- 9.5.1.2 Africa & Rest of Middle East
- 9.5.1.1 GCC
- 9.5.2 SOUTH AMERICA
- 9.5.2.1 Brazil
- 9.5.2.1.1 Expanding public utilities and improving service reliability to support market growth
- 9.5.2.2 Rest of South America
- 9.5.2.1 Brazil
- 9.5.1 MIDDLE EAST & AFRICA
10 COMPETITIVE LANDSCAPE
- 10.1 OVERVIEW
- 10.2 KEY PLAYER STRATEGIES/RIGHT TO WIN, 2023-2025
- 10.3 REVENUE ANALYSIS, 2020-2024
- 10.4 MARKET SHARE ANALYSIS, 2024
- 10.5 COMPETITIVE EVALUATION MATRIX, 2024
- 10.5.1 STARS
- 10.5.2 EMERGING LEADERS
- 10.5.3 PERVASIVE PLAYERS
- 10.5.4 PARTICIPANTS
- 10.5.5 VALVE POSITIONER MARKET: COMPANY FOOTPRINT
- 10.5.5.1 Company footprint
- 10.5.5.2 Region footprint
- 10.5.5.3 Type footprint
- 10.5.5.4 Industry footprint
- 10.6 COMPANY EVALUAITON MATRIX: STARTUPS/SMES EVALUATION, 2024
- 10.6.1 PROGRESSIVE COMPANIES
- 10.6.2 RESPONSIVE COMPANIES
- 10.6.3 DYNAMIC COMPANIES
- 10.6.4 STARTING BLOCKS
- 10.6.5 COMPETITIVE BENCHMARKING: STARTUPS/SMES, 2024
- 10.6.5.1 List of key startups/SMEs
- 10.6.5.2 Competitive benchmarking of key startups/SMEs
- 10.7 COMPETITIVE SCENARIO
- 10.7.1 DEALS
- 10.7.2 EXPANSIONS
- 10.7.3 DEVELOPMENTS
11 COMPANY PROFILES
- 11.1 KEY PLAYERS
- 11.1.1 EMERSON ELECTRIC CO.
- 11.1.1.1 Business overview
- 11.1.1.2 Products/Services/Solutions offered
- 11.1.1.3 Recent developments
- 11.1.1.3.1 Emerson Electric Co.: Deals
- 11.1.1.4 MnM view
- 11.1.1.4.1 Key strengths/Right to win
- 11.1.1.4.2 Strategic choices
- 11.1.1.4.3 Weaknesses/Competitive threats
- 11.1.2 ABB
- 11.1.2.1 Business overview
- 11.1.2.2 Products/Services/Solutions offered
- 11.1.2.3 MnM view
- 11.1.2.3.1 Key strengths/Right to win
- 11.1.2.3.2 Strategic choices
- 11.1.2.3.3 Weaknesses/Competitive threats
- 11.1.3 FLOWSERVE CORPORATION
- 11.1.3.1 Business overview
- 11.1.3.2 Products/Services/Solutions offered
- 11.1.3.3 Recent developments
- 11.1.3.3.1 Flowserve Corporation: Developments
- 11.1.3.4 MnM view
- 11.1.3.4.1 Key strengths/Right to win
- 11.1.3.4.2 Strategic choices
- 11.1.3.4.3 Weaknesses/Competitive threats
- 11.1.4 SIEMENS
- 11.1.4.1 Business overview
- 11.1.4.2 Products/Services/Solutions offered
- 11.1.4.3 MnM view
- 11.1.4.3.1 Key strengths/Right to win
- 11.1.4.3.2 Strategic choices
- 11.1.4.3.3 Weaknesses/Competitive threats
- 11.1.5 SCHNEIDER ELECTRIC
- 11.1.5.1 Business overview
- 11.1.5.2 Products/Services/Solutions offered
- 11.1.5.3 MnM view
- 11.1.5.3.1 Key strengths/Right to win
- 11.1.5.3.2 Strategic choices
- 11.1.5.3.3 Weaknesses/Competitive threats
- 11.1.6 SMC CORPORATION
- 11.1.6.1 Business overview
- 11.1.6.2 Products/Services/Solutions offered
- 11.1.7 AZBIL CORPORATION
- 11.1.7.1 Business overview
- 11.1.7.2 Products/Services/Solutions offered
- 11.1.7.3 Recent developments
- 11.1.7.3.1 Azbil Corporation: Expansions
- 11.1.8 BAKER HUGHES
- 11.1.8.1 Business overview
- 11.1.8.2 Products/Services/Solutions offered
- 11.1.9 ROTORK PLC
- 11.1.9.1 Business overview
- 11.1.9.2 Products/Services/Solutions offered
- 11.1.9.3 Recent developments
- 11.1.9.3.1 Rotork Plc: Deals
- 11.1.10 VALMET
- 11.1.10.1 Business overview
- 11.1.10.2 Products/Services/Solutions offered
- 11.1.1 EMERSON ELECTRIC CO.
- 11.2 OTHER PLAYERS
- 11.2.1 SAMSONCONTROLS.NET.
- 11.2.2 VRG CONTROLS, LLC
- 11.2.3 FESTO SE & CO. KG (FESTO)
- 11.2.4 BADGER METER, INC.
- 11.2.5 CONTROLAIR
- 11.2.6 CRANE COMPANY
- 11.2.7 CHRISTIAN BURKERT GMBH & CO. KG
- 11.2.8 GEMU GROUP
- 11.2.9 DWYER INSTRUMENTS LTD
- 11.2.10 VRC
- 11.2.11 POWER-GENEX LTD.
- 11.2.12 VAL CONTROLS
- 11.2.13 BRAY INTERNATIONAL
- 11.2.14 NIHON KOSO CO., LTD.
- 11.2.15 SPIRAX SARCO LIMITED
12 APPENDIX
- 12.1 DISCUSSION GUIDE
- 12.2 KNOWLEDGESTORE: MARKETSANDMARKETS' SUBSCRIPTION PORTAL
- 12.3 AVAILABLE CUSTOMIZATIONS
- 12.4 RELATED REPORTS
- 12.5 AUTHOR DETAILS
List of Tables
- TABLE 1 VALVE POSITIONER MARKET: INCLUSIONS AND EXCLUSIONS
- TABLE 2 ROLE OF PLAYERS IN VALVE POSITIONER ECOSYSTEM
- TABLE 3 AVERAGE SELLING PRICES OF VALVE POSITIONERS, 2024
- TABLE 4 AVERAGE SELLING PRICE OF DIFFERENT TYPES OF VALVE POSITIONERS OFFERED BY KEY PLAYERS, 2024 (USD)
- TABLE 5 VALVE POSITIONER MARKET: PORTER'S FIVE FORCES ANALYSIS
- TABLE 6 INFLUENCE OF STAKEHOLDERS ON BUYING PROCESS FOR TOP THREE INDUSTRIES (%)
- TABLE 7 KEY BUYING CRITERIA FOR TOP THREE INDUSTRIES
- TABLE 8 MITSUBISHI CHEMICAL CORPORATION USED CLOUD-BASED SERVICES WITH SMART VALVE POSITIONERS TO IMPROVE PLANT OPERATION
- TABLE 9 SIEMENS AG USED PS2 DIGITAL VALVE POSITIONER ON FEEDWATER VALVE AND STARTUP VALVE IN POWER PLANT THAT PROVIDED ACCURATE FEEDBACK INDICATION TO CONTROL ROOM
- TABLE 10 AZBIL CORPORATION IMPLEMENTED COMMUNICATION CAPABLE SVP3000 ALPHPLUS DIGITAL POSITIONERS THAT REDUCED MAINTENANCE WORKLOAD OF EASTERN PETROCHEMICAL COMPANY
- TABLE 11 IMPORT DATA FOR HS CODE 8481-COMPLIANT PRODUCTS, BY COUNTRY, 2020-2024 (USD MILLION)
- TABLE 12 EXPORT DATA FOR HS CODE 8481-COMPLIANT PRODUCTS, BY COUNTRY, 2020-2024 (USD MILLION)
- TABLE 13 LIST OF KEY PATENTS, 2024
- TABLE 14 VALVE POSITIONER MARKET: LIST OF CONFERENCES AND EVENTS, 2025-2026
- TABLE 15 STANDARDS FOR VALVE POSITIONERS
- TABLE 16 NORTH AMERICA: LIST OF REGULATORY BODIES, GOVERNMENT AGENCIES, AND OTHER ORGANIZATIONS
- TABLE 17 EUROPE: LIST OF REGULATORY BODIES, GOVERNMENT AGENCIES, AND OTHER ORGANIZATIONS
- TABLE 18 ASIA PACIFIC: LIST OF REGULATORY BODIES, GOVERNMENT AGENCIES, AND OTHER ORGANIZATIONS
- TABLE 19 ROW: LIST OF REGULATORY BODIES, GOVERNMENT AGENCIES, AND OTHER ORGANIZATIONS
- TABLE 20 US-ADJUSTED RECIPROCAL TARIFF RATES, 2024 (USD BILLION)
- TABLE 21 KEY PRODUCT-RELATED TARIFF EFFECTIVE FOR VALVE POSITIONER MARKET, 2024
- TABLE 22 VALVE POSITIONER MARKET, BY ACTUATION, 2021-2024 (USD MILLION)
- TABLE 23 VALVE POSITIONER MARKET, BY ACTUATION, 2025-2030 (USD MILLION)
- TABLE 24 VALVE POSITIONER MARKET, BY INDUSTRY, 2021-2024 (USD MILLION)
- TABLE 25 VALVE POSITIONER MARKET, BY INDUSTRY, 2025-2030 (USD MILLION)
- TABLE 26 OIL & GAS: VALVE POSITIONER MARKET, BY REGION, 2021-2024 (USD MILLION)
- TABLE 27 OIL & GAS: VALVE POSITIONER MARKET, BY REGION, 2025-2030 (USD MILLION)
- TABLE 28 OIL & GAS: VALVE POSITIONER MARKET IN NORTH AMERICA, BY COUNTRY, 2021-2024 (USD MILLION)
- TABLE 29 OIL & GAS: VALVE POSITIONER MARKET IN NORTH AMERICA, BY COUNTRY, 2025-2030 (USD MILLION)
- TABLE 30 OIL & GAS: VALVE POSITIONER MARKET IN EUROPE, BY COUNTRY, 2021-2024 (USD MILLION)
- TABLE 31 OIL & GAS: VALVE POSITIONER MARKET IN EUROPE, BY COUNTRY, 2025-2030 (USD MILLION)
- TABLE 32 OIL & GAS: VALVE POSITIONER MARKET IN ASIA PACIFIC, BY COUNTRY, 2021-2024 (USD MILLION)
- TABLE 33 OIL & GAS: VALVE POSITIONER MARKET IN ASIA PACIFIC, BY COUNTRY, 2025-2030 (USD MILLION)
- TABLE 34 OIL & GAS: VALVE POSITIONER MARKET IN ROW, BY COUNTRY, 2021-2024 (USD MILLION)
- TABLE 35 OIL & GAS: VALVE POSITIONER MARKET IN ROW, BY COUNTRY, 2025-2030 (USD MILLION)
- TABLE 36 WATER & WASTEWATER TREATMENT: VALVE POSITIONER MARKET, BY REGION, 2021-2024 (USD MILLION)
- TABLE 37 WATER & WASTEWATER TREATMENT: VALVE POSITIONER MARKET, BY REGION, 2025-2030 (USD MILLION)
- TABLE 38 WATER & WASTEWATER TREATMENT: VALVE POSITIONER MARKET IN NORTH AMERICA, BY COUNTRY, 2021-2024 (USD MILLION)
- TABLE 39 WATER & WASTEWATER TREATMENT: VALVE POSITIONER MARKET IN NORTH AMERICA, BY COUNTRY, 2025-2030 (USD MILLION)
- TABLE 40 WATER & WASTEWATER TREATMENT: VALVE POSITIONER MARKET IN EUROPE, BY COUNTRY, 2021-2024 (USD MILLION)
- TABLE 41 WATER & WASTEWATER TREATMENT: VALVE POSITIONER MARKET IN EUROPE, BY COUNTRY, 2025-2030 (USD MILLION)
- TABLE 42 WATER & WASTEWATER TREATMENT: VALVE POSITIONER MARKET IN ASIA PACIFIC, BY COUNTRY, 2021-2024 (USD MILLION)
- TABLE 43 WATER & WASTEWATER TREATMENT: VALVE POSITIONER MARKET IN ASIA PACIFIC, BY COUNTRY, 2025-2030 (USD MILLION)
- TABLE 44 WATER & WASTEWATER TREATMENT: VALVE POSITIONER MARKET IN ROW, BY COUNTRY, 2021-2024 (USD MILLION)
- TABLE 45 WATER & WASTEWATER TREATMENT: VALVE POSITIONER MARKET IN ROW, BY COUNTRY, 2025-2030 (USD MILLION)
- TABLE 46 ENERGY & POWER: VALVE POSITIONER MARKET, BY REGION, 2021-2024 (USD MILLION)
- TABLE 47 ENERGY & POWER: VALVE POSITIONER MARKET, BY REGION, 2025-2030 (USD MILLION)
- TABLE 48 ENERGY & POWER: VALVE POSITIONER MARKET IN NORTH AMERICA, BY COUNTRY, 2021-2024 (USD MILLION)
- TABLE 49 ENERGY & POWER: VALVE POSITIONER MARKET IN NORTH AMERICA, BY COUNTRY, 2025-2030 (USD MILLION)
- TABLE 50 ENERGY & POWER: VALVE POSITIONER MARKET IN EUROPE, BY COUNTRY, 2021-2024 (USD MILLION)
- TABLE 51 ENERGY & POWER: VALVE POSITIONER MARKET IN EUROPE, BY COUNTRY, 2025-2030 (USD MILLION)
- TABLE 52 ENERGY & POWER: VALVE POSITIONER MARKET IN ASIA PACIFIC, BY COUNTRY, 2021-2024 (USD MILLION)
- TABLE 53 ENERGY & POWER: VALVE POSITIONER MARKET IN ASIA PACIFIC, BY COUNTRY, 2025-2030 (USD MILLION)
- TABLE 54 ENERGY & POWER: VALVE POSITIONER MARKET IN ROW, BY COUNTRY, 2021-2024 (USD MILLION)
- TABLE 55 ENERGY & POWER: VALVE POSITIONER MARKET IN ROW, BY COUNTRY, 2025-2030 (USD MILLION)
- TABLE 56 CHEMICALS: VALVE POSITIONER MARKET, BY REGION, 2021-2024 (USD MILLION)
- TABLE 57 CHEMICALS: VALVE POSITIONER MARKET, BY REGION, 2025-2030 (USD MILLION)
- TABLE 58 CHEMICALS: VALVE POSITIONER MARKET IN NORTH AMERICA, BY COUNTRY, 2021-2024 (USD MILLION)
- TABLE 59 CHEMICALS: VALVE POSITIONER MARKET IN NORTH AMERICA, BY COUNTRY, 2025-2030 (USD MILLION)
- TABLE 60 CHEMICALS: VALVE POSITIONER MARKET IN EUROPE, BY COUNTRY, 2021-2024 (USD MILLION)
- TABLE 61 CHEMICALS: VALVE POSITIONER MARKET IN EUROPE, BY COUNTRY, 2025-2030 (USD MILLION)
- TABLE 62 CHEMICALS: VALVE POSITIONER MARKET IN ASIA PACIFIC, BY COUNTRY, 2021-2024 (USD MILLION)
- TABLE 63 CHEMICALS: VALVE POSITIONER MARKET IN ASIA PACIFIC, BY COUNTRY, 2025-2030 (USD MILLION)
- TABLE 64 CHEMICALS: VALVE POSITIONER MARKET IN ROW, BY COUNTRY, 2021-2024 (USD MILLION)
- TABLE 65 CHEMICALS: VALVE POSITIONER MARKET IN ROW, BY COUNTRY, 2025-2030 (USD MILLION)
- TABLE 66 PAPER & PULP: VALVE POSITIONER MARKET, BY REGION, 2021-2024 (USD MILLION)
- TABLE 67 PAPER & PULP: VALVE POSITIONER MARKET, BY REGION, 2025-2030 (USD MILLION)
- TABLE 68 PAPER & PULP: VALVE POSITIONER MARKET IN NORTH AMERICA, BY COUNTRY, 2021-2024 (USD MILLION)
- TABLE 69 PAPER & PULP: VALVE POSITIONER MARKET IN NORTH AMERICA, BY COUNTRY, 2025-2030 (USD MILLION)
- TABLE 70 PAPER & PULP: VALVE POSITIONER MARKET IN EUROPE, BY COUNTRY, 2021-2024 (USD MILLION)
- TABLE 71 PAPER & PULP: VALVE POSITIONER MARKET IN EUROPE, BY COUNTRY, 2025-2030 (USD MILLION)
- TABLE 72 PAPER & PULP: VALVE POSITIONER MARKET IN ASIA PACIFIC, BY COUNTRY, 2021-2024 (USD MILLION)
- TABLE 73 PAPER & PULP: VALVE POSITIONER MARKET IN ASIA PACIFIC, BY COUNTRY, 2025-2030 (USD MILLION)
- TABLE 74 PAPER & PULP: VALVE POSITIONER MARKET IN ROW, BY COUNTRY, 2021-2024 (USD MILLION)
- TABLE 75 PAPER & PULP: VALVE POSITIONER MARKET IN ROW, BY COUNTRY, 2025-2030 (USD MILLION)
- TABLE 76 PHARMACEUTICALS: VALVE POSITIONER MARKET, BY REGION, 2021-2024 (USD MILLION)
- TABLE 77 PHARMACEUTICALS: VALVE POSITIONER MARKET, BY REGION, 2025-2030 (USD MILLION)
- TABLE 78 PHARMACEUTICALS: VALVE POSITIONER MARKET IN NORTH AMERICA, BY COUNTRY, 2021-2024 (USD MILLION)
- TABLE 79 PHARMACEUTICALS: VALVE POSITIONER MARKET IN NORTH AMERICA, BY COUNTRY, 2025-2030 (USD MILLION)
- TABLE 80 PHARMACEUTICALS: VALVE POSITIONER MARKET IN EUROPE, BY COUNTRY, 2021-2024 (USD MILLION)
- TABLE 81 PHARMACEUTICALS: VALVE POSITIONER MARKET IN EUROPE, BY COUNTRY, 2025-2030 (USD MILLION)
- TABLE 82 PHARMACEUTICALS: VALVE POSITIONER MARKET IN ASIA PACIFIC, BY COUNTRY, 2021-2024 (USD MILLION)
- TABLE 83 PHARMACEUTICALS: VALVE POSITIONER MARKET IN ASIA PACIFIC, BY COUNTRY, 2025-2030 (USD MILLION)
- TABLE 84 PHARMACEUTICALS: VALVE POSITIONER MARKET IN ROW, BY COUNTRY, 2021-2024 (USD MILLION)
- TABLE 85 PHARMACEUTICALS: VALVE POSITIONER MARKET IN ROW, BY COUNTRY, 2025-2030 (USD MILLION)
- TABLE 86 METALS & MINING: VALVE POSITIONER MARKET, BY REGION, 2021-2024 (USD MILLION)
- TABLE 87 METALS & MINING: VALVE POSITIONER MARKET, BY REGION, 2025-2030 (USD MILLION)
- TABLE 88 METALS & MINING: VALVE POSITIONER MARKET IN NORTH AMERICA, BY COUNTRY, 2021-2024 (USD MILLION)
- TABLE 89 METALS & MINING: VALVE POSITIONER MARKET IN NORTH AMERICA, BY COUNTRY, 2025-2030 (USD MILLION)
- TABLE 90 METALS & MINING: VALVE POSITIONER MARKET IN EUROPE, BY COUNTRY, 2021-2024 (USD MILLION)
- TABLE 91 METALS & MINING: VALVE POSITIONER MARKET IN EUROPE, 2025-2030 (USD MILLION)
- TABLE 92 METALS & MINING: VALVE POSITIONER MARKET IN ASIA PACIFIC, BY COUNTRY, 2021-2024 (USD MILLION)
- TABLE 93 METALS & MINING: VALVE POSITIONER MARKET IN ASIA PACIFIC, BY COUNTRY, 2025-2030 (USD MILLION)
- TABLE 94 METALS & MINING: VALVE POSITIONER MARKET IN ROW, BY COUNTRY, 2021-2024 (USD MILLION)
- TABLE 95 METALS & MINING: VALVE POSITIONER MARKET IN ROW, BY COUNTRY, 2025-2030 (USD MILLION)
- TABLE 96 FOOD & BEVERAGES: VALVE POSITIONER MARKET, BY REGION, 2021-2024 (USD MILLION)
- TABLE 97 FOOD & BEVERAGES: VALVE POSITIONER MARKET, BY REGION, 2025-2030 (USD MILLION)
- TABLE 98 FOOD & BEVERAGES: VALVE POSITIONER MARKET IN NORTH AMERICA, BY COUNTRY, 2021-2024 (USD MILLION)
- TABLE 99 FOOD & BEVERAGES: VALVE POSITIONER MARKET IN NORTH AMERICA, BY COUNTRY, 2025-2030 (USD MILLION)
- TABLE 100 FOOD & BEVERAGES: VALVE POSITIONER MARKET IN EUROPE, BY COUNTRY, 2021-2024 (USD MILLION)
- TABLE 101 FOOD & BEVERAGES: VALVE POSITIONER MARKET IN EUROPE, BY COUNTRY, 2025-2030 (USD MILLION)
- TABLE 102 FOOD & BEVERAGES: VALVE POSITIONER MARKET IN ASIA PACIFIC, BY COUNTRY, 2021-2024 (USD MILLION)
- TABLE 103 FOOD & BEVERAGES: VALVE POSITIONER MARKET IN ASIA PACIFIC, BY COUNTRY, 2025-2030 (USD MILLION)
- TABLE 104 FOOD & BEVERAGES: VALVE POSITIONER MARKET IN ROW, BY COUNTRY, 2021-2024 (USD MILLION)
- TABLE 105 FOOD & BEVERAGES: VALVE POSITIONER MARKET IN ROW, BY COUNTRY, 2025-2030 (USD MILLION)
- TABLE 106 OTHER INDUSTRIES: VALVE POSITIONER MARKET, BY REGION, 2021-2024 (USD MILLION)
- TABLE 107 OTHER INDUSTRIES: VALVE POSITIONER MARKET, BY REGION, 2025-2030 (USD MILLION)
- TABLE 108 OTHER INDUSTRIES: VALVE POSITIONER MARKET IN NORTH AMERICA, BY COUNTRY, 2021-2024 (USD MILLION)
- TABLE 109 OTHER INDUSTRIES: VALVE POSITIONER MARKET IN NORTH AMERICA, BY COUNTRY, 2025-2030 (USD MILLION)
- TABLE 110 OTHER INDUSTRIES: VALVE POSITIONER MARKET IN EUROPE, BY COUNTRY, 2021-2024 (USD MILLION)
- TABLE 111 OTHER INDUSTRIES: VALVE POSITIONER MARKET IN EUROPE, BY COUNTRY, 2025-2030 (USD MILLION)
- TABLE 112 OTHER INDUSTRIES: VALVE POSITIONER MARKET IN ASIA PACIFIC, BY COUNTRY, 2021-2024 (USD MILLION)
- TABLE 113 OTHER INDUSTRIES: VALVE POSITIONER MARKET IN ASIA PACIFIC, BY COUNTRY, 2025-2030 (USD MILLION)
- TABLE 114 OTHER INDUSTRIES: VALVE POSITIONER MARKET IN ROW, BY COUNTRY, 2021-2024 (USD MILLION)
- TABLE 115 OTHER INDUSTRIES: VALVE POSITIONER MARKET IN ROW, BY COUNTRY, 2025-2030 (USD MILLION)
- TABLE 116 VALVE POSITIONER MARKET, BY TYPE, 2021-2024 (USD MILLION)
- TABLE 117 VALVE POSITIONER MARKET, BY TYPE, 2025-2030 (USD MILLION)
- TABLE 118 VALVE POSITIONER MARKET, BY TYPE, 2021-2024 (THOUSAND UNITS)
- TABLE 119 VALVE POSITIONER MARKET, BY TYPE, 2025-2030 (THOUSAND UNITS)
- TABLE 120 VALVE POSITIONER MARKET, BY REGION, 2021-2024 (USD MILLION)
- TABLE 121 VALVE POSITIONER MARKET, BY REGION, 2025-2030 (USD MILLION)
- TABLE 122 NORTH AMERICA: VALVE POSITIONER MARKET, BY COUNTRY, 2021-2024 (USD MILLION)
- TABLE 123 NORTH AMERICA: VALVE POSITIONER MARKET, BY COUNTRY, 2025-2030 (USD MILLION)
- TABLE 124 NORTH AMERICA: VALVE POSITIONER MARKET, BY INDUSTRY, 2021-2024 (USD MILLION)
- TABLE 125 NORTH AMERICA: VALVE POSITIONER MARKET, BY INDUSTRY, 2025-2030 (USD MILLION)
- TABLE 126 EUROPE: VALVE POSITIONER MARKET, BY COUNTRY, 2021-2024 (USD MILLION)
- TABLE 127 EUROPE: VALVE POSITIONER MARKET, BY COUNTRY, 2025-2030 (USD MILLION)
- TABLE 128 EUROPE: VALVE POSITIONER MARKET, BY INDUSTRY, 2021-2024 (USD MILLION)
- TABLE 129 EUROPE: VALVE POSITIONER MARKET, BY INDUSTRY, 2025-2030 (USD MILLION)
- TABLE 130 ASIA PACIFIC: VALVE POSITIONER MARKET, BY COUNTRY, 2021-2024 (USD MILLION)
- TABLE 131 ASIA PACIFIC: VALVE POSITIONER MARKET, BY COUNTRY, 2025-2030 (USD MILLION)
- TABLE 132 ASIA PACIFIC: VALVE POSITIONER MARKET, BY INDUSTRY, 2021-2024 (USD MILLION)
- TABLE 133 ASIA PACIFIC: VALVE POSITIONER MARKET, BY INDUSTRY, 2025-2030 (USD MILLION)
- TABLE 134 ROW: VALVE POSITIONER MARKET, BY REGION, 2021-2024 (USD MILLION)
- TABLE 135 ROW: VALVE POSITIONER MARKET, BY REGION, 2025-2030 (USD MILLION)
- TABLE 136 ROW: VALVE POSITIONER MARKET, BY INDUSTRY, 2021-2024 (USD MILLION)
- TABLE 137 ROW: VALVE POSITIONER MARKET, BY INDUSTRY, 2025-2030 (USD MILLION)
- TABLE 138 MIDDLE EAST & AFRICA: VALVE POSITIONER MARKET, BY GEOGRAPHY, 2021-2024 (USD MILLION)
- TABLE 139 MIDDLE EAST & AFRICA: VALVE POSITIONER MARKET, BY GEOGRAPHY, 2025-2030 (USD MILLION)
- TABLE 140 SOUTH AMERICA: VALVE POSITIONER MARKET, BY COUNTRY, 2021-2024 (USD MILLION)
- TABLE 141 SOUTH AMERICA: VALVE POSITIONER MARKET, BY COUNTRY, 2025-2030 (USD MILLION)
- TABLE 142 OVERVIEW OF STRATEGIES ADOPTED BY KEY PLAYERS, JANUARY 2023-JULY 2025
- TABLE 143 VALVE POSITIONER MARKET SHARE ANALYSIS, 2024
- TABLE 144 VALVE POSITIONER MARKET: REGION FOOTPRINT
- TABLE 145 VALVE POSITIONER MARKET: TYPE FOOTPRINT
- TABLE 146 VALVE POSITIONER MARKET: INDUSTRY FOOTPRINT
- TABLE 147 VALVE POSITIONER MARKET: LIST OF KEY STARTUPS/SMES, 2024
- TABLE 148 VALVE POSITIONER MARKET: COMPETITIVE BENCHMARKING OF KEY STARTUPS/SMES, 2024
- TABLE 149 VALVE POSITIONER MARKET: DEALS, JANUARY 2023-JULY 2025
- TABLE 150 VALVE POSITIONER MARKET: EXPANSIONS, JANUARY 2023-JULY 2025
- TABLE 151 VALVE POSITIONER MARKET: DEVELOPMENTS, JANUARY 2023-JULY 2025
- TABLE 152 EMERSON ELECTRIC CO.: COMPANY OVERVIEW
- TABLE 153 EMERSON ELECTRIC CO.: PRODUCTS/SERVICES/SOLUTIONS OFFERED
- TABLE 154 EMERSON ELECTRIC CO.: DEALS
- TABLE 155 ABB: COMPANY OVERVIEW
- TABLE 156 ABB: PRODUCTS/SERVICES/SOLUTIONS OFFERED
- TABLE 157 FLOWSERVE CORPORATION: COMPANY OVERVIEW
- TABLE 158 FLOWSERVE CORPORATION: PRODUCTS/SERVICES/SOLUTIONS OFFERED
- TABLE 159 FLOWSERVE CORPORATION: DEVELOPMENTS
- TABLE 160 SIEMENS: COMPANY OVERVIEW
- TABLE 161 SIEMENS: PRODUCTS/SERVICES/SOLUTIONS OFFERED
- TABLE 162 SCHNEIDER ELECTRIC: COMPANY OVERVIEW
- TABLE 163 SCHNEIDER ELECTRIC: PRODUCTS/SERVICES/SOLUTIONS OFFERED
- TABLE 164 SMC CORPORATION: COMPANY OVERVIEW
- TABLE 165 SMC CORPORATION: PRODUCTS/SERVICES/SOLUTIONS OFFERED
- TABLE 166 AZBIL CORPORATION: COMPANY OVERVIEW
- TABLE 167 AZBIL CORPORATION: PRODUCTS/SERVICES/SOLUTIONS OFFERED
- TABLE 168 AZBIL CORPORATION: EXPANSIONS
- TABLE 169 BAKER HUGHES: COMPANY OVERVIEW
- TABLE 170 BAKER HUGHES: PRODUCTS/SERVICES/SOLUTIONS OFFERED
- TABLE 171 ROTORK PLC: COMPANY OVERVIEW
- TABLE 172 ROTORK PLC: PRODUCTS/SERVICES/SOLUTIONS OFFERED
- TABLE 173 ROTORK PLC: DEALS
- TABLE 174 VALMET: COMPANY OVERVIEW
- TABLE 175 VALMET: PRODUCTS/SERVICES/SOLUTIONS OFFERED
- TABLE 176 SAMSONCONTROLS.NET.: COMPANY OVERVIEW
- TABLE 177 VRG CONTROLS LLC: COMPANY OVERVIEW
- TABLE 178 FESTO SE & CO. KG (FESTO): COMPANY OVERVIEW
- TABLE 179 BADGER METER, INC.: COMPANY OVERVIEW
- TABLE 180 CONTROLAIR: COMPANY OVERVIEW
- TABLE 181 CRANE COMPANY: COMPANY OVERVIEW
- TABLE 182 CHRISTIAN BURKERT GMBH & CO. KG: COMPANY OVERVIEW
- TABLE 183 GEMU GROUP: COMPANY OVERVIEW
- TABLE 184 DWYER INSTRUMENTS LTD: COMPANY OVERVIEW
- TABLE 185 VRC: COMPANY OVERVIEW
- TABLE 186 POWER-GENEX LTD.: COMPANY OVERVIEW
- TABLE 187 VAL CONTROLS: COMPANY OVERVIEW
- TABLE 188 BRAY INTERNATIONAL: COMPANY OVERVIEW
- TABLE 189 NIHON KOSO CO., LTD.: COMPANY OVERVIEW
- TABLE 190 SPIRAX SARCO LIMITED: COMPANY OVERVIEW
List of Figures
- FIGURE 1 VALVE POSITIONER MARKET AND REGIONAL SEGMENTATION
- FIGURE 2 VALVE POSITIONER MARKET: RESEARCH DESIGN
- FIGURE 3 VALVE POSITIONER MARKET: RESEARCH APPROACH
- FIGURE 4 VALVE POSITIONER MARKET: BOTTOM-UP APPROACH
- FIGURE 5 VALVE POSITIONER MARKET: TOP-DOWN APPROACH
- FIGURE 6 VALVE POSITIONER MARKET SIZE ESTIMATION METHODOLOGY
- FIGURE 7 DATA TRIANGULATION
- FIGURE 8 DIGITAL VALVE POSITIONER TO HOLD MAXIMUM MARKET SHARE IN 2025
- FIGURE 9 SINGLE-ACTING POSITIONERS TO ACCOUNT FOR LARGER MARKET SHARE IN 2030
- FIGURE 10 WATER & WASTEWATER TREATMENT INDUSTRY TO CAPTURE LARGEST MARKET SHARE IN 2030
- FIGURE 11 ASIA PACIFIC ACCOUNTED FOR LARGEST MARKET SHARE IN 2024
- FIGURE 12 RISING ADOPTION OF SMART VALVE POSITIONERS IN VARIOUS PLANT OPERATIONS IN PROCESS INDUSTRIES TO BOOST MARKET GROWTH
- FIGURE 13 DIGITAL POSITIONERS TO HOLD LARGEST MARKET SIZE IN 2030
- FIGURE 14 SINGLE-ACTING POSITIONERS TO SECURE LARGER MARKET SHARE IN 2030
- FIGURE 15 OIL & GAS TO DOMINATE MARKET IN 2030
- FIGURE 16 INDIA TO EXHIBIT HIGHEST CAGR DURING FORECAST PERIOD
- FIGURE 17 VALVE POSITIONER MARKET: DRIVERS, RESTRAINTS, OPPORTUNITIES, AND CHALLENGES
- FIGURE 18 VALVE POSITIONER MARKET: IMPACT ANALYSIS OF DRIVERS
- FIGURE 19 VALVE POSITIONER MARKET: IMPACT ANALYSIS OF RESTRAINTS
- FIGURE 20 VALVE POSITIONER MARKET: IMPACT ANALYSIS OF OPPORTUNITIES
- FIGURE 21 VALVE POSITIONER MARKET: IMPACT ANALYSIS OF CHALLENGES
- FIGURE 22 VALUE CHAIN ANALYSIS: MAJOR VALUE ADDED BY ORIGINAL EQUIPMENT MANUFACTURERS
- FIGURE 23 VALVE POSITIONER ECOSYSTEM ANALYSIS
- FIGURE 24 AVERAGE SELLING PRICE OF DIFFERENT TYPES OF VALVE POSITIONERS, BY KEY PLAYER, 2024
- FIGURE 25 TRENDS/DISRUPTIONS IMPACTING CUSTOMER BUSINESS
- FIGURE 26 VALVE POSITIONER MARKET: PORTER'S FIVE FORCES ANALYSIS
- FIGURE 27 INFLUENCE OF STAKEHOLDERS ON BUYING PROCESS FOR TOP THREE INDUSTRIES
- FIGURE 28 KEY BUYING CRITERIA FOR TOP THREE INDUSTRIES
- FIGURE 29 IMPORT DATA FOR HS CODE 8481-COMPLIANT PRODUCTS, BY COUNTRY, 2020-2024
- FIGURE 30 EXPORT DATA FOR HS CODE 8481 -COMPLIANT PRODUCTS, BY COUNTRY, 2020-2024
- FIGURE 31 PATENTS APPLIED AND GRANTED, 2015-2024
- FIGURE 32 KEY AI USE CASES IN VALVE POSITIONER MARKET
- FIGURE 33 SINGLE-ACTING SEGMENT TO LEAD MARKET DURING FORECAST PERIOD
- FIGURE 34 SCHEMATIC OF SINGLE-ACTING POSITIONERS
- FIGURE 35 SCHEMATIC OF DOUBLE-ACTING POSITIONERS
- FIGURE 36 VALVE POSITIONER MARKET, BY INDUSTRY
- FIGURE 37 WATER & WASTEWATER TREATMENT INDUSTRY TO GROW AT HIGHEST CAGR DURING FORECAST PERIOD
- FIGURE 38 DIGITAL POSITIONERS TO GROW AT FASTEST GROWTH RATE DURING FORECAST PERIOD
- FIGURE 39 WORKING PRINCIPLE OF PNEUMATIC POSITIONERS
- FIGURE 40 SALIENT FEATURES OF ELECTRO-PNEUMATIC POSITIONER
- FIGURE 41 ADVANTAGES OF DIGITAL POSITIONERS
- FIGURE 42 VALVE POSITIONER MARKET, BY REGION
- FIGURE 43 ASIA PACIFIC TO GROW AT HIGHEST CAGR DURING FORECAST PERIOD
- FIGURE 44 INDIA TO OFFER MOST LUCRATIVE OPPORTUNITIES DURING FORECAST PERIOD
- FIGURE 45 NORTH AMERICA: VALVE POSITIONER MARKET SNAPSHOT
- FIGURE 46 EUROPE: VALVE POSITIONER MARKET SNAPSHOT
- FIGURE 47 ASIA PACIFIC: VALVE POSITIONER MARKET SNAPSHOT
- FIGURE 48 VALVE POSITIONER MARKET: REVENUE ANALYSIS OF FIVE KEY PLAYERS, 2020-2024
- FIGURE 49 MARKET SHARE ANALYSIS OF COMPANIES OFFERING VALVE PPOSITIONERS, 2024
- FIGURE 50 VALVE POSITIONER MARKET: COMPANY EVALUATION MATRIX (KEY PLAYERS), 2024
- FIGURE 51 VALVE POSITIONER MARKET: COMPANY FOOTPRINT
- FIGURE 52 VALVE POSITIONER MARKET: COMPANY EVALUATION MATRIX (STARTUPS/SME), 2024
- FIGURE 53 EMERSON ELECTRIC CO.: COMPANY SNAPSHOT
- FIGURE 54 ABB: COMPANY SNAPSHOT
- FIGURE 55 FLOWSERVE CORPORATION: COMPANY SNAPSHOT
- FIGURE 56 SIEMENS: COMPANY SNAPSHOT
- FIGURE 57 SCHNEIDER ELECTRIC: COMPANY SNAPSHOT
- FIGURE 58 SMC CORPORATION: COMPANY SNAPSHOT
- FIGURE 59 AZBIL CORPORATION: COMPANY SNAPSHOT
- FIGURE 60 BAKER HUGHES: COMPANY SNAPSHOT
- FIGURE 61 ROTORK PLC: COMPANY SNAPSHOT
- FIGURE 62 VALMET: COMPANY SNAPSHOT
 轨道交通能量回馈设备市场:依设备类型、安装类型、应用程式、最终用户和销售管道,全球预测,2026-2032年
 2026年全球阀门定位器市场报告
 阀门定位器市场规模、份额和趋势分析报告:按产品类型、应用、地区和细分市场预测(2025-2033 年)气动阀门位置回馈装置市场(按类型、致动器类型、驱动类型、调整类型、安装类型、最终用途和分销管道)—全球预测,2025-2030 年阀门定位器市场(按产品、技术、阀门类型、应用和产业)—2025-2030 年全球预测
 2023-2030 年全球阀门定位器市场规模研究与预测(按类型、驱动方式、产业和区域分析)