


 |
市场调查报告书
商品编码
1796196
全球娱乐内容和商品市场(至 2030 年):音乐设备和纪念品、唱片、亲笔签名商品、生活方式和家居用品、体育用品、收藏品、动画内容製作、电影、电视/OTT 和服装Entertainment Content and Goods Market by Music Equipment and Memorabilia, Vinyl Record, Signed Merchandise, Lifestyle and Home Goods, Sporting Equipment, Collectible, Animated Content Creation, Film, TV/OTT and Apparel - Global Forecast to 2030 |
||||||
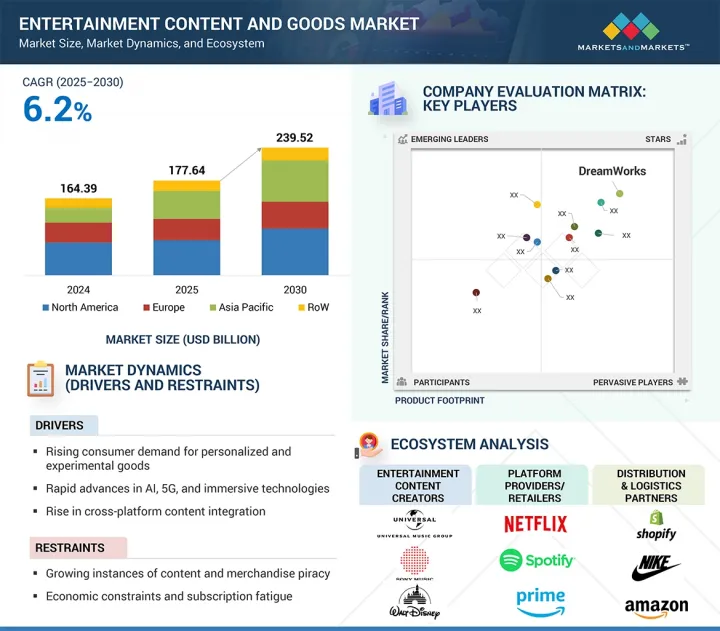
全球娱乐内容和商品市场预计将从 2025 年的 1,776.4 亿美元成长到 2030 年的 2,395.2 亿美元,预测期内的复合年增长率为 6.2%。
| 调查范围 | |
|---|---|
| 调查年份 | 2021-2030 |
| 基准年 | 2024 |
| 预测期 | 2025-2030 |
| 单元 | 金额(美元) |
| 按细分市场 | 音乐艺术家商品类型、授权商品类型、动画内容製作,依地区 |
| 目标区域 | 北美、欧洲、亚太地区及其他地区 |
推动娱乐内容和商品市场发展的关键因素包括全球数位内容消费的不断增长、粉丝文化的兴起以及对个人化和独家产品的需求不断增长,这些因素迫使娱乐公司实现产品和服务多样化,并透过多种管道将其智慧财产权收益。
AR/VR、NFT 和 AI 生成内容等技术创新正在提升受众参与度,并带来身临其境型品牌体验。此外,D2C 平台和社群商务的扩张正在加速商品和独家内容的取得。然而,智慧财产权侵权、消费者偏好波动以及高昂的内容製作成本等挑战可能会限制市场扩张。此外,新兴市场中数位基础设施的不均衡以及粉丝商业化战略的区域差异也可能阻碍某些市场的成长。
“按授权商品类型划分,生活方式、粉丝装备和纪念品领域预计在预测期内实现最高的复合年增长率。”
预计该细分市场在预测期内的复合年增长率最高,这得益于消费者对个人化、团队导向和情感共鸣商品需求的不断增长。该细分市场包括服装、配件、家居装饰以及受音乐、职业运动队、运动员、联赛和体育赛事启发的收藏品。随着观众越来越多地寻求透过有形产品表达自我、培养粉丝,授权生活用品和纪念品正在成为娱乐公司重要的收益来源。
数位转型进一步加速了这一成长,运动品牌和联盟利用直销管道、独家发售和社交商务策略来提升粉丝参与度和商品销售。扩增实境 (AR) 功能、二维码认证和 NFT 纪念品正在增强产品的互动性和收藏价值。 Fanatics Inc.(美国)、Nike Inc.(美国)和 Adidas AG(德国)等公司正在透过独家零售合作和运动员主导的系列产品,拓展其面向全球市场的授权商品组合。
融合数位内容和实体商品的混合粉丝体验日益流行,也促进了该行业的扩张。随着品牌生态系统的沉浸感增强以及粉丝文化的不断发展,生活风格产品和纪念品正日益成为全球娱乐公司内容商业化战略中不可或缺的一部分。
本报告调查了全球娱乐内容和商品市场,并提供了市场概况、影响市场成长的各种因素分析、技术和专利趋势、法律制度、案例研究、市场规模趋势和预测、各个细分市场、地区/主要国家的详细分析、竞争格局和主要企业的概况。
目录
第一章 引言
第二章调查方法
第三章执行摘要
第四章重要考察
第五章市场概述
- 市场动态
- 驱动程式
- 抑制因素
- 机会
- 任务
- 价值链分析
- 生态系分析
- 影响客户业务的趋势/中断
- 技术分析
- 定价分析
- 案例研究分析
- 2025-2026年重要会议和活动
第六章 娱乐内容与商品市场(依音乐艺术家商品类型)
- 衣服
- 印花T恤
- 连帽衫和运动衫
- 帽子、便帽、无檐便帽
- 配件
- 包包
- 鞋
- 手錶
- 其他的
- 生活方式和家居用品
- 马克杯和饮具
- 海报艺术作品
- 静止的
- 音乐设备和纪念品
- 黑胶唱片
- 签名商品
- 装置
7. 娱乐内容与授权商品市场
- 授权运动服饰
- 官方球队球衣和 T 恤
- 品牌运动帽和头饰
- 运动队伍连帽衫和外套
- 运动器材及风扇配件
- 球队品牌包
- 运动版鞋类
- 智慧型手錶与健身腕带
- 其他品牌配件
- 体育用品
- 球
- 球拍
- 手套和垫片
- 其他的
- 生活方式、球迷装备和纪念品
- 瓶子和饮具
- 围巾和腕带
- 收藏品
- 海报、日历、相册
- 其他的
第八章 动画内容製作的娱乐内容和商品市场
- 按内容类型
- 电影
- 电视/OTT
- 按动画风格
- 2D动画
- 3D动画
- 定格动画
- 混合媒体
9. 娱乐内容及週边产品市场(按地区)
- 北美洲
- 宏观经济展望
- 美国
- 加拿大
- 墨西哥
- 欧洲
- 宏观经济展望
- 德国
- 英国
- 法国
- 义大利
- 其他的
- 亚太地区
- 宏观经济展望
- 中国
- 日本
- 韩国
- 印度
- 其他的
- 其他地区
- 宏观经济展望
- 中东和非洲
- 南美洲
第十章 竞争格局
- 概述
- 主要参与企业的策略/优势
- 竞争场景
第十一章:公司简介
- 主要企业
- MERCHBAR, INC.
- FANATICS INC.
- NIKE, INC.
- ADIDAS AG
- NEW ERA CAP
- PUMA SE
- THE WALT DISNEY COMPANY
- DREAMWORKS ANIMATION
- ILLUMINATION
- PARAMOUNT
- 其他公司
- NETFLIX, INC.
- UNIVERSAL MUSIC GROUP NV
- SONY MUSIC ENTERTAINMENT
- WARNER MUSIC GROUP INC.
- AMAZON.COM, INC.
第十二章 附录
The entertainment content and goods market is anticipated to be valued at USD 177.64 billion in 2025 and USD 239.52 billion by 2030, growing at a CAGR of 6.2% during the forecast period.
| Scope of the Report | |
|---|---|
| Years Considered for the Study | 2021-2030 |
| Base Year | 2024 |
| Forecast Period | 2025-2030 |
| Units Considered | Value (USD Billion) |
| Segments | By Music Artist Goods Type, Licensed Goods Type, Animated Content Creation, and Region |
| Regions covered | North America, Europe, APAC, RoW |
Key factors driving the entertainment content and goods market include the increasing global consumption of digital content, rising fandom culture, and demand for personalized, limited-edition merchandise. These factors compel entertainment companies to diversify their offerings and monetize intellectual property across multiple channels.
Technological advancements, such as AR/VR, NFTs, and AI-driven content creation, enhance audience engagement and enable immersive brand experiences. Furthermore, the expansion of direct-to-consumer platforms and social commerce accelerates access to merchandise and exclusive content. However, challenges such as IP infringement, fluctuating consumer preferences, and high content production costs can constrain market scalability. Additionally, inconsistent digital infrastructure and regional disparities in fan monetization strategies may hinder growth in certain emerging markets.
"By licensed goods type, the lifestyle, fan gear, and memorabilia segment is expected to register the highest CAGR from 2025 to 2030."
The lifestyle, fan gear, and memorabilia segment is projected to register the highest CAGR in the entertainment content and goods market during the forecast period, driven by rising consumer demand for personalized, team-driven, and emotionally resonant merchandise. This segment includes apparel, accessories, home decor, and collectible items inspired by music, professional sports teams, athletes, leagues, and sporting events. As audiences increasingly seek to express identity and fandom through tangible goods, licensed lifestyle and memorabilia products are emerging as key revenue drivers for entertainment companies.
Digital transformation further amplifies this growth, with sports brands and leagues leveraging direct-to-consumer channels, limited-edition drops, and social commerce strategies to boost fan engagement and merchandise sales. Augmented reality (AR) features, QR-enabled authenticity checks, and NFT-linked memorabilia enhance product interactivity and collectability. Companies such as Fanatics Inc. (US), Nike, Inc. (US), and Adidas AG (Germany) are expanding their licensed merchandise portfolios through exclusive retail collaborations and athlete-driven collections tailored for global audiences.
The growing popularity of hybrid fan experiences, combining digital content with physical goods, also contributes to segment expansion. As brand ecosystems become more immersive and fandom culture evolves, lifestyle and memorabilia goods are positioned to become increasingly integral to the content monetization strategies of leading entertainment players worldwide.
By animated content creation, the TV/OTT segment is projected to account for the largest market share from 2025 to 2030."
The TV/OTT segment is expected to account for the largest share of the animated content creation market from 2025 to 2030, driven by the rising demand for high-quality, serialized animated programming across streaming platforms and traditional broadcast channels. With the global surge in OTT consumption, fueled by increased internet penetration and mobile device usage, animation has become a preferred format for engaging audiences across age groups, particularly children, young adults, and fandom-based communities.
TV and OTT platforms heavily invest in original animated content to differentiate offerings, retain subscribers, and capture niche viewer segments. Streaming giants such as Netflix, Disney+, Amazon Prime Video, and regional platforms, including Voot and Tencent Video, commission exclusive animated series, reboots of legacy IPs, and culturally localized content to meet rising viewer expectations. The flexibility of animation to support diverse storytelling formats, from educational series to adult comedy and fantasy, further expands its applicability and appeal.
In addition, the integration of advanced production technologies, such as 2D/3D hybrid animation, motion capture, and AI-based rendering, enhances visual quality and production efficiency. As content consumption habits evolve and demand for on-demand, serialized storytelling grows, the TV/OTT segment is expected to maintain its leadership in animated content creation, supported by robust platform investments and global audience engagement.
"North America is projected to account for the largest market share from 2025 to 2030."
The North America region is projected to hold the largest share of the global entertainment content and goods market from 2025 to 2030, owing to a mature entertainment ecosystem, widespread digital infrastructure, and high consumer spending on content and branded merchandise. The US remains a global hub for entertainment production and IP commercialization, with major players such as The Walt Disney Company, Warner Bros. Entertainment, Universal Music Group, and Paramount headquartered in the region. These companies leverage extensive distribution networks and fan engagement platforms to monetize content across film, television, music, gaming, and consumer products.
The region's dominance is further supported by the widespread adoption of streaming services, direct-to-consumer retail channels, and fan-based commerce. The growing trend of limited-edition merchandise drops, exclusive artist collaborations, and immersive fan experiences, including virtual concerts and AR/VR-driven activations, is enhancing consumer engagement and driving high-margin sales. Moreover, the integration of emerging technologies such as NFTs and AI-generated content accelerates innovation across content creation and merchandise offerings.
Strong IP protection laws, advanced content monetization models, and a well-established retail infrastructure provide a conducive environment for sustained growth. With a culture that values entertainment as a lifestyle, North America is expected to maintain its leading position in the global entertainment content and goods market.
The breakdown of the profile of primary participants in the entertainment content and goods market is as follows:
- By Company Type: Tier 1 - 40%, Tier 2 - 35%, Tier 3 - 25%
- By Designation Type: C Level Executives - 40%, Director Level - 30%, Others - 30%
- By Region Type: Asia Pacific - 35%, North America - 25%, Europe - 25%, RoW - 15%
Notes: Other designations include sales, marketing, and product managers.
The three tiers of the companies are based on their total revenues as of 2024: Tier 1: >USD 1 billion, Tier 2: USD 500 million-1 billion, and Tier 3: USD 500 million.
The major players in the entertainment content and goods market with a significant geographical presence include The Walt Disney Company (US), Universal Music Group N.V. (Netherlands), Warner Bros. Entertainment Inc. (US), Sony Music Entertainment (US), Paramount (US), and others.
Research Coverage
The report segments the entertainment content and goods market and forecasts its size by music artist goods type, licensed goods type, animated content creation, and region. It also comprehensively reviews drivers, restraints, opportunities, and challenges influencing market growth. The report covers qualitative aspects in addition to quantitative aspects of the market.
Reasons to buy the report
The report will help the market leaders/new entrants in this market with information on the closest approximate revenues for the overall entertainment content and goods market and related segments. This report will help stakeholders understand the competitive landscape and gain more insights to strengthen their position in the market and plan suitable go-to-market strategies. The report also helps stakeholders understand the pulse of the market and provides them with information on key market drivers, restraints, opportunities, and challenges.
The report provides insights on the following pointers:
- Analysis of key drivers (rising consumer demand for personalized and experiential entertainment goods, rapid advances in AI, 5G, and immersive technologies, rise in cross-platform content integration), restraints (growing instances of content and merchandise piracy, economic constraints and subscription fatigue), opportunities (increasing collaboration between innovative brands and artists, rising integration of blockchain and non-fungible tokens into digital goods, growing digitally connected population in emerging economies), and challenges (high cost of premium merchandise production, increasing competition among entertainment platforms, rapidly changing consumer preferences and volatility in market trends)
- Product Development/Innovation: Detailed insights on upcoming technologies, research & development activities, and new product/service launches in the entertainment content and goods market
- Market Development: Comprehensive information about lucrative markets -the report analyses the entertainment content and goods market across varied regions
- Market Diversification: Exhaustive information about new products, untapped geographies, and recent developments such as partnerships, collaborations, acquisitions, agreements, and expansions in the entertainment content and goods market
- Competitive Assessment: In-depth assessment of market shares, growth strategies, and product offerings of leading players, including The Walt Disney Company (US), Universal Music Group N.V. (Netherlands), Warner Music Group Inc. (US), Sony Music Entertainment (US), Paramount (US), Netflix, Inc. (US), Fanatics Inc. (US), DreamWorks Animation (US), Illumination (US), Amazon.com, Inc. (US), PUMA SE (Germany), New Era Cap (US), Adidas AG (Germany), Merchbar, Inc. (US), and Nike, Inc. (US).
TABLE OF CONTENTS
1 INTRODUCTION
- 1.1 STUDY OBJECTIVES
- 1.2 MARKET DEFINITION
- 1.3 STUDY SCOPE
- 1.3.1 MARKETS COVERED AND REGIONAL SCOPE
- 1.3.2 INCLUSIONS AND EXCLUSIONS
- 1.3.3 YEARS CONSIDERED
- 1.4 CURRENCY CONSIDERED
- 1.5 STAKEHOLDERS
2 RESEARCH METHODOLOGY
- 2.1 RESEARCH DATA
- 2.1.1 SECONDARY AND PRIMARY RESEARCH
- 2.1.2 SECONDARY DATA
- 2.1.2.1 List of key secondary sources
- 2.1.2.2 Key data from secondary sources
- 2.1.3 PRIMARY DATA
- 2.1.3.1 List of primary interview participants
- 2.1.3.2 Breakdown of primaries
- 2.1.3.3 Key data from primary sources
- 2.1.3.4 Key industry insights
- 2.2 MARKET SIZE ESTIMATION
- 2.2.1 BOTTOM-UP APPROACH
- 2.2.1.1 Approach to arrive at market size using bottom-up analysis (demand side)
- 2.2.2 TOP-DOWN APPROACH
- 2.2.2.1 Approach to arrive at market size using top-down analysis (supply side)
- 2.2.1 BOTTOM-UP APPROACH
- 2.3 FACTOR ANALYSIS
- 2.3.1 DEMAND-SIDE ANALYSIS
- 2.3.2 SUPPLY-SIDE ANALYSIS
- 2.4 MARKET BREAKDOWN AND DATA TRIANGULATION
- 2.5 RESEARCH ASSUMPTIONS
- 2.6 RESEARCH LIMITATIONS
- 2.7 RISK ANALYSIS
3 EXECUTIVE SUMMARY
4 PREMIUM INSIGHTS
- 4.1 ATTRACTIVE OPPORTUNITIES FOR PLAYERS IN ENTERTAINMENT CONTENT AND GOODS MARKET
- 4.2 ENTERTAINMENT CONTENT AND GOODS MARKET, BY MUSIC ARTIST GOODS TYPE
- 4.3 ENTERTAINMENT CONTENT AND GOODS MARKET, BY LICENSED GOODS TYPE
- 4.4 ENTERTAINMENT CONTENT AND GOODS MARKET, BY ANIMATED CONTENT CREATION
- 4.5 ENTERTAINMENT CONTENT AND GOODS MARKET, BY REGION
- 4.6 ENTERTAINMENT CONTENT AND GOODS MARKET, BY GEOGRAPHY
5 MARKET OVERVIEW
- 5.1 INTRODUCTION
- 5.2 MARKET DYNAMICS
- 5.2.1 DRIVERS
- 5.2.1.1 Rising consumer demand for personalized and experiential entertainment goods
- 5.2.1.2 Rapid advances in AI, 5G, and immersive technologies
- 5.2.1.3 Rise in cross-platform content integration
- 5.2.2 RESTRAINTS
- 5.2.2.1 Growing instances of content and merchandise piracy
- 5.2.2.2 Economic constraints and subscription fatigue
- 5.2.3 OPPORTUNITIES
- 5.2.3.1 Increasing collaboration between innovative brands and artists
- 5.2.3.2 Rising integration of blockchain and non-fungible tokens into digital goods
- 5.2.3.3 Growing digitally connected population in emerging economies
- 5.2.4 CHALLENGES
- 5.2.4.1 High cost of premium merchandise production
- 5.2.4.2 Increasing competition among entertainment platforms
- 5.2.4.3 Rapidly changing consumer preferences and volatility in market trends
- 5.2.1 DRIVERS
- 5.3 VALUE CHAIN ANALYSIS
- 5.4 ECOSYSTEM ANALYSIS
- 5.5 TRENDS/DISRUPTIONS IMPACTING CUSTOMER BUSINESS
- 5.6 TECHNOLOGY ANALYSIS
- 5.6.1 KEY TECHNOLOGIES
- 5.6.1.1 Content streaming infrastructure
- 5.6.1.2 Digital rights management (DRM)
- 5.6.1.3 E-commerce merchandise platforms
- 5.6.2 COMPLEMENTARY TECHNOLOGIES
- 5.6.2.1 Artificial intelligence (AI)
- 5.6.2.2 Blockchain
- 5.6.2.3 Augmented reality (AR) and virtual reality (VR)
- 5.6.3 ADJACENT TECHNOLOGIES
- 5.6.3.1 Generative AI
- 5.6.3.2 Web3 and decentralized platforms
- 5.6.3.3 3D printing
- 5.6.1 KEY TECHNOLOGIES
- 5.7 PRICING ANALYSIS
- 5.7.1 PRICING TREND OF ENTERTAINMENT CONTENT AND GOODS, BY TYPE, 2021-2024
- 5.8 CASE STUDY ANALYSIS
- 5.8.1 NEW BELGIUM BREWING AND TUBI'S IN-HOUSE CONTENT STUDIO PARTNERED TO INTEGRATE VOODOO RANGER SKELETON MASCOT INTO THE FREAK BROTHERS TO BOOST BRAND IDENTITY
- 5.8.2 INFOSYS HELPS GLOBAL MUSIC AND ENTERTAINMENT COMPANY IMPLEMENT CENTRALIZED PLATFORM TO ENABLE UNIFORM PROCESSING WORKFLOWS
- 5.8.3 LG UPLUS INSTALLS MICROSOFT TEAMS TO MODERNIZE WORKPLACE COMMUNICATION AND CONTENT COLLABORATION
- 5.9 KEY CONFERENCES AND EVENTS, 2025-2026
6 ENTERTAINMENT CONTENT AND GOODS MARKET, BY MUSIC ARTIST GOODS TYPE
- 6.1 INTRODUCTION
- 6.2 APPAREL
- 6.2.1 RISE IN ARTIST-LED FASHION COLLABORATIONS WITH GLOBAL BRANDS AND MERCHANDISING SPECIALISTS TO BOLSTER SEGMENTAL GROWTH
- 6.2.2 PRINTED T-SHIRTS
- 6.2.3 HOODIES AND SWEATSHIRTS
- 6.2.4 CAPS, HATS, AND BEANIES
- 6.3 ACCESSORIES
- 6.3.1 EXPANDING DIRECT-TO-FAN COMMERCE CHANNELS TO CONTRIBUTE TO SEGMENTAL GROWTH
- 6.3.2 BAGS
- 6.3.3 SHOES
- 6.3.4 WATCHES
- 6.3.5 OTHER ACCESSORIES
- 6.4 LIFESTYLE AND HOME GOODS
- 6.4.1 EVOLVING GIFTING CULTURE AND AESTHETICALLY CURATED WORK-FROM-HOME ENVIRONMENTS TO FUEL SEGMENTAL GROWTH
- 6.4.2 MUGS AND DRINKWARE
- 6.4.3 POSTERS AND ARTWORK
- 6.4.4 STATIONERY
- 6.5 MUSIC EQUIPMENT AND MEMORABILIA
- 6.5.1 GROWING POPULARITY OF RETRO-STYLE MUSIC EXPERIENCES TO AUGMENT SEGMENTAL GROWTH
- 6.5.2 VINYL RECORDS
- 6.5.3 SIGNED MERCHANDISE
- 6.5.4 MUSICAL INSTRUMENTS
7 ENTERTAINMENT CONTENT AND GOODS MARKET, BY LICENSED GOODS TYPE
- 7.1 INTRODUCTION
- 7.2 LICENSED SPORTSWEAR
- 7.2.1 BURGEONING DEMAND FOR SUSTAINABLE, LIMITED-EDITION, AND INFLUENCER-BACKED MERCHANDISE TO DRIVE MARKET
- 7.2.2 OFFICIAL TEAM JERSEYS AND TEES
- 7.2.3 BRANDED ATHLETIC CAPS AND HEADWEAR
- 7.2.4 SPORTS TEAM HOODIES AND OUTERWEAR
- 7.3 ATHLETIC AND FAN ACCESSORIES
- 7.3.1 INCREASING USE OF CELEBRITY-THEMED BAGS, SHOES, WATCHES, AND OTHER PERSONAL ACCESSORIES TO BOOST SEGMENTAL GROWTH
- 7.3.2 TEAM-BRANDED BAGS
- 7.3.3 SPORTS EDITION FOOTWEAR
- 7.3.4 SMARTWATCHES AND FITNESS BANDS
- 7.3.5 OTHER BRANDED ACCESSORIES
- 7.4 SPORTING EQUIPMENT
- 7.4.1 FAN-DRIVEN PERSONALIZATION AND BRAND COLLABORATIONS TO FUEL SEGMENTAL GROWTH
- 7.4.2 BALLS
- 7.4.3 RACKETS
- 7.4.4 GLOVES AND PADS
- 7.4.5 OTHER SPORTING EQUIPMENT
- 7.5 LIFESTYLE, FAN GEAR, AND MEMORABILIA
- 7.5.1 PERSONALIZATION TRENDS AND EXPANDING OMNICHANNEL RETAIL STRATEGIES TO DRIVE MARKET
- 7.5.2 BOTTLES AND DRINKWARE
- 7.5.3 SCARVES AND WRISTBANDS
- 7.5.4 COLLECTIBLES
- 7.5.5 POSTERS, CALENDARS, AND PHOTOBOOKS
- 7.5.6 OTHER LICENSED PRODUCTS
8 ENTERTAINMENT CONTENT AND GOODS MARKET, BY ANIMATED CONTENT CREATION
- 8.1 INTRODUCTION
- 8.2 BY CONTENT TYPE
- 8.2.1 FILMS
- 8.2.1.1 Increasing investment in immersive storytelling and global appetite for cross-generational content to fuel segmental growth
- 8.2.2 TV/OTT
- 8.2.2.1 Surging demand for binge-worthy series and animation to contribute to segmental growth
- 8.2.1 FILMS
- 8.3 BY ANIMATION STYLE
- 8.3.1 2D ANIMATION
- 8.3.2 3D ANIMATION
- 8.3.3 STOP-MOTION ANIMATION
- 8.3.4 MIXED MEDIA
9 ENTERTAINMENT CONTENT AND GOODS MARKET, BY REGION
- 9.1 INTRODUCTION
- 9.2 NORTH AMERICA
- 9.2.1 MACROECONOMIC OUTLOOK FOR NORTH AMERICA
- 9.2.2 US
- 9.2.2.1 Strong commercialization of intellectual property to accelerate market growth
- 9.2.3 CANADA
- 9.2.3.1 Growing emphasis on content development and fan engagement to boost market growth
- 9.2.4 MEXICO
- 9.2.4.1 Rising digitally active population and disposable incomes to fuel market growth
- 9.3 EUROPE
- 9.3.1 MACROECONOMIC OUTLOOK FOR EUROPE
- 9.3.2 GERMANY
- 9.3.2.1 Widespread use of streaming services and online gaming platforms to augment market growth
- 9.3.3 UK
- 9.3.3.1 Integration of AR/VR technologies into entertainment content to foster market growth
- 9.3.4 FRANCE
- 9.3.4.1 Synergy between content production and consumer goods to expedite market growth
- 9.3.5 ITALY
- 9.3.5.1 Availability of limited-edition goods, vintage content collectibles, and localized merchandise to drive market
- 9.3.6 REST OF EUROPE
- 9.4 ASIA PACIFIC
- 9.4.1 MACROECONOMIC OUTLOOK FOR ASIA PACIFIC
- 9.4.2 CHINA
- 9.4.2.1 Strong mobile-first consumption habits to contribute to market growth
- 9.4.3 JAPAN
- 9.4.3.1 Advanced animation studios and strong legacy IP portfolios to boost market growth
- 9.4.4 SOUTH KOREA
- 9.4.4.1 Growing popularity of official light sticks and digital collectibles to fuel market growth
- 9.4.5 INDIA
- 9.4.5.1 Expansion of OTT platforms and surge in regional language content to drive market
- 9.4.6 REST OF ASIA PACIFIC
- 9.5 ROW
- 9.5.1 MACROECONOMIC OUTLOOK FOR ROW
- 9.5.2 MIDDLE EAST & AFRICA
- 9.5.2.1 Growing monetization of local cultural IPs to contribute to market growth
- 9.5.3 SOUTH AMERICA
- 9.5.3.1 Increasing investment in local entertainment content production to augment market growth
10 COMPETITIVE LANDSCAPE
- 10.1 OVERVIEW
- 10.2 KEY PLAYER STRATEGIES/RIGHT TO WIN, 2021-2025
- 10.2.1 COMPANY FOOTPRINT: KEY PLAYERS, 2024
- 10.2.1.1 Company footprint
- 10.2.1.2 Region footprint
- 10.2.1.3 Music artist goods type footprint
- 10.2.1.4 Licensed goods type footprint
- 10.2.1.5 Animated content creation footprint
- 10.2.1 COMPANY FOOTPRINT: KEY PLAYERS, 2024
- 10.3 COMPETITIVE SCENARIO
- 10.3.1 PRODUCT/SERVICE LAUNCHES
- 10.3.2 DEALS
- 10.3.3 EXPANSIONS
11 COMPANY PROFILES
- 11.1 INTRODUCTION
- 11.2 KEY PLAYERS
- 11.2.1 MERCHBAR, INC.
- 11.2.1.1 Business overview
- 11.2.1.2 Products/Solutions/Services offered
- 11.2.1.3 Recent developments
- 11.2.1.3.1 Deals
- 11.2.2 FANATICS INC.
- 11.2.2.1 Business overview
- 11.2.2.2 Products/Solutions/Services offered
- 11.2.2.3 Recent developments
- 11.2.2.3.1 Product/Service launches
- 11.2.2.3.2 Deals
- 11.2.3 NIKE, INC.
- 11.2.3.1 Business overview
- 11.2.3.2 Products/Solutions/Services offered
- 11.2.3.3 Recent developments
- 11.2.3.3.1 Product/Service launches
- 11.2.3.3.2 Deals
- 11.2.4 ADIDAS AG
- 11.2.4.1 Business overview
- 11.2.4.2 Products/Solutions/Services offered
- 11.2.4.3 Recent developments
- 11.2.4.3.1 Product/Service launches
- 11.2.4.3.2 Deals
- 11.2.5 NEW ERA CAP
- 11.2.5.1 Business overview
- 11.2.5.2 Products/Solutions/Services offered
- 11.2.5.3 Recent developments
- 11.2.5.3.1 Product/Service launches
- 11.2.5.3.2 Deals
- 11.2.6 PUMA SE
- 11.2.6.1 Business overview
- 11.2.6.2 Products/Solutions/Services offered
- 11.2.6.3 Recent developments
- 11.2.6.3.1 Product/Service launches
- 11.2.6.3.2 Deals
- 11.2.7 THE WALT DISNEY COMPANY
- 11.2.7.1 Business overview
- 11.2.7.2 Products/Solutions/Services offered
- 11.2.7.3 Recent developments
- 11.2.7.3.1 Product/Service launches
- 11.2.7.3.2 Deals
- 11.2.7.3.3 Expansions
- 11.2.8 DREAMWORKS ANIMATION
- 11.2.8.1 Business overview
- 11.2.8.2 Products/Solutions/Services offered
- 11.2.8.3 Recent developments
- 11.2.8.3.1 Deals
- 11.2.9 ILLUMINATION
- 11.2.9.1 Business overview
- 11.2.9.2 Products/Solutions/Services offered
- 11.2.9.3 Recent developments
- 11.2.9.3.1 Product/Service launches
- 11.2.9.3.2 Deals
- 11.2.10 PARAMOUNT
- 11.2.10.1 Business overview
- 11.2.10.2 Products/Solutions/Services offered
- 11.2.10.3 Recent developments
- 11.2.10.3.1 Product/Service launches
- 11.2.10.3.2 Deals
- 11.2.1 MERCHBAR, INC.
- 11.3 OTHER PLAYERS
- 11.3.1 NETFLIX, INC.
- 11.3.2 UNIVERSAL MUSIC GROUP N.V.
- 11.3.3 SONY MUSIC ENTERTAINMENT
- 11.3.4 WARNER MUSIC GROUP INC.
- 11.3.5 AMAZON.COM, INC.
12 APPENDIX
- 12.1 INSIGHTS FROM INDUSTRY EXPERTS
- 12.2 DISCUSSION GUIDE
- 12.3 KNOWLEDGESTORE: MARKETSANDMARKETS' SUBSCRIPTION PORTAL
- 12.4 CUSTOMIZATION OPTIONS
- 12.5 RELATED REPORTS
- 12.6 AUTHOR DETAILS
List of Tables
- TABLE 1 LIST OF KEY SECONDARY SOURCES
- TABLE 2 LIST OF PRIMARY INTERVIEW PARTICIPANTS
- TABLE 3 KEY DATA FROM PRIMARY SOURCES
- TABLE 4 ENTERTAINMENT CONTENT AND GOODS MARKET: RESEARCH ASSUMPTIONS
- TABLE 5 ENTERTAINMENT CONTENT AND GOODS MARKET: RISK ANALYSIS
- TABLE 6 ROLE OF COMPANIES IN ENTERTAINMENT CONTENT AND GOODS ECOSYSTEM
- TABLE 7 PRICING TREND OF ENTERTAINMENT CONTENT AND GOODS, BY TYPE, 2021-2024 (USD)
- TABLE 8 LIST OF KEY CONFERENCES AND EVENTS, 2025-2026
- TABLE 9 MUSIC ARTIST GOODS: ENTERTAINMENT CONTENT AND GOODS MARKET, BY PRODUCT TYPE, 2021-2024 (USD MILLION)
- TABLE 10 MUSIC ARTIST GOODS: ENTERTAINMENT CONTENT AND GOODS MARKET, BY PRODUCT TYPE, 2025-2030 (USD MILLION)
- TABLE 11 MUSIC ARTIST GOODS: ENTERTAINMENT CONTENT AND GOODS MARKET, BY REGION, 2021-2024 (USD MILLION)
- TABLE 12 MUSIC ARTIST GOODS: ENTERTAINMENT CONTENT AND GOODS MARKET, BY REGION, 2025-2030 (USD MILLION)
- TABLE 13 ENTERTAINMENT CONTENT AND GOODS MARKET FOR LICENSED GOODS, BY PRODUCT TYPE, 2021-2024 (USD MILLION)
- TABLE 14 ENTERTAINMENT CONTENT AND GOODS MARKET FOR LICENSED GOODS, BY PRODUCT TYPE, 2025-2030 (USD MILLION)
- TABLE 15 LICENSED GOODS: ENTERTAINMENT CONTENT AND GOODS MARKET, BY REGION, 2021-2024 (USD MILLION)
- TABLE 16 LICENSED GOODS: ENTERTAINMENT CONTENT AND GOODS MARKET, BY REGION, 2025-2030 (USD MILLION)
- TABLE 17 ANIMATED CONTENT CREATION: ENTERTAINMENT CONTENT AND GOODS MARKET, BY CONTENT TYPE, 2021-2024 (USD MILLION)
- TABLE 18 ANIMATED CONTENT CREATION: ENTERTAINMENT CONTENT AND GOODS MARKET, BY CONTENT TYPE, 2025-2030 (USD MILLION)
- TABLE 19 ENTERTAINMENT CONTENT AND GOODS MARKET, BY REGION, 2021-2024 (USD MILLION)
- TABLE 20 ENTERTAINMENT CONTENT AND GOODS MARKET, BY REGION, 2025-2030 (USD MILLION)
- TABLE 21 NORTH AMERICA: ENTERTAINMENT CONTENT AND GOODS MARKET, BY COUNTRY, 2021-2024 (USD MILLION)
- TABLE 22 NORTH AMERICA: ENTERTAINMENT CONTENT AND GOODS MARKET, BY COUNTRY, 2025-2030 (USD MILLION)
- TABLE 23 US: ENTERTAINMENT CONTENT AND GOODS MARKET, BY TYPE, 2021-2024 (USD MILLION)
- TABLE 24 US: ENTERTAINMENT CONTENT AND GOODS MARKET, BY TYPE, 2025-2030 (USD MILLION)
- TABLE 25 CANADA: ENTERTAINMENT CONTENT AND GOODS MARKET, BY TYPE, 2021-2024 (USD MILLION)
- TABLE 26 CANADA: ENTERTAINMENT CONTENT AND GOODS MARKET, BY TYPE, 2025-2030 (USD MILLION)
- TABLE 27 MEXICO: ENTERTAINMENT CONTENT AND GOODS MARKET, BY TYPE, 2021-2024 (USD MILLION)
- TABLE 28 MEXICO: ENTERTAINMENT CONTENT AND GOODS MARKET, BY TYPE, 2025-2030 (USD MILLION)
- TABLE 29 EUROPE: ENTERTAINMENT CONTENT AND GOODS MARKET, BY COUNTRY, 2021-2024 (USD MILLION)
- TABLE 30 EUROPE: ENTERTAINMENT CONTENT AND GOODS MARKET, BY COUNTRY, 2025-2030 (USD MILLION)
- TABLE 31 GERMANY: ENTERTAINMENT CONTENT AND GOODS MARKET, BY TYPE, 2021-2024 (USD MILLION)
- TABLE 32 GERMANY: ENTERTAINMENT CONTENT AND GOODS MARKET, BY TYPE, 2025-2030 (USD MILLION)
- TABLE 33 UK: ENTERTAINMENT CONTENT AND GOODS MARKET, BY TYPE, 2021-2024 (USD MILLION)
- TABLE 34 UK: ENTERTAINMENT CONTENT AND GOODS MARKET, BY TYPE, 2025-2030 (USD MILLION)
- TABLE 35 FRANCE: ENTERTAINMENT CONTENT AND GOODS MARKET, BY TYPE, 2021-2024 (USD MILLION)
- TABLE 36 FRANCE: ENTERTAINMENT CONTENT AND GOODS MARKET, BY TYPE, 2025-2030 (USD MILLION)
- TABLE 37 ITALY: ENTERTAINMENT CONTENT AND GOODS MARKET, BY TYPE, 2021-2024 (USD MILLION)
- TABLE 38 ITALY: ENTERTAINMENT CONTENT AND GOODS MARKET, BY TYPE, 2025-2030 (USD MILLION)
- TABLE 39 REST OF EUROPE: ENTERTAINMENT CONTENT AND GOODS MARKET, BY TYPE, 2021-2024 (USD MILLION)
- TABLE 40 REST OF EUROPE: ENTERTAINMENT CONTENT AND GOODS MARKET, BY TYPE, 2025-2030 (USD MILLION)
- TABLE 41 ASIA PACIFIC: ENTERTAINMENT CONTENT AND GOODS MARKET, BY COUNTRY, 2021-2024 (USD MILLION)
- TABLE 42 ASIA PACIFIC: ENTERTAINMENT CONTENT AND GOODS MARKET, BY COUNTRY, 2025-2030 (USD MILLION)
- TABLE 43 CHINA: ENTERTAINMENT CONTENT AND GOODS MARKET, BY TYPE, 2021-2024 (USD MILLION)
- TABLE 44 CHINA: ENTERTAINMENT CONTENT AND GOODS MARKET, BY TYPE, 2025-2030 (USD MILLION)
- TABLE 45 JAPAN: ENTERTAINMENT CONTENT AND GOODS MARKET, BY TYPE, 2021-2024 (USD MILLION)
- TABLE 46 JAPAN: ENTERTAINMENT CONTENT AND GOODS MARKET, BY TYPE, 2025-2030 (USD MILLION)
- TABLE 47 SOUTH KOREA: ENTERTAINMENT CONTENT AND GOODS MARKET, BY TYPE, 2021-2024 (USD MILLION)
- TABLE 48 SOUTH KOREA: ENTERTAINMENT CONTENT AND GOODS MARKET, BY TYPE, 2025-2030 (USD MILLION)
- TABLE 49 INDIA: ENTERTAINMENT CONTENT AND GOODS MARKET, BY TYPE, 2021-2024 (USD MILLION)
- TABLE 50 INDIA: ENTERTAINMENT CONTENT AND GOODS MARKET, BY TYPE, 2025-2030 (USD MILLION)
- TABLE 51 REST OF ASIA PACIFIC: ENTERTAINMENT CONTENT AND GOODS MARKET, BY TYPE, 2021-2024 (USD MILLION)
- TABLE 52 REST OF ASIA PACIFIC: ENTERTAINMENT CONTENT AND GOODS MARKET, BY TYPE, 2025-2030 (USD MILLION)
- TABLE 53 ROW: ENTERTAINMENT CONTENT AND GOODS MARKET, BY REGION, 2021-2024 (USD MILLION)
- TABLE 54 ROW: ENTERTAINMENT CONTENT AND GOODS MARKET, BY REGION, 2025-2030 (USD MILLION)
- TABLE 55 MIDDLE EAST & AFRICA: ENTERTAINMENT CONTENT AND GOODS MARKET, BY TYPE, 2021-2024 (USD MILLION)
- TABLE 56 MIDDLE EAST & AFRICA: ENTERTAINMENT CONTENT AND GOODS MARKET, BY TYPE, 2025-2030 (USD MILLION)
- TABLE 57 SOUTH AMERICA: ENTERTAINMENT CONTENT AND GOODS MARKET, BY TYPE, 2021-2024 (USD MILLION)
- TABLE 58 SOUTH AMERICA: ENTERTAINMENT CONTENT AND GOODS MARKET, BY TYPE, 2025-2030 (USD MILLION)
- TABLE 59 ENTERTAINMENT CONTENT AND GOODS MARKET: OVERVIEW OF STRATEGIES ADOPTED BY KEY PLAYERS, JANUARY 2021-JULY 2025
- TABLE 60 ENTERTAINMENT CONTENT AND GOODS MARKET: REGION FOOTPRINT
- TABLE 61 ENTERTAINMENT CONTENT AND GOODS MARKET: MUSIC ARTIST GOODS TYPE FOOTPRINT
- TABLE 62 ENTERTAINMENT CONTENT AND GOODS MARKET: LICENSED GOODS TYPE FOOTPRINT
- TABLE 63 ENTERTAINMENT CONTENT AND GOODS MARKET: ANIMATED CONTENT CREATION FOOTPRINT
- TABLE 64 ENTERTAINMENT CONTENT AND GOODS MARKET: PRODUCT/SERVICE LAUNCHES, JANUARY 2021-JULY 2025
- TABLE 65 ENTERTAINMENT CONTENT AND GOODS MARKET: DEALS, JANUARY 2021-JULY 2025
- TABLE 66 ENTERTAINMENT CONTENT AND GOODS MARKET: EXPANSIONS, JANUARY 2021-JULY 2025
- TABLE 67 MERCHBAR, INC.: COMPANY OVERVIEW
- TABLE 68 MERCHBAR, INC.: PRODUCTS/SOLUTIONS/SERVICES OFFERED
- TABLE 69 MERCHBAR, INC.: DEALS
- TABLE 70 FANATICS INC.: COMPANY OVERVIEW
- TABLE 71 FANATICS INC.: PRODUCTS/SOLUTIONS/SERVICES OFFERED
- TABLE 72 FANATICS INC.: PRODUCT/SERVICE LAUNCHES
- TABLE 73 FANATICS INC.: DEALS
- TABLE 74 NIKE, INC.: COMPANY OVERVIEW
- TABLE 75 NIKE, INC.: PRODUCTS/SOLUTIONS/SERVICES OFFERED
- TABLE 76 NIKE, INC.: PRODUCT/SERVICE LAUNCHES
- TABLE 77 NIKE, INC.: DEALS
- TABLE 78 ADIDAS AG: COMPANY OVERVIEW
- TABLE 79 ADIDAS AG: PRODUCTS/SOLUTIONS/SERVICES OFFERED
- TABLE 80 ADIDAS AG: PRODUCT/SERVICE LAUNCHES
- TABLE 81 ADIDAS AG: DEALS
- TABLE 82 NEW ERA CAP: COMPANY OVERVIEW
- TABLE 83 NEW ERA CAP: PRODUCTS/SOLUTIONS/SERVICES OFFERED
- TABLE 84 NEW ERA CAP: PRODUCT/SERVICE LAUNCHES
- TABLE 85 NEW ERA CAP: DEALS
- TABLE 86 PUMA SE: COMPANY OVERVIEW
- TABLE 87 PUMA SE: PRODUCTS/SOLUTIONS/SERVICES OFFERED
- TABLE 88 PUMA SE: PRODUCT/SERVICE LAUNCHES
- TABLE 89 PUMA SE: DEALS
- TABLE 90 THE WALT DISNEY COMPANY: COMPANY OVERVIEW
- TABLE 91 THE WALT DISNEY COMPANY: PRODUCTS/SOLUTIONS/SERVICES OFFERED
- TABLE 92 THE WALT DISNEY COMPANY: PRODUCT/SERVICE LAUNCHES
- TABLE 93 THE WALT DISNEY COMPANY: DEALS
- TABLE 94 THE WALT DISNEY COMPANY: EXPANSIONS
- TABLE 95 DREAMWORKS ANIMATION: COMPANY OVERVIEW
- TABLE 96 DREAMWORKS ANIMATION: PRODUCTS/SOLUTIONS/SERVICES OFFERED
- TABLE 97 DREAMWORKS ANIMATION: DEALS
- TABLE 98 ILLUMINATION: COMPANY OVERVIEW
- TABLE 99 ILLUMINATION: PRODUCTS/SOLUTIONS/SERVICES OFFERED
- TABLE 100 ILLUMINATION: PRODUCT/SERVICE LAUNCHES
- TABLE 101 ILLUMINATION: DEALS
- TABLE 102 PARAMOUNT: COMPANY OVERVIEW
- TABLE 103 PARAMOUNT: PRODUCTS/SOLUTIONS/SERVICES OFFERED
- TABLE 104 PARAMOUNT: PRODUCT/SERVICE LAUNCHES
- TABLE 105 PARAMOUNT: DEALS
List of Figures
- FIGURE 1 ENTERTAINMENT CONTENT AND GOODS MARKET SEGMENTATION AND REGIONAL SCOPE
- FIGURE 2 ENTERTAINMENT CONTENT AND GOODS MARKET: RESEARCH DESIGN
- FIGURE 3 KEY DATA FROM SECONDARY SOURCES
- FIGURE 4 BREAKDOWN OF PRIMARIES
- FIGURE 5 KEY INDUSTRY INSIGHTS
- FIGURE 6 ENTERTAINMENT CONTENT AND GOODS MARKET: BOTTOM-UP APPROACH
- FIGURE 7 ENTERTAINMENT CONTENT AND GOODS MARKET: TOP-DOWN APPROACH
- FIGURE 8 ENTERTAINMENT CONTENT AND GOODS MARKET SIZE ESTIMATION (DEMAND SIDE)
- FIGURE 9 ENTERTAINMENT CONTENT AND GOODS MARKET SIZE ESTIMATION (SUPPLY SIDE)
- FIGURE 10 ENTERTAINMENT CONTENT AND GOODS MARKET: DATA TRIANGULATION
- FIGURE 11 ENTERTAINMENT CONTENT AND GOODS MARKET SNAPSHOT
- FIGURE 12 APPAREL SEGMENT TO ACCOUNT FOR LARGEST MARKET SHARE IN 2025
- FIGURE 13 LIFESTYLE, FAN GEAR, AND MEMORABILIA SEGMENT TO WITNESS HIGHEST CAGR DURING FORECAST PERIOD
- FIGURE 14 TV/OTT SEGMENT TO RECORD HIGHEST CAGR BETWEEN 2025 AND 2030
- FIGURE 15 ASIA PACIFIC TO BE FASTEST-GROWING MARKET DURING FORECAST PERIOD
- FIGURE 16 DIGITAL CONTENT EXPANSION, FAN COMMERCE, AND TECH-ENABLED EXPERIENCES TO BOOST MARKET GROWTH
- FIGURE 17 APPAREL SEGMENT TO HOLD LARGEST MARKET SHARE IN 2030
- FIGURE 18 LIFESTYLE, FAN GEAR, AND MEMORABILIA SEGMENT TO REGISTER HIGHEST CAGR DURING FORECAST PERIOD
- FIGURE 19 TV/OTT SEGMENT TO CAPTURE LARGER SHARE OF ENTERTAINMENT CONTENT AND GOODS MARKET IN 2030
- FIGURE 20 ASIA PACIFIC TO WITNESS HIGHEST GROWTH RATE BETWEEN 2025 AND 2030
- FIGURE 21 INDIA TO REGISTER HIGHEST CAGR IN GLOBAL ENTERTAINMENT CONTENT AND GOODS MARKET DURING FORECAST PERIOD
- FIGURE 22 DRIVERS, RESTRAINTS, OPPORTUNITIES, AND CHALLENGES
- FIGURE 23 IMPACT ANALYSIS: DRIVERS
- FIGURE 24 IMPACT ANALYSIS: RESTRAINTS
- FIGURE 25 IMPACT ANALYSIS: OPPORTUNITIES
- FIGURE 26 IMPACT ANALYSIS: CHALLENGES
- FIGURE 27 VALUE CHAIN ANALYSIS
- FIGURE 28 ECOSYSTEM ANALYSIS
- FIGURE 29 TRENDS/DISRUPTIONS INFLUENCING CUSTOMER BUSINESS
- FIGURE 30 MUSIC EQUIPMENT AND MEMORABILIA SEGMENT TO EXHIBIT HIGHEST CAGR FROM 2025 TO 2030
- FIGURE 31 LIFESTYLE, FAN GEAR, AND MEMORABILIA SEGMENT TO RECORD HIGHEST CAGR DURING FORECAST PERIOD
- FIGURE 32 TV/OTT SEGMENT TO REGISTER HIGHER CAGR BETWEEN 2025 AND 2030
- FIGURE 33 ASIA PACIFIC TO EXHIBIT HIGHEST CAGR IN ENTERTAINMENT CONTENT AND GOODS MARKET BETWEEN 2025 AND 2030
- FIGURE 34 NORTH AMERICA: ENTERTAINMENT CONTENT AND GOODS MARKET SNAPSHOT
- FIGURE 35 EUROPE: ENTERTAINMENT CONTENT AND GOODS MARKET SNAPSHOT
- FIGURE 36 ASIA PACIFIC: ENTERTAINMENT CONTENT AND GOODS MARKET SNAPSHOT
- FIGURE 37 ENTERTAINMENT CONTENT AND GOODS MARKET: COMPANY FOOTPRINT


