


 |
市场调查报告书
商品编码
1812622
全球企业资产管理 (EAM) 市场(按资产类别和应用)- 2030 年预测Enterprise Asset Management Market by Asset Class, Application - Global Forecast to 2030 |
||||||
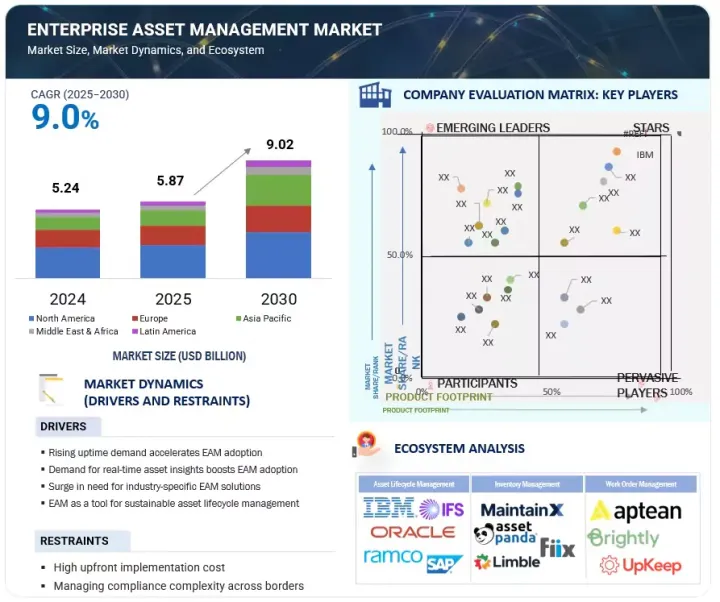
全球企业资产管理 (EAM) 市场正在快速扩张,预计将从 2025 年的约 58.7 亿美元成长到 2030 年的 90.2 亿美元,复合年增长率为 9.0%。
资产密集型产业对法规遵循和安全管理的需求不断增加,预计将推动 EAM 解决方案的采用。
| 调查范围 | |
|---|---|
| 调查年份 | 2020-2030 |
| 基准年 | 2024 |
| 预测期 | 2025-2030 |
| 单元 | 100万美元/10亿美元 |
| 部分 | 产品、用途、部署类型、资产类别、组织规模、产业 |
| 目标区域 | 北美、欧洲、亚太地区、中东和非洲、拉丁美洲 |
能源、医疗保健和交通运输业面临严格的设施安全、环境标准和营运报告合规性要求。 EAM 解决方案可协助组织维护准确的审核线索、追踪检查并确保资产符合监管标准,从而降低法律风险并增强相关利益者的信心。
然而,一个主要的限制因素是整合来自不同旧有系统和孤立运作的资料。许多公司,尤其是那些基础设施老化的公司,难以整合来自多个平台、手动记录和过时资产监控系统的数据。这种复杂性减缓了EAM的采用速度,并限制了其利用预测分析和即时监控等高阶功能的能力。这些因素凸显了监管需求如何推动采用,而整合障碍又如何阻碍无缝实施。
“根据组织规模,预计中小型企业部门在预测期内的复合年增长率最高。”
这一成长背后的驱动因素是云端基础的数位化 EAM 解决方案的日益普及,这些解决方案为中小企业提供了扩充性、经济高效且易于部署的选项。中小企业越来越多地投资于资产管理,以优化设备利用率、减少停机时间并提高营运效率,但他们需要根据其有限的资源量身定制的解决方案。基于订阅的模组化 EAM 产品使中小企业无需大量前期投资即可获得预测性维护、即时监控和分析等高级功能。
此外,中小企业对数位转型、法规遵循和永续性计画的推动进一步推动了对 EAM 解决方案的需求,使该领域成为预测期内市场上成长最快的组织类别。
“预计製造业将在预测期内占据最大的市场份额。”
製造业是资产密集产业,严重依赖机器、生产线和工业设备,停机和效率低下会直接影响产量和盈利。 EAM 解决方案可协助製造商优化资产利用率、监控设备效能并实施预防性维护策略,以减少非计划性停机。随着工业 4.0 和智慧工厂计划的兴起,製造商越来越多地采用支援物联网的 EAM 平台,这些平台整合了来自连网型设备、数位双胞胎和自动化系统的即时数据。
这些功能可在整个生产週期中提供预测性洞察、改善品管并简化工作流程。例如,Godrej & Boyce 于 2024 年 6 月实施了 HxGN EAM,将设备运转率从 60% 提高到 95%,劳动力运转率提高了 70%,库存成本降低了 45%。这些改进提高了营运效率,从而提高了生产力、降低了成本并提升了长期盈利。此外,製造业对严格的安全和环境法规的遵守进一步推动了对强大资产管理解决方案的需求。
本报告分析了全球企业资产管理 (EAM) 市场,提供了关键驱动因素和限制因素、竞争格局和未来趋势的资讯。
目录
第一章 引言
第二章调查方法
第三章执行摘要
第四章 主要发现
- 企业资产管理(EAM)市场为企业带来诱人机会
- 企业资产管理 (EAM) 市场(按服务划分)(2025 年和 2030 年)
- 企业资产管理 (EAM) 市场应用情况(2025 年和 2030 年)
- 企业资产管理 (EAM) 市场按部署类型划分(2025 年和 2030 年)
- 企业资产管理 (EAM) 市场:依组织规模(2025/2030)
- 企业资产管理 (EAM) 市场按资产类别划分(2025 年和 2030 年)
- 企业资产管理 (EAM) 市场按行业划分(2025 年和 2030 年)
- 企业资产管理(EAM)市场:区域格局
第五章市场概况与产业趋势(具有定量影响的策略驱动因素)
- 介绍
- 市场动态
- 驱动程式
- 抑制因素
- 机会
- 任务
- 波特五力分析
- 主要相关利益者和采购标准
- 生态系分析
- 供应链分析
- 监管格局
- 监管机构、政府机构和其他组织
- 主要法规:按地区
- 定价分析
- 平均销售价格:按地区(2021-2024年)
- 参考价格:主要企业(2024年)
- 技术分析
- 主要技术
- 互补技术
- 邻近技术
- 专利分析
- 案例研究分析
- 案例研究1:HUNGRANA 使用 SAP EAM 进行资产管理
- 案例研究2:利雅德机场公司利用 IBM MAXIMO 转变机场资产管理
- 案例研究3:使用 Hexagon 的 HXGN EAM 实现 MALARTAG 铁路网络无缝迁移
- 案例研究4:欧莱雅采用 CMMS 实现即时资产视觉化
- 案例研究5:APTEAN EAM 在 6 个月内推动工程团队成长 900%
- 大型会议和活动(2025-2026)
- 投资金筹措场景
- 人工智慧/生成式人工智慧对企业资产管理 (EAM) 市场的影响
- 案例研究分析
- 影响客户业务的趋势/中断
第六章:企业资产管理 (EAM) 市场按产品类型划分(市场规模和预测,到 2030 年)
- 介绍
- 解决方案
- 服务
第七章 企业资产管理(EAM)市场的应用(市场规模与预测,到 2030 年)
- 介绍
- 资产生命週期管理
- 商业管理
- 维护管理
- 合规与安全
- 报告和分析
- 其他用途
第 8 章:按部署类型分類的企业资产管理 (EAM) 市场(市场规模和预测,到 2030 年)
- 介绍
- 云
- 本地部署
第九章企业资产管理(EAM)市场按资产类别划分(市场规模和预测至 2030 年)
- 介绍
- 线性资产
- 生产设备
- 船队和动产
- 固定资产/设施资产/基础设施
- 其他资产
第 10 章:企业资产管理 (EAM) 市场按公司规模划分(市场规模和预测,到 2030 年)
- 介绍
- 大公司
- 小型企业
第 11 章:按行业垂直分類的企业资产管理 (EAM) 市场(市场规模和预测,到 2030 年)
- 介绍
- 製造业
- 能源与公共产业
- 石油和天然气
- 运输和物流
- 医学与生命科学
- 政府/公共部门
- 其他行业
12. 企业资产管理(EAM)市场(按地区)
- 介绍
- 北美洲
- 北美宏观经济展望
- 北美企业资产管理(EAM)市场驱动因素
- 美国
- 加拿大
- 欧洲
- 欧洲企业资产管理(EAM)市场驱动因素
- 欧洲宏观经济展望
- 英国
- 德国
- 法国
- 义大利
- 其他欧洲国家
- 亚太地区
- 亚太企业资产管理(EAM)市场驱动因素
- 亚太宏观经济展望
- 中国
- 日本
- 澳洲和纽西兰
- 其他亚太地区
- 中东和非洲
- 中东和非洲企业资产管理(EAM)市场驱动因素
- 中东和非洲的宏观经济展望
- 海湾合作委员会国家
- 南非
- 其他中东和非洲地区
- 拉丁美洲
- 拉丁美洲企业资产管理(EAM)市场驱动因素
- 拉丁美洲宏观经济展望
- 巴西
- 墨西哥
- 其他拉丁美洲
第十三章竞争格局
- 介绍
- 主要参与企业的策略/优势
- 收益分析(2020-2024)
- 市占率分析
- 品牌/产品比较
- 企业评估矩阵:主要企业(2024年)
- 公司评估矩阵:Start-Ups/中小企业(2024 年)
- 公司估值及财务指标
- 竞争场景
第十四章:公司简介
- 介绍
- 主要企业
- IBM
- SAP
- ORACLE
- IFS
- HEXAGON AB
- TRIMBLE
- APTEAN
- SERVICENOW
- HITACHI ENERGY
- RAMCO
- 其他公司
- ACCRUENT
- MAINTAINX
- EMAINT
- LLUMIN
- CENTRALSQUARE
- ABS GROUP
- UPKEEP
- ASSETWORKS
- ASSET PANDA
- ASSET INFINITY
- EZMAINTAIN
- KLOUDGIN
- LIMBLE CMMS
- IPS INTELLIGENT PROCESS SOLUTION
- EPROMIS SOLUTIONS
第 15 章:相邻/相关市场
- 介绍
- 相关市场
- 限制
- 人力资源管理
- 人力资源管理
第十六章 附录
The global enterprise asset management market (EAM) is expanding rapidly, with a projected market size anticipated to rise from about USD 5.87 billion in 2025 to USD 9.02 billion by 2030, featuring a CAGR of 9.0%. Growing demand for regulatory compliance and safety management in asset-intensive industries is expected to drive the adoption of EAM solutions.
| Scope of the Report | |
|---|---|
| Years Considered for the Study | 2020-2030 |
| Base Year | 2024 |
| Forecast Period | 2025-2030 |
| Units Considered | Value (USD Million/Billion) |
| Segments | Offering, Application, Deployment Type, Asset Class, Organization Size, Vertical |
| Regions covered | North America, Europe, Asia Pacific, the Middle East & Africa, and Latin America |
Energy, healthcare, and transportation sectors face strict compliance requirements related to equipment safety, environmental standards, and operational reporting. EAM solutions help organizations maintain accurate audit trails, track inspections, and ensure assets meet regulatory standards, reducing legal risks and improving stakeholder trust.
In contrast, a significant restraint is the data integration from diverse legacy systems and siloed operations. Many enterprises, particularly those with aging infrastructure, struggle to unify data from multiple platforms, manual records, and outdated equipment monitoring systems. This complexity slows EAM adoption and limits the ability to leverage advanced features such as predictive analytics and real-time monitoring. These factors highlight how regulatory needs drive adoption, while integration hurdles remain a barrier to seamless implementation.
"SMEs segment by organization size is expected to grow at the highest CAGR during the forecast period"
The small and medium-sized enterprises (SMEs) segment is expected to register the highest compound annual growth rate (CAGR) during the forecast period. This growth is driven by the increasing adoption of digital and cloud-based EAM solutions, which offer scalable, cost-effective, and easily deployable options for smaller organizations. SMEs increasingly invest in asset management to optimize equipment utilization, reduce downtime, and improve operational efficiency, but with solutions tailored to their limited resources. The availability of subscription-based and modular EAM offerings allows SMEs to access advanced features such as predictive maintenance, real-time monitoring, and analytics without heavy upfront investment.
Additionally, the push for digital transformation, regulatory compliance, and sustainability initiatives among SMEs further fuels the demand for EAM solutions, making this segment the fastest-growing organizational category in the market during the forecast period.
"Manufacturing vertical segment is expected to hold the largest market share during the forecast period"
Manufacturing is an asset-intensive sector that relies heavily on machinery, production lines, and industrial equipment, where downtime or inefficiencies can directly impact output and profitability. EAM solutions help manufacturers optimize asset utilization, monitor equipment performance, and implement proactive maintenance strategies to reduce unplanned downtime. With the rise of Industry 4.0 and smart factory initiatives, manufacturers are increasingly adopting IoT-enabled EAM platforms to integrate real-time data from connected devices, digital twins, and automation systems.
These capabilities allow for predictive insights, improved quality control, and streamlined workflows across the production cycle. For instance, in June 2024, Godrej & Boyce implemented HxGN EAM, and the company increased equipment uptime from 60% to 95%, improved labor utilization by 70%, and reduced inventory costs by 45%. These improvements enhanced operational efficiency and translated into higher productivity, cost savings, and long-term profitability for the business. Additionally, compliance with strict safety and environmental regulations in the manufacturing sector further drives the need for robust asset management solutions.
"Asia Pacific is expected to record the fastest growth, while North America is projected to hold the largest market share during the forecast period"
The Asia Pacific (APAC) region is driven by rapid industrialization, urbanization, and digital transformation across China, Japan, and Australia & New Zealand. Increasing adoption of smart manufacturing, IoT-enabled equipment, and predictive maintenance solutions is enhancing demand for EAM systems to improve asset performance and reduce operational costs. Significant government investments in infrastructure, energy, and transportation projects further support the need for efficient asset management.
Additionally, the rise of multinational corporations and SMEs seeking cloud-based and AI-powered EAM solutions is expanding the market. Growing focus on regulatory compliance and sustainable, cost-efficient operations positions Asia Pacific as the fastest-growing regional market, presenting substantial opportunities for technology providers and service vendors.
The North American EAM market is growing as organizations aim to optimize asset performance, reduce downtime, and enhance the lifespan of critical infrastructure. Growth is driven by IoT, AI, and cloud technologies that improve operational visibility and decision-making. Key sectors, such as manufacturing, energy, utilities, transportation, healthcare, and government, play significant roles, with a shift toward cloud-based platforms for scalability and cost-effectiveness. EAM solution providers should focus on cloud-based, AI-enhanced offerings to capitalize on this market trend.
Breakdown of primaries
We interviewed Chief Executive Officers (CEOs), directors of innovation and technology, system integrators, and executives from several significant enterprise asset management market companies.
- By Company: Tier I: 40%, Tier II: 35%, and Tier III: 25%
- By Designation: C-Level Executives: 45%, Director Level: 30%, and Others: 25%
- By Region: North America: 30%, Europe: 20%, Asia Pacific: 35%, Rest of World: 15%
Some of the significant enterprise asset management market vendors are IBM (US), Oracle (US), SAP (Germany), Hexagon (Sweden), IFS (Sweden), Aptean (US), Trimble (US), ServiceNow (US), Hitachi Energy (Switzerland), and Ramco (India).
Research Coverage
The market report covered the enterprise asset management market across segments. We estimated the market size and growth potential for many segments based on offerings, applications, deployment type, organization size, verticals, and region. It contains a thorough competition analysis of the major market participants, information about their businesses, essential observations about their product and service offerings, current trends, and critical market strategies.
Reasons to Buy This Report
With the most accurate revenue estimates for the entire enterprise asset management (EAM) market and its subsegments, this research will benefit established market leaders and recent entrants. Stakeholders will gain deeper insights into the competitive landscape, enabling them to position their offerings better and develop effective go-to-market strategies. The report highlights key market drivers, restraints, opportunities, and challenges, helping industry players understand the dynamics of the EAM ecosystem and align their strategy with evolving market demands.
The report provides insights into the following pointers:
- Analysis of key drivers (Rising uptime demand accelerates EAM adoption, Demand for real-time asset insights boosting EAM adoption, Demand for industry-specific EAM solutions, EAM as a tool for sustainable asset lifecycle management), restraints (High upfront implementation cost, Managing compliance complexity across borders), opportunities (Transforming EAM with Edge-to-Cloud innovation, Enable predictive maintenance with IIoT sensors), and challenges (Risk of cyberattacks and data privacy, Skilled workforce challenges in asset management), influencing the growth of the enterprise asset management market
- Product Development/Innovation: Comprehensive analysis of emerging technologies, R&D initiatives, and new service and product introductions in the enterprise asset management market
- Market Development: In-depth details regarding profitable markets - analyzing the global enterprise asset management market
- Market Diversification: Comprehensive details regarding recent advancements, investments, unexplored regions, new software and services, and enterprise asset management market
- Competitive Assessment: Thorough analysis of the market shares, expansion plans, and service portfolios of the top competitors in the enterprise asset management industry, such as IBM (US), Oracle (US), SAP (Germany), Hexagon (Sweden), IFS (Sweden), Aptean (US), Trimble (US), ServiceNow (US), Hitachi Energy (Switzerland), Ramco (India), Accruent (US), MaintainX (US), ABS Group (US), Central Square (US), KloudGin (US), Assetworks (US), Limble CMMS (US), Upkeep (US), Asset Panda (US), emaint (US), Asset Infinity (India), EZmaintain (India), Llumin (US), IPS Intelligent Process Solutions (Germany), and ePROMIS (US).
TABLE OF CONTENTS
1 INTRODUCTION
- 1.1 STUDY OBJECTIVES
- 1.2 MARKET DEFINITION
- 1.3 STUDY SCOPE
- 1.3.1 MARKET SEGMENTATION
- 1.3.2 INCLUSIONS AND EXCLUSIONS
- 1.3.3 YEARS CONSIDERED
- 1.3.4 CURRENCY CONSIDERED
- 1.4 STAKEHOLDERS
- 1.5 SUMMARY OF CHANGES
2 RESEARCH METHODOLOGY
- 2.1 RESEARCH APPROACH
- 2.1.1 SECONDARY DATA
- 2.1.2 PRIMARY DATA
- 2.1.2.1 Breakup of primary profiles
- 2.1.2.2 Key industry insights
- 2.2 MARKET BREAKUP AND DATA TRIANGULATION
- 2.3 MARKET SIZE ESTIMATION
- 2.3.1 TOP-DOWN APPROACH
- 2.3.2 BOTTOM-UP APPROACH
- 2.3.3 MARKET ESTIMATION APPROACHES
- 2.4 MARKET FORECAST
- 2.5 RESEARCH ASSUMPTIONS
- 2.6 RESEARCH LIMITATIONS
3 EXECUTIVE SUMMARY
4 PREMIUM INSIGHTS
- 4.1 ATTRACTIVE OPPORTUNITIES FOR PLAYERS IN ENTERPRISE ASSET MANAGEMENT MARKET
- 4.2 ENTERPRISE ASSET MANAGEMENT MARKET, BY OFFERING, 2025 VS 2030
- 4.3 ENTERPRISE ASSET MANAGEMENT MARKET, BY APPLICATION, 2025 VS 2030
- 4.4 ENTERPRISE ASSET MANAGEMENT MARKET, BY DEPLOYMENT TYPE, 2025 VS 2030
- 4.5 ENTERPRISE ASSET MANAGEMENT MARKET, BY ORGANIZATION SIZE, 2025 VS 2030
- 4.6 ENTERPRISE ASSET MANAGEMENT MARKET, BY ASSET CLASS, 2025 VS 2030
- 4.7 ENTERPRISE ASSET MANAGEMENT MARKET, BY VERTICAL, 2025 VS 2030
- 4.8 ENTERPRISE ASSET MANAGEMENT MARKET: REGIONAL SCENARIO
5 MARKET OVERVIEW AND INDUSTRY TRENDS(STRATEGIC DRIVERS WITH QUANTITATIVE IMPLICATIONS
- 5.1 INTRODUCTION
- 5.2 MARKET DYNAMICS
- 5.2.1 DRIVERS
- 5.2.1.1 Rising uptime demand accelerates EAM adoption
- 5.2.1.2 Demand for real-time asset insights boosting EAM adoption
- 5.2.1.3 Demand for industry-specific EAM solutions
- 5.2.1.4 EAM as a tool for sustainable asset lifecycle management
- 5.2.2 RESTRAINTS
- 5.2.2.1 High upfront implementation costs
- 5.2.2.2 Managing compliance complexity across borders
- 5.2.3 OPPORTUNITIES
- 5.2.3.1 Transforming EAM through edge-to-cloud innovation
- 5.2.3.2 Enable predictive maintenance with IIoT sensors
- 5.2.4 CHALLENGES
- 5.2.4.1 Risk of cyberattacks and data privacy
- 5.2.4.2 Skilled workforce challenges in asset management
- 5.2.1 DRIVERS
- 5.3 PORTER'S FIVE FORCES ANALYSIS
- 5.3.1 THREAT OF NEW ENTRANTS
- 5.3.2 THREAT OF SUBSTITUTES
- 5.3.3 BARGAINING POWER OF SUPPLIERS
- 5.3.4 BARGAINING POWER OF BUYERS
- 5.3.5 INTENSITY OF COMPETITIVE RIVALRY
- 5.4 KEY STAKEHOLDERS AND BUYING CRITERIA
- 5.4.1 KEY STAKEHOLDERS IN BUYING PROCESS
- 5.4.2 BUYING CRITERIA
- 5.5 ECOSYSTEM ANALYSIS
- 5.6 SUPPLY CHAIN ANALYSIS
- 5.7 REGULATORY LANDSCAPE
- 5.7.1 REGULATORY BODIES, GOVERNMENT AGENCIES, AND OTHER ORGANIZATIONS
- 5.7.2 KEY REGULATIONS, BY REGION
- 5.7.2.1 North America
- 5.7.2.2 Europe
- 5.7.2.3 Asia Pacific
- 5.7.2.4 Middle East & South Africa
- 5.7.2.5 Latin America
- 5.8 PRICING ANALYSIS
- 5.8.1 AVERAGE SELLING PRICE, BY REGION, 2021-2024
- 5.8.2 INDICATIVE PRICING, BY KEY PLAYER, 2024
- 5.9 TECHNOLOGY ANALYSIS
- 5.9.1 KEY TECHNOLOGIES
- 5.9.1.1 Artificial intelligence
- 5.9.1.2 Internet of Things (IoT)
- 5.9.1.3 Digital twins
- 5.9.2 COMPLEMENTARY TECHNOLOGIES
- 5.9.2.1 Enterprise resource planning (ERP)
- 5.9.2.2 Computerized maintenance management system (CMMS)
- 5.9.2.3 Geographic information system (GIS)
- 5.9.3 ADJACENT TECHNOLOGIES
- 5.9.3.1 Building information modeling (BIM)
- 5.9.3.2 Augmented reality (AR)
- 5.9.1 KEY TECHNOLOGIES
- 5.10 PATENT ANALYSIS
- 5.10.1 LIST OF MAJOR PATENTS
- 5.11 CASE STUDY ANALYSIS
- 5.11.1 CASE STUDY 1: HUNGRANA UTILIZED SAP EAM FOR ASSET MAINTENANCE
- 5.11.2 CASE STUDY 2: RIYADH AIRPORT COMPANY TRANSFORMING AIRPORT ASSET MANAGEMENT WITH IBM MAXIMO
- 5.11.3 CASE STUDY 3: SEAMLESS MALARTAG RAIL NETWORK TRANSITION WITH HEXAGON'S HXGN EAM
- 5.11.4 CASE STUDY 4: L'OREAL ACHIEVED REAL-TIME ASSET VISIBILITY BY ADOPTING CMMS
- 5.11.5 CASE STUDY 5: DRIVING 900% ENGINEERING TEAM GROWTH IN SIX MONTHS WITH APTEAN EAM
- 5.12 KEY CONFERENCES AND EVENTS, 2025-2026
- 5.13 INVESTMENT & FUNDING SCENARIO
- 5.14 IMPACT OF AI/GEN AI IN ENTERPRISE ASSET MANAGEMENT MARKET
- 5.14.1 VENDOR INITIATIVES
- 5.14.1.1 IBM
- 5.14.1.2 MaintainX
- 5.14.1 VENDOR INITIATIVES
- 5.15 CASE STUDY ANALYSIS
- 5.15.1 CASE STUDY: EXCITEL BUILT A PROACTIVE SUPPLY CHAIN WITH ASSET INSIDER
- 5.16 TRENDS/DISRUPTIONS IMPACTING CUSTOMERS' BUSINESSES
6 ENTERPRISE ASSET MANAGEMENT MARKET, BY OFFERING(MARKET SIZE & FORECAST TO 2030 - IN VALUE (USD MILLION))
- 6.1 INTRODUCTION
- 6.1.1 OFFERINGS: ENTERPRISE ASSET MANAGEMENT MARKET DRIVERS
- 6.2 SOLUTIONS
- 6.2.1 REDUCING DOWNTIME WITH INTEGRATED SOLUTIONS
- 6.2.1.1 Standalone solutions
- 6.2.1.2 Integrated platforms
- 6.2.1 REDUCING DOWNTIME WITH INTEGRATED SOLUTIONS
- 6.3 SERVICES
- 6.3.1 EFFECTIVE IMPLEMENTATION OF EAM WITH SERVICES
- 6.3.2 TRAINING & CONSULTING SERVICES
- 6.3.3 DEPLOYMENT & INTEGRATION SERVICES
- 6.3.4 SUPPORT & MAINTENANCE SERVICES
7 ENTERPRISE ASSET MANAGEMENT MARKET, BY APPLICATION(MARKET SIZE & FORECAST TO 2030 - IN VALUE (USD MILLION))
- 7.1 INTRODUCTION
- 7.1.1 APPLICATIONS: ENTERPRISE ASSET MANAGEMENT MARKET DRIVERS
- 7.2 ASSET LIFECYCLE MANAGEMENT
- 7.2.1 FORECASTING FUTURE NEEDS WITH ASSET PLANNING & FORECASTING
- 7.2.1.1 Asset tracking & utilization
- 7.2.1.2 Asset disposal & replacement
- 7.2.1.3 Asset planning & forecasting
- 7.2.1 FORECASTING FUTURE NEEDS WITH ASSET PLANNING & FORECASTING
- 7.3 OPERATION MANAGEMENT
- 7.3.1 RISING ADOPTION DUE TO NEED FOR ENHANCING OPERATIONAL VISIBILITY
- 7.3.1.1 Inventory management
- 7.3.1.2 Labor management
- 7.3.1.3 Work order management
- 7.3.1 RISING ADOPTION DUE TO NEED FOR ENHANCING OPERATIONAL VISIBILITY
- 7.4 MAINTENANCE MANAGEMENT
- 7.4.1 INTEGRATING MAINTENANCE WITH WORK ORDERS, LABOR, AND INVENTORY
- 7.4.1.1 Preventive maintenance
- 7.4.1.2 Predictive maintenance
- 7.4.1.3 Corrective maintenance
- 7.4.1 INTEGRATING MAINTENANCE WITH WORK ORDERS, LABOR, AND INVENTORY
- 7.5 COMPLIANCE & SAFETY
- 7.5.1 MINIMIZING RISK THROUGH PROACTIVE COMPLIANCE MANAGEMENT
- 7.5.1.1 Audit management
- 7.5.1.2 Regulatory compliance management
- 7.5.1.3 Risk assessment & mitigation
- 7.5.1 MINIMIZING RISK THROUGH PROACTIVE COMPLIANCE MANAGEMENT
- 7.6 REPORT & ANALYTICS
- 7.6.1 TRANSFORMING ASSET DATA INTO ACTIONABLE INSIGHTS
- 7.6.1.1 Performance analytics
- 7.6.1.2 KPI dashboards & alerts
- 7.6.1.3 Safety analytics
- 7.6.1 TRANSFORMING ASSET DATA INTO ACTIONABLE INSIGHTS
- 7.7 OTHER APPLICATIONS
8 ENTERPRISE ASSET MANAGEMENT MARKET, BY DEPLOYMENT TYPE(MARKET SIZE & FORECAST TO 2030 - IN VALUE (USD MILLION))
- 8.1 INTRODUCTION
- 8.1.1 DEPLOYMENT TYPE: ENTERPRISE ASSET MANAGEMENT MARKET DRIVERS
- 8.2 CLOUD
- 8.2.1 MAXIMIZING ASSET LIFECYCLE WITH CLOUD EAM
- 8.3 ON-PREMISES
- 8.3.1 REDUCING DOWNTIME WITH ROBUST ON-PREMISES SOLUTIONS
9 ENTERPRISE ASSET MANAGEMENT MARKET, BY ASSET CLASS(MARKET SIZE & FORECAST TO 2030 - IN VALUE (USD MILLION))
- 9.1 INTRODUCTION
- 9.1.1 ASSET CLASS: ENTERPRISE ASSET MANAGEMENT MARKET DRIVERS
- 9.2 LINEAR ASSETS
- 9.2.1 REDUCING OPERATIONAL RISKS IN LINEAR ASSETS
- 9.2.1.1 Roads
- 9.2.1.2 Pipeline
- 9.2.1.3 Railways
- 9.2.1 REDUCING OPERATIONAL RISKS IN LINEAR ASSETS
- 9.3 PRODUCTION EQUIPMENT
- 9.3.1 PREDICTIVE MAINTENANCE FOR INDUSTRIAL MACHINERY
- 9.3.1.1 Turbines
- 9.3.1.2 Rotary pumps
- 9.3.1.3 Compressors
- 9.3.1 PREDICTIVE MAINTENANCE FOR INDUSTRIAL MACHINERY
- 9.4 FLEET & MOBILE ASSETS
- 9.4.1 FUEL AND COST OPTIMIZATION FOR FLEET MANAGEMENT
- 9.4.1.1 Vehicles
- 9.4.1.2 Trucks
- 9.4.1.3 Aircraft
- 9.4.1 FUEL AND COST OPTIMIZATION FOR FLEET MANAGEMENT
- 9.5 FIXED/FACILITY ASSETS/INFRASTRUCTURE
- 9.5.1 EXTENDING LIFESPAN OF FIXED ASSETS
- 9.5.1.1 Buildings
- 9.5.1.2 Plants
- 9.5.1.3 Warehouses
- 9.5.1 EXTENDING LIFESPAN OF FIXED ASSETS
- 9.6 OTHER ASSETS
10 ENTERPRISE ASSET MANAGEMENT MARKET, BY ORGANIZATION SIZE(MARKET SIZE & FORECAST TO 2030 - IN VALUE (USD MILLION))
- 10.1 INTRODUCTION
- 10.1.1 ORGANIZATION SIZE: ENTERPRISE ASSET MANAGEMENT MARKET DRIVERS
- 10.2 LARGE ENTERPRISES
- 10.2.1 EAM REDUCING DOWNTIME & OPERATIONAL DISRUPTIONS FOR LARGE ENTERPRISES
- 10.3 SMALL & MEDIUM ENTERPRISES
- 10.3.1 USER-FRIENDLY EAM TOOLS FOR RESOURCE-LIMITED TEAMS
11 ENTERPRISE ASSET MANAGEMENT MARKET, BY VERTICAL(MARKET SIZE & FORECAST TO 2030 - IN VALUE (USD MILLION))
- 11.1 INTRODUCTION
- 11.1.1 VERTICALS: ENTERPRISE ASSET MANAGEMENT MARKET DRIVERS
- 11.2 MANUFACTURING
- 11.2.1 OPTIMIZE PRODUCTION EQUIPMENT PERFORMANCE
- 11.2.2 MANUFACTURING: USE CASES
- 11.2.2.1 Predictive maintenance for CNC machines
- 11.2.2.2 Real-time monitoring of production line
- 11.2.2.3 Managing inventory of critical spare parts
- 11.3 ENERGY & UTILITIES
- 11.3.1 OPTIMIZE ENERGY GENERATION AND DISTRIBUTION
- 11.3.2 ENERGY & UTILITIES: USE CASE
- 11.3.2.1 Transformer maintenance
- 11.3.2.2 Energy usage tracking
- 11.3.2.3 Grid monitoring
- 11.4 OIL & GAS
- 11.4.1 MINIMIZED UNPLANNED DOWNTIME WITH EAM
- 11.4.2 OIL & GAS: USE CASES
- 11.4.2.1 Regulatory compliance
- 11.4.2.2 Rig maintenance
- 11.4.2.3 Pipeline monitoring
- 11.5 TRANSPORTATION & LOGISTICS
- 11.5.1 IMPLEMENT PREDICTIVE VEHICLE MAINTENANCE
- 11.5.2 TRANSPORTATION & LOGISTICS: USE CASES
- 11.5.2.1 Fleet maintenance
- 11.5.2.2 Route optimization
- 11.5.2.3 Vehicle tracking
- 11.6 HEALTHCARE & LIFE SCIENCES
- 11.6.1 BETTER INSIGHTS, REDUCED COSTS, AND ENHANCED MANAGEMENT OF MEDICAL SUPPLIES
- 11.6.2 HEALTHCARE & LIFE SCIENCES: USE CASES
- 11.6.2.1 Device maintenance
- 11.6.2.2 Lab asset management
- 11.6.2.3 Facility asset tracking
- 11.7 GOVERNMENT & PUBLIC SECTOR
- 11.7.1 BETTER MONITORING OF PUBLIC INFRASTRUCTURE ASSETS
- 11.7.2 GOVERNMENT & PUBLIC SECTOR: USE CASES
- 11.7.2.1 Infrastructure monitoring
- 11.7.2.2 Public equipment tracking
- 11.7.2.3 Energy consumption monitoring
- 11.8 OTHER VERTICALS
12 ENTERPRISE ASSET MANAGEMENT MARKET, BY REGION
- 12.1 INTRODUCTION
- 12.2 NORTH AMERICA
- 12.2.1 NORTH AMERICA: MACROECONOMIC OUTLOOK
- 12.2.2 NORTH AMERICA: ENTERPRISE ASSET MANAGEMENT MARKET DRIVERS
- 12.2.3 US
- 12.2.3.1 EAM Implementation for Long Island Railroad
- 12.2.4 CANADA
- 12.2.4.1 EAM solutions supporting operational efficiency in Canada
- 12.3 EUROPE
- 12.3.1 EUROPE: ENTERPRISE ASSET MANAGEMENT MARKET DRIVERS
- 12.3.2 EUROPE: MACROECONOMIC OUTLOOK
- 12.3.3 UK
- 12.3.3.1 Rising demand for EAM solutions across UK asset-intensive industries
- 12.3.4 GERMANY
- 12.3.4.1 Innovations shaping EAM solutions in Germany
- 12.3.5 FRANCE
- 12.3.5.1 Digital transformation fuels EAM adoption in France
- 12.3.6 ITALY
- 12.3.6.1 Government incentives accelerating EAM implementation
- 12.3.7 REST OF EUROPE
- 12.4 ASIA PACIFIC
- 12.4.1 ASIA PACIFIC: ENTERPRISE ASSET MANAGEMENT MARKET DRIVERS
- 12.4.2 ASIA PACIFIC: MACROECONOMIC OUTLOOK
- 12.4.3 CHINA
- 12.4.3.1 Baker Hughes and Sinochem lead enterprise-level EAM deployment
- 12.4.4 JAPAN
- 12.4.4.1 ServiceNow enhancing EAM solutions in Japan
- 12.4.5 AUSTRALIA & NEW ZEALAND
- 12.4.5.1 Government initiatives shaping EAM growth in Australia and New Zealand
- 12.4.6 REST OF ASIA PACIFIC
- 12.5 MIDDLE EAST & AFRICA
- 12.5.1 MIDDLE EAST & AFRICA: ENTERPRISE ASSET MANAGEMENT MARKET DRIVERS
- 12.5.2 MIDDLE EAST & AFRICA: MACROECONOMIC OUTLOOK
- 12.5.3 GCC COUNTRIES
- 12.5.3.1 UAE
- 12.5.3.1.1 Strengthening industrial resilience via enterprise asset management
- 12.5.3.2 Saudi Arabia
- 12.5.3.2.1 Vision 2030 raises need for EAM solutions
- 12.5.3.3 Rest of GCC Countries
- 12.5.3.1 UAE
- 12.5.4 SOUTH AFRICA
- 12.5.4.1 Local and global EAM solutions powering South Africa's growth
- 12.5.5 REST OF MIDDLE EAST & AFRICA
- 12.6 LATIN AMERICA
- 12.6.1 LATIN AMERICA: ENTERPRISE ASSET MANAGEMENT MARKET DRIVERS
- 12.6.2 LATIN AMERICA: MACROECONOMIC OUTLOOK
- 12.6.3 BRAZIL
- 12.6.3.1 Supporting industrial modernization with EAM solutions in Brazil
- 12.6.4 MEXICO
- 12.6.4.1 Reducing operational downtime with predictive maintenance in Mexico
- 12.6.5 REST OF LATIN AMERICA
13 COMPETITIVE LANDSCAPE
- 13.1 INTRODUCTION
- 13.2 KEY PLAYER STRATEGIES/RIGHT TO WIN
- 13.3 REVENUE ANALYSIS, 2020-2024
- 13.4 MARKET SHARE ANALYSIS
- 13.5 BRAND/PRODUCT COMPARISON
- 13.6 COMPANY EVALUATION MATRIX: KEY PLAYERS, 2024
- 13.6.1 STARS
- 13.6.2 EMERGING LEADERS
- 13.6.3 PERVASIVE PLAYERS
- 13.6.4 PARTICIPANTS
- 13.6.5 COMPANY FOOTPRINT: KEY PLAYERS, 2024
- 13.6.5.1 Company footprint
- 13.6.5.2 Region footprint
- 13.6.5.3 Offering footprint
- 13.6.5.4 Application footprint
- 13.6.5.5 Deployment type footprint
- 13.6.5.6 Organization size footprint
- 13.6.5.7 Vertical footprint
- 13.7 COMPANY EVALUATION MATRIX: STARTUPS/SMES, 2024
- 13.7.1 PROGRESSIVE COMPANIES
- 13.7.2 RESPONSIVE COMPANIES
- 13.7.3 DYNAMIC COMPANIES
- 13.7.4 STARTING BLOCKS
- 13.7.5 COMPETITIVE BENCHMARKING: STARTUPS/SMES, 2024
- 13.7.5.1 Detailed list of key startups/SMEs
- 13.7.5.2 Competitive benchmarking of startups/SMEs
- 13.8 COMPANY VALUATION AND FINANCIAL METRICS
- 13.8.1 COMPANY VALUATION
- 13.8.2 FINANCIAL METRICS
- 13.9 COMPETITIVE SCENARIO
- 13.9.1 PRODUCT LAUNCHES
- 13.9.2 DEALS
14 COMPANY PROFILES
- 14.1 INTRODUCTION
- 14.2 KEY PLAYERS
- 14.2.1 IBM
- 14.2.1.1 Business overview
- 14.2.1.2 Products/Solutions/Services offered
- 14.2.1.3 Recent developments
- 14.2.1.3.1 Product enhancements
- 14.2.1.3.2 Deals
- 14.2.1.4 MnM view
- 14.2.1.4.1 Right to win
- 14.2.1.4.2 Strategic choices
- 14.2.1.4.3 Weaknesses and competitive threats
- 14.2.2 SAP
- 14.2.2.1 Business overview
- 14.2.2.2 Products/Solutions/Services offered
- 14.2.2.3 MnM view
- 14.2.2.3.1 Right to win
- 14.2.2.3.2 Strategic choices
- 14.2.2.3.3 Weaknesses and competitive threats
- 14.2.3 ORACLE
- 14.2.3.1 Business overview
- 14.2.3.2 Products/Solutions/Services offered
- 14.2.3.3 MnM view
- 14.2.3.3.1 Right to win
- 14.2.3.3.2 Strategic choices
- 14.2.3.3.3 Weaknesses and competitive threats
- 14.2.4 IFS
- 14.2.4.1 Business overview
- 14.2.4.2 Products/Solutions/Services offered
- 14.2.4.3 Recent developments
- 14.2.4.3.1 Deals
- 14.2.4.4 MnM view
- 14.2.4.4.1 Right to win
- 14.2.4.4.2 Strategic choices
- 14.2.4.4.3 Weaknesses and competitive threats
- 14.2.5 HEXAGON AB
- 14.2.5.1 Business overview
- 14.2.5.2 Products/Solutions/Services offered
- 14.2.5.3 Recent developments
- 14.2.5.3.1 Product launches & enhancements
- 14.2.5.3.2 Deals
- 14.2.5.4 MnM view
- 14.2.5.4.1 Right to win
- 14.2.5.4.2 Strategic choices
- 14.2.5.4.3 Weaknesses and competitive threats
- 14.2.6 TRIMBLE
- 14.2.6.1 Business overview
- 14.2.6.2 Products/Solutions/Services offered
- 14.2.6.3 Recent developments
- 14.2.6.3.1 Product launches
- 14.2.6.3.2 Deals
- 14.2.7 APTEAN
- 14.2.7.1 Business overview
- 14.2.7.2 Products/Solutions/Services offered
- 14.2.7.3 Recent developments
- 14.2.7.3.1 Deals
- 14.2.8 SERVICENOW
- 14.2.8.1 Business overview
- 14.2.8.2 Products/Solutions/Services offered
- 14.2.8.2.1 Product enhancements
- 14.2.8.2.2 Deals
- 14.2.9 HITACHI ENERGY
- 14.2.9.1 Business overview
- 14.2.9.2 Products/Solutions/Services offered
- 14.2.10 RAMCO
- 14.2.10.1 Business overview
- 14.2.10.2 Products/Solutions/Services offered
- 14.2.1 IBM
- 14.3 OTHER PLAYERS
- 14.3.1 ACCRUENT
- 14.3.2 MAINTAINX
- 14.3.3 EMAINT
- 14.3.4 LLUMIN
- 14.3.5 CENTRALSQUARE
- 14.3.6 ABS GROUP
- 14.3.7 UPKEEP
- 14.3.8 ASSETWORKS
- 14.3.9 ASSET PANDA
- 14.3.10 ASSET INFINITY
- 14.3.11 EZMAINTAIN
- 14.3.12 KLOUDGIN
- 14.3.13 LIMBLE CMMS
- 14.3.14 IPS INTELLIGENT PROCESS SOLUTION
- 14.3.15 EPROMIS SOLUTIONS
15 ADJACENT/RELATED MARKETS
- 15.1 INTRODUCTION
- 15.2 RELATED MARKETS
- 15.3 LIMITATIONS
- 15.4 HUMAN CAPITAL MANAGEMENT
- 15.5 WORKFORCE MANAGEMENT
16 APPENDIX
- 16.1 DISCUSSION GUIDE
- 16.2 KNOWLEDGESTORE: MARKETSANDMARKETS' SUBSCRIPTION PORTAL
- 16.3 CUSTOMIZATION OPTIONS
- 16.4 RELATED REPORTS
- 16.5 AUTHOR DETAILS
List of Tables
- TABLE 1 USD EXCHANGE RATES, 2019-2024
- TABLE 2 FACTOR ANALYSIS
- TABLE 3 ENTERPRISE ASSET MANAGEMENT MARKET SIZE AND GROWTH, 2020-2024 (USD MILLION, YOY GROWTH)
- TABLE 4 ENTERPRISE ASSET MANAGEMENT MARKET SIZE AND GROWTH, 2025-2030 (USD MILLION, YOY GROWTH)
- TABLE 5 ENTERPRISE ASSET MANAGEMENT MARKET: PORTER'S FIVE FORCES ANALYSIS
- TABLE 6 INFLUENCE OF STAKEHOLDERS ON BUYING PROCESS FOR TOP THREE VERTICALS
- TABLE 7 KEY BUYING CRITERIA FOR THE TOP THREE VERTICALS
- TABLE 8 NORTH AMERICA: REGULATORY BODIES, GOVERNMENT AGENCIES, AND OTHER ORGANIZATIONS
- TABLE 9 EUROPE: REGULATORY BODIES, GOVERNMENT AGENCIES, AND OTHER ORGANIZATIONS
- TABLE 10 ASIA PACIFIC: REGULATORY BODIES, GOVERNMENT AGENCIES, AND OTHER ORGANIZATIONS
- TABLE 11 REST OF THE WORLD: REGULATORY BODIES, GOVERNMENT AGENCIES, AND OTHER ORGANIZATIONS
- TABLE 12 INDICATIVE PRICING OF EAM SOFTWARE SOLUTIONS, BY KEY PLAYER, 2024
- TABLE 13 LIST OF MAJOR PATENTS
- TABLE 14 ENTERPRISE ASSET MANAGEMENT MARKET: KEY CONFERENCES AND EVENTS IN 2025-2026
- TABLE 15 ENTERPRISE ASSET MANAGEMENT MARKET, BY OFFERING, 2020-2024 (USD MILLION)
- TABLE 16 ENTERPRISE ASSET MANAGEMENT MARKET, BY OFFERING, 2025-2030 (USD MILLION)
- TABLE 17 ENTERPRISE ASSET MANAGEMENT SOLUTIONS MARKET, BY REGION, 2020-2024 (USD MILLION)
- TABLE 18 ENTERPRISE ASSET MANAGEMENT SOLUTIONS MARKET, BY REGION, 2025-2030 (USD MILLION)
- TABLE 19 ENTERPRISE ASSET MANAGEMENT SERVICES MARKET, BY TYPE, 2020-2024 (USD MILLION)
- TABLE 20 ENTERPRISE ASSET MANAGEMENT SERVICES MARKET, BY TYPE, 2025-2030 (USD MILLION)
- TABLE 21 ENTERPRISE ASSET MANAGEMENT SERVICES MARKET, BY REGION, 2020-2024 (USD MILLION)
- TABLE 22 ENTERPRISE ASSET MANAGEMENT SERVICES MARKET, BY REGION, 2025-2030 (USD MILLION)
- TABLE 23 TRAINING & CONSULTING SERVICES MARKET, BY REGION, 2020-2024 (USD MILLION)
- TABLE 24 TRAINING & CONSULTING SERVICES MARKET, BY REGION, 2025-2030 (USD MILLION)
- TABLE 25 DEPLOYMENT & INTEGRATION SERVICES MARKET, BY REGION, 2020-2024 (USD MILLION)
- TABLE 26 DEPLOYMENT & INTEGRATION SERVICES MARKET, BY REGION, 2025-2030 (USD MILLION)
- TABLE 27 SUPPORT & MAINTENANCE SERVICES MARKET, BY REGION, 2020-2024 (USD MILLION)
- TABLE 28 SUPPORT & MAINTENANCE SERVICES MARKET, BY REGION, 2025-2030 (USD MILLION)
- TABLE 29 ENTERPRISE ASSET MANAGEMENT MARKET, BY APPLICATION, 2020-2024 (USD MILLION)
- TABLE 30 ENTERPRISE ASSET MANAGEMENT MARKET, BY APPLICATION, 2025-2030 (USD MILLION)
- TABLE 31 ASSET LIFECYCLE MANAGEMENT: ENTERPRISE ASSET MANAGEMENT MARKET, BY REGION, 2020-2024 (USD MILLION)
- TABLE 32 ASSET LIFECYCLE MANAGEMENT: ENTERPRISE ASSET MANAGEMENT MARKET, BY REGION, 2025-2030 (USD MILLION)
- TABLE 33 OPERATION MANAGEMENT: ENTERPRISE ASSET MANAGEMENT MARKET, BY REGION, 2020-2024 (USD MILLION)
- TABLE 34 OPERATION MANAGEMENT: ENTERPRISE ASSET MANAGEMENT MARKET, BY REGION, 2025-2030 (USD MILLION)
- TABLE 35 MAINTENANCE MANAGEMENT: ENTERPRISE ASSET MANAGEMENT MARKET, BY REGION, 2020-2024 (USD MILLION)
- TABLE 36 MAINTENANCE MANAGEMENT: ENTERPRISE ASSET MANAGEMENT, BY REGION, 2025-2030 (USD MILLION)
- TABLE 37 COMPLIANCE & SAFETY: ENTERPRISE ASSET MANAGEMENT MARKET, BY REGION, 2020-2024 (USD MILLION)
- TABLE 38 COMPLIANCE & SAFETY: ENTERPRISE ASSET MANAGEMENT MARKET, BY REGION, 2025-2030 (USD MILLION)
- TABLE 39 REPORT & ANALYTICS: ENTERPRISE ASSET MANAGEMENT MARKET, BY REGION, 2020-2024 (USD MILLION)
- TABLE 40 REPORT & ANALYTICS: ENTERPRISE ASSET MANAGEMENT MARKET, BY REGION, 2025-2030 (USD MILLION)
- TABLE 41 OTHER APPLICATIONS: ENTERPRISE ASSET MANAGEMENT MARKET, BY REGION, 2020-2024 (USD MILLION)
- TABLE 42 OTHER APPLICATIONS: ENTERPRISE ASSET MANAGEMENT MARKET, BY REGION, 2025-2030 (USD MILLION)
- TABLE 43 ENTERPRISE ASSET MANAGEMENT MARKET, BY DEPLOYMENT TYPE, 2020-2024 (USD MILLION)
- TABLE 44 ENTERPRISE ASSET MANAGEMENT MARKET, BY DEPLOYMENT TYPE, 2025-2030 (USD MILLION)
- TABLE 45 CLOUD: ENTERPRISE ASSET MANAGEMENT MARKET, BY REGION, 2020-2024 (USD MILLION)
- TABLE 46 CLOUD: ENTERPRISE ASSET MANAGEMENT MARKET, BY REGION, 2025-2030 (USD MILLION)
- TABLE 47 ON-PREMISES: ENTERPRISE ASSET MANAGEMENT MARKET, BY REGION, 2020-2024 (USD MILLION)
- TABLE 48 ON-PREMISES: ENTERPRISE ASSET MANAGEMENT MARKET, BY REGION, 2025-2030 (USD MILLION)
- TABLE 49 ENTERPRISE ASSET MANAGEMENT MARKET, BY ASSET CLASS, 2020-2024 (USD MILLION)
- TABLE 50 ENTERPRISE ASSET MANAGEMENT MARKET, BY ASSET CLASS, 2025-2030 (USD MILLION)
- TABLE 51 LINEAR ASSETS: ENTERPRISE ASSET MANAGEMENT MARKET, BY REGION, 2020-2024 (USD MILLION)
- TABLE 52 LINEAR ASSETS: ENTERPRISE ASSET MANAGEMENT MARKET, BY REGION, 2025-2030 (USD MILLION)
- TABLE 53 PRODUCTION EQUIPMENT: ENTERPRISE ASSET MANAGEMENT MARKET, BY REGION, 2020-2024 (USD MILLION)
- TABLE 54 PRODUCTION EQUIPMENT: ENTERPRISE ASSET MANAGEMENT MARKET, BY REGION, 2025-2030 (USD MILLION)
- TABLE 55 FLEET & MOBILE ASSETS: ENTERPRISE ASSET MANAGEMENT MARKET, BY REGION, 2020-2024 (USD MILLION)
- TABLE 56 FLEET & MOBILE ASSETS: ENTERPRISE ASSET MANAGEMENT MARKET, BY REGION, 2025-2030 (USD MILLION)
- TABLE 57 FIXED/FACILITY ASSETS/INFRASTRUCTURE: ENTERPRISE ASSET MANAGEMENT MARKET, BY REGION, 2020-2024 (USD MILLION)
- TABLE 58 FIXED/FACILITY ASSETS/INFRASTRUCTURE: ENTERPRISE ASSET MANAGEMENT MARKET, BY REGION, 2025-2030 (USD MILLION)
- TABLE 59 OTHER ASSETS: ENTERPRISE ASSET MANAGEMENT MARKET, BY REGION, 2020-2024 (USD MILLION)
- TABLE 60 OTHER ASSETS: ENTERPRISE ASSET MANAGEMENT MARKET, BY REGION, 2025-2030 (USD MILLION)
- TABLE 61 ENTERPRISE ASSET MANAGEMENT MARKET, BY ORGANIZATION SIZE, 2020-2024 (USD MILLION)
- TABLE 62 ENTERPRISE ASSET MANAGEMENT MARKET, BY ORGANIZATION SIZE, 2025-2030 (USD MILLION)
- TABLE 63 LARGE ENTERPRISES: ENTERPRISE ASSET MANAGEMENT MARKET, BY REGION, 2020-2024 (USD MILLION)
- TABLE 64 LARGE ENTERPRISES: ENTERPRISE ASSET MANAGEMENT MARKET, BY REGION, 2025-2030 (USD MILLION)
- TABLE 65 SMALL & MEDIUM-SIZED ENTERPRISES: ENTERPRISE ASSET MANAGEMENT MARKET, BY REGION, 2020-2024 (USD MILLION)
- TABLE 66 SMALL & MEDIUM-SIZED ENTERPRISES: ENTERPRISE ASSET MANAGEMENT MARKET, BY REGION, 2025-2030 (USD MILLION)
- TABLE 67 ENTERPRISE ASSET MANAGEMENT MARKET, BY VERTICAL, 2020-2024 (USD MILLION)
- TABLE 68 ENTERPRISE ASSET MANAGEMENT MARKET, BY VERTICAL, 2025-2030 (USD MILLION)
- TABLE 69 MANUFACTURING: ENTERPRISE ASSET MANAGEMENT MARKET, BY REGION, 2020-2024 (USD MILLION)
- TABLE 70 MANUFACTURING: ENTERPRISE ASSET MANAGEMENT MARKET, BY REGION, 2025-2030 (USD MILLION)
- TABLE 71 ENERGY & UTILITIES: ENTERPRISE ASSET MANAGEMENT MARKET, BY REGION, 2020-2024 (USD MILLION)
- TABLE 72 ENERGY & UTILITIES: ENTERPRISE ASSET MANAGEMENT MARKET, BY REGION, 2025-2030 (USD MILLION)
- TABLE 73 OIL & GAS: ENTERPRISE ASSET MANAGEMENT MARKET, BY REGION, 2020-2024 (USD MILLION)
- TABLE 74 OIL & GAS: ENTERPRISE ASSET MANAGEMENT MARKET, BY REGION, 2025-2030 (USD MILLION)
- TABLE 75 TRANSPORTATION & LOGISTICS: ENTERPRISE ASSET MANAGEMENT MARKET, BY REGION, 2020-2024 (USD MILLION)
- TABLE 76 TRANSPORTATION & LOGISTICS: ENTERPRISE ASSET MANAGEMENT MARKET, BY REGION, 2025-2030 (USD MILLION)
- TABLE 77 HEALTHCARE & LIFE SCIENCES: ENTERPRISE ASSET MANAGEMENT MARKET, BY REGION, 2020-2024 (USD MILLION)
- TABLE 78 HEALTHCARE & LIFE SCIENCES: ENTERPRISE ASSET MANAGEMENT MARKET, BY REGION, 2025-2030 (USD MILLION)
- TABLE 79 GOVERNMENT & PUBLIC SECTOR: ENTERPRISE ASSET MANAGEMENT MARKET, BY REGION, 2020-2024 (USD MILLION)
- TABLE 80 GOVERNMENT & PUBLIC SECTOR: ENTERPRISE ASSET MANAGEMENT MARKET, BY REGION, 2025-2030 (USD MILLION)
- TABLE 81 OTHER VERTICALS: ENTERPRISE ASSET MANAGEMENT MARKET, BY REGION, 2020-2024 (USD MILLION)
- TABLE 82 OTHER VERTICALS: ENTERPRISE ASSET MANAGEMENT MARKET, BY REGION, 2025-2030 (USD MILLION)
- TABLE 83 ENTERPRISE ASSET MANAGEMENT MARKET, BY REGION, 2020-2024 (USD MILLION)
- TABLE 84 ENTERPRISE ASSET MANAGEMENT MARKET, BY REGION, 2025-2030 (USD MILLION)
- TABLE 85 NORTH AMERICA: ENTERPRISE ASSET MANAGEMENT MARKET, BY OFFERING, 2020-2024 (USD MILLION)
- TABLE 86 NORTH AMERICA: ENTERPRISE ASSET MANAGEMENT MARKET, BY OFFERING, 2025-2030 (USD MILLION)
- TABLE 87 NORTH AMERICA: ENTERPRISE ASSET MANAGEMENT SERVICES MARKET, BY TYPE, 2020-2024 (USD MILLION)
- TABLE 88 NORTH AMERICA: ENTERPRISE ASSET MANAGEMENT SERVICES MARKET, BY TYPE, 2025-2030 (USD MILLION)
- TABLE 89 NORTH AMERICA: ENTERPRISE ASSET MANAGEMENT MARKET, BY APPLICATION, 2020-2024 (USD MILLION)
- TABLE 90 NORTH AMERICA: ENTERPRISE ASSET MANAGEMENT MARKET, BY APPLICATION, 2025-2030 (USD MILLION)
- TABLE 91 NORTH AMERICA: ENTERPRISE ASSET MANAGEMENT MARKET, BY DEPLOYMENT TYPE, 2020-2024 (USD MILLION)
- TABLE 92 NORTH AMERICA: ENTERPRISE ASSET MANAGEMENT MARKET, BY DEPLOYMENT TYPE, 2025-2030 (USD MILLION)
- TABLE 93 NORTH AMERICA: ENTERPRISE ASSET MANAGEMENT MARKET, BY ASSET CLASS, 2020-2024 (USD MILLION)
- TABLE 94 NORTH AMERICA: ENTERPRISE ASSET MANAGEMENT MARKET, BY ASSET CLASS, 2025-2030 (USD MILLION)
- TABLE 95 NORTH AMERICA: ENTERPRISE ASSET MANAGEMENT MARKET, BY ORGANIZATION SIZE, 2020-2024 (USD MILLION)
- TABLE 96 NORTH AMERICA: ENTERPRISE ASSET MANAGEMENT MARKET, BY ORGANIZATION SIZE, 2025-2030 (USD MILLION)
- TABLE 97 NORTH AMERICA: ENTERPRISE ASSET MANAGEMENT MARKET, BY VERTICAL, 2020-2024 (USD MILLION)
- TABLE 98 NORTH AMERICA: ENTERPRISE ASSET MANAGEMENT MARKET, BY VERTICAL, 2025-2030 (USD MILLION)
- TABLE 99 NORTH AMERICA: ENTERPRISE ASSET MANAGEMENT MARKET, BY COUNTRY, 2020-2024 (USD MILLION)
- TABLE 100 NORTH AMERICA: ENTERPRISE ASSET MANAGEMENT MARKET, BY COUNTRY, 2025-2030 (USD MILLION)
- TABLE 101 US: ENTERPRISE ASSET MANAGEMENT MARKET, BY OFFERING, 2020-2024 (USD MILLION)
- TABLE 102 US: ENTERPRISE ASSET MANAGEMENT MARKET, BY OFFERING, 2025-2030 (USD MILLION)
- TABLE 103 CANADA: ENTERPRISE ASSET MANAGEMENT MARKET, BY OFFERING, 2020-2024 (USD MILLION)
- TABLE 104 CANADA: ENTERPRISE ASSET MANAGEMENT MARKET, BY OFFERING, 2025-2030 (USD MILLION)
- TABLE 105 EUROPE: ENTERPRISE ASSET MANAGEMENT MARKET, BY OFFERING, 2020-2024 (USD MILLION)
- TABLE 106 EUROPE: ENTERPRISE ASSET MANAGEMENT MARKET, BY OFFERING, 2025-2030 (USD MILLION)
- TABLE 107 EUROPE: ENTERPRISE ASSET MANAGEMENT SERVICES MARKET, BY TYPE, 2020-2024 (USD MILLION)
- TABLE 108 EUROPE: ENTERPRISE ASSET MANAGEMENT SERVICES MARKET, BY TYPE, 2025-2030 (USD MILLION)
- TABLE 109 EUROPE: ENTERPRISE ASSET MANAGEMENT MARKET, BY APPLICATION, 2020-2024 (USD MILLION)
- TABLE 110 EUROPE: ENTERPRISE ASSET MANAGEMENT MARKET, BY APPLICATION, 2025-2030 (USD MILLION)
- TABLE 111 EUROPE: ENTERPRISE ASSET MANAGEMENT MARKET, BY DEPLOYMENT TYPE, 2020-2024 (USD MILLION)
- TABLE 112 EUROPE: ENTERPRISE ASSET MANAGEMENT MARKET, BY DEPLOYMENT TYPE, 2025-2030 (USD MILLION)
- TABLE 113 EUROPE: ENTERPRISE ASSET MANAGEMENT MARKET, BY ASSET CLASS, 2020-2024 (USD MILLION)
- TABLE 114 EUROPE: ENTERPRISE ASSET MANAGEMENT MARKET, BY ASSET CLASS, 2025-2030 (USD MILLION)
- TABLE 115 EUROPE: ENTERPRISE ASSET MANAGEMENT MARKET, BY ORGANIZATION SIZE, 2020-2024 (USD MILLION)
- TABLE 116 EUROPE: ENTERPRISE ASSET MANAGEMENT MARKET, BY ORGANIZATION SIZE, 2025-2030 (USD MILLION)
- TABLE 117 EUROPE: ENTERPRISE ASSET MANAGEMENT MARKET, BY VERTICAL, 2020-2024 (USD MILLION)
- TABLE 118 EUROPE: ENTERPRISE ASSET MANAGEMENT MARKET, BY VERTICAL, 2025-2030 (USD MILLION)
- TABLE 119 EUROPE: ENTERPRISE ASSET MANAGEMENT MARKET, BY COUNTRY, 2020-2024 (USD MILLION)
- TABLE 120 EUROPE: ENTERPRISE ASSET MANAGEMENT MARKET, BY COUNTRY, 2025-2030 (USD MILLION)
- TABLE 121 UK: ENTERPRISE ASSET MANAGEMENT MARKET, BY OFFERING, 2020-2024 (USD MILLION)
- TABLE 122 UK: ENTERPRISE ASSET MANAGEMENT MARKET, BY OFFERING, 2025-2030 (USD MILLION)
- TABLE 123 GERMANY: ENTERPRISE ASSET MANAGEMENT MARKET, BY OFFERING, 2020-2024 (USD MILLION)
- TABLE 124 GERMANY: ENTERPRISE ASSET MANAGEMENT MARKET, BY OFFERING, 2025-2030 (USD MILLION)
- TABLE 125 FRANCE: ENTERPRISE ASSET MANAGEMENT MARKET, BY OFFERING, 2020-2024 (USD MILLION)
- TABLE 126 FRANCE: ENTERPRISE ASSET MANAGEMENT MARKET, BY OFFERING, 2025-2030 (USD MILLION)
- TABLE 127 ITALY: ENTERPRISE ASSET MANAGEMENT MARKET, BY OFFERING, 2020-2024 (USD MILLION)
- TABLE 128 ITALY: ENTERPRISE ASSET MANAGEMENT MARKET, BY OFFERING, 2025-2030 (USD MILLION)
- TABLE 129 REST OF EUROPE: ENTERPRISE ASSET MANAGEMENT MARKET, BY OFFERING, 2020-2024 (USD MILLION)
- TABLE 130 REST OF EUROPE: ENTERPRISE ASSET MANAGEMENT MARKET, BY OFFERING, 2025-2030 (USD MILLION)
- TABLE 131 ASIA PACIFIC: ENTERPRISE ASSET MANAGEMENT MARKET, BY OFFERING, 2020-2024 (USD MILLION)
- TABLE 132 ASIA PACIFIC: ENTERPRISE ASSET MANAGEMENT MARKET, BY OFFERING, 2025-2030 (USD MILLION)
- TABLE 133 ASIA PACIFIC: ENTERPRISE ASSET MANAGEMENT SERVICES MARKET, BY TYPE, 2020-2024 (USD MILLION)
- TABLE 134 ASIA PACIFIC: ENTERPRISE ASSET MANAGEMENT SERVICES MARKET, BY TYPE, 2025-2030 (USD MILLION)
- TABLE 135 ASIA PACIFIC: ENTERPRISE ASSET MANAGEMENT MARKET, BY APPLICATION, 2020-2024 (USD MILLION)
- TABLE 136 ASIA PACIFIC: ENTERPRISE ASSET MANAGEMENT MARKET, BY APPLICATION, 2025-2030 (USD MILLION)
- TABLE 137 ASIA PACIFIC: ENTERPRISE ASSET MANAGEMENT MARKET, BY DEPLOYMENT TYPE, 2020-2024 (USD MILLION)
- TABLE 138 ASIA PACIFIC: ENTERPRISE ASSET MANAGEMENT MARKET, BY DEPLOYMENT TYPE, 2025-2030 (USD MILLION)
- TABLE 139 ASIA PACIFIC: ENTERPRISE ASSET MANAGEMENT MARKET, BY ASSET CLASS, 2020-2024 (USD MILLION)
- TABLE 140 ASIA PACIFIC: ENTERPRISE ASSET MANAGEMENT MARKET, BY ASSET CLASS, 2025-2030 (USD MILLION)
- TABLE 141 ASIA PACIFIC: ENTERPRISE ASSET MANAGEMENT MARKET, BY ORGANIZATION SIZE, 2020-2024 (USD MILLION)
- TABLE 142 ASIA PACIFIC: ENTERPRISE ASSET MANAGEMENT MARKET, BY ORGANIZATION SIZE, 2025-2030 (USD MILLION)
- TABLE 143 ASIA PACIFIC: ENTERPRISE ASSET MANAGEMENT MARKET, BY VERTICAL, 2020-2024 (USD MILLION)
- TABLE 144 ASIA PACIFIC: ENTERPRISE ASSET MANAGEMENT MARKET, BY VERTICAL, 2025-2030 (USD MILLION)
- TABLE 145 ASIA PACIFIC: ENTERPRISE ASSET MANAGEMENT MARKET, BY COUNTRY, 2020-2024 (USD MILLION)
- TABLE 146 ASIA PACIFIC: ENTERPRISE ASSET MANAGEMENT MARKET, BY COUNTRY, 2025-2030 (USD MILLION)
- TABLE 147 CHINA: ENTERPRISE ASSET MANAGEMENT MARKET, BY OFFERING, 2020-2024 (USD MILLION)
- TABLE 148 CHINA: ENTERPRISE ASSET MANAGEMENT MARKET, BY OFFERING, 2025-2030 (USD MILLION)
- TABLE 149 JAPAN: ENTERPRISE ASSET MANAGEMENT MARKET, BY OFFERING, 2020-2024 (USD MILLION)
- TABLE 150 JAPAN: ENTERPRISE ASSET MANAGEMENT MARKET, BY OFFERING, 2025-2030 (USD MILLION)
- TABLE 151 AUSTRALIA & NEW ZEALAND: ENTERPRISE ASSET MANAGEMENT MARKET, BY OFFERING, 2020-2024 (USD MILLION)
- TABLE 152 AUSTRALIA & NEW ZEALAND: ENTERPRISE ASSET MANAGEMENT MARKET, BY OFFERING, 2025-2030 (USD MILLION)
- TABLE 153 REST OF ASIA PACIFIC: ENTERPRISE ASSET MANAGEMENT MARKET, BY OFFERING, 2020-2024 (USD MILLION)
- TABLE 154 REST OF ASIA PACIFIC: ENTERPRISE ASSET MANAGEMENT MARKET, BY OFFERING, 2025-2030 (USD MILLION)
- TABLE 155 MIDDLE EAST & AFRICA: ENTERPRISE ASSET MANAGEMENT MARKET, BY OFFERING, 2020-2024 (USD MILLION)
- TABLE 156 MIDDLE EAST & AFRICA: ENTERPRISE ASSET MANAGEMENT MARKET, BY OFFERING, 2025-2030 (USD MILLION)
- TABLE 157 MIDDLE EAST & AFRICA: ENTERPRISE ASSET MANAGEMENT SERVICES MARKET, BY TYPE, 2020-2024 (USD MILLION)
- TABLE 158 MIDDLE EAST & AFRICA: ENTERPRISE ASSET MANAGEMENT SERVICES MARKET, BY TYPE, 2025-2030 (USD MILLION)
- TABLE 159 MIDDLE EAST & AFRICA: ENTERPRISE ASSET MANAGEMENT MARKET, BY APPLICATION, 2020-2024 (USD MILLION)
- TABLE 160 MIDDLE EAST & AFRICA: ENTERPRISE ASSET MANAGEMENT MARKET, BY APPLICATION, 2025-2030 (USD MILLION)
- TABLE 161 MIDDLE EAST & AFRICA: ENTERPRISE ASSET MANAGEMENT MARKET, BY DEPLOYMENT TYPE, 2020-2024 (USD MILLION)
- TABLE 162 MIDDLE EAST & AFRICA: ENTERPRISE ASSET MANAGEMENT MARKET, BY DEPLOYMENT TYPE, 2025-2030 (USD MILLION)
- TABLE 163 MIDDLE EAST & AFRICA: ENTERPRISE ASSET MANAGEMENT MARKET, BY ASSET CLASS, 2020-2024 (USD MILLION)
- TABLE 164 MIDDLE EAST & AFRICA: ENTERPRISE ASSET MANAGEMENT MARKET, BY ASSET CLASS, 2025-2030 (USD MILLION)
- TABLE 165 MIDDLE EAST & AFRICA: ENTERPRISE ASSET MANAGEMENT MARKET, BY ORGANIZATION SIZE, 2020-2024 (USD MILLION)
- TABLE 166 MIDDLE EAST & AFRICA: ENTERPRISE ASSET MANAGEMENT MARKET, BY ORGANIZATION SIZE, 2025-2030 (USD MILLION)
- TABLE 167 MIDDLE EAST & AFRICA: ENTERPRISE ASSET MANAGEMENT MARKET, BY VERTICAL, 2020-2024 (USD MILLION)
- TABLE 168 MIDDLE EAST & AFRICA: ENTERPRISE ASSET MANAGEMENT MARKET, BY VERTICAL, 2025-2030 (USD MILLION)
- TABLE 169 MIDDLE EAST & AFRICA: ENTERPRISE ASSET MANAGEMENT MARKET, BY COUNTRY, 2020-2024 (USD MILLION)
- TABLE 170 MIDDLE EAST & AFRICA: ENTERPRISE ASSET MANAGEMENT MARKET, BY COUNTRY, 2025-2030 (USD MILLION)
- TABLE 171 GCC COUNTRIES: ENTERPRISE ASSET MANAGEMENT MARKET, BY COUNTRY, 2020-2024 (USD MILLION)
- TABLE 172 GCC COUNTRIES: ENTERPRISE ASSET MANAGEMENT MARKET, BY COUNTRY, 2025-2030 (USD MILLION)
- TABLE 173 GCC COUNTRIES: ENTERPRISE ASSET MANAGEMENT MARKET, BY OFFERING, 2020-2024 (USD MILLION)
- TABLE 174 GCC COUNTRIES: ENTERPRISE ASSET MANAGEMENT MARKET, BY OFFERING, 2025-2030 (USD MILLION)
- TABLE 175 UAE: ENTERPRISE ASSET MANAGEMENT MARKET, BY OFFERING, 2020-2024 (USD MILLION)
- TABLE 176 UAE: ENTERPRISE ASSET MANAGEMENT MARKET, BY OFFERING, 2025-2030 (USD MILLION)
- TABLE 177 SAUDI ARABIA: ENTERPRISE ASSET MANAGEMENT MARKET, BY OFFERING, 2020-2024 (USD MILLION)
- TABLE 178 SAUDI ARABIA: ENTERPRISE ASSET MANAGEMENT MARKET, BY OFFERING, 2025-2030 (USD MILLION)
- TABLE 179 REST OF GCC COUNTRIES: ENTERPRISE ASSET MANAGEMENT MARKET, BY OFFERING, 2020-2024 (USD MILLION)
- TABLE 180 REST OF GCC COUNTRIES: ENTERPRISE ASSET MANAGEMENT MARKET, BY OFFERING, 2025-2030 (USD MILLION)
- TABLE 181 SOUTH AFRICA: ENTERPRISE ASSET MANAGEMENT MARKET, BY OFFERING, 2020-2024 (USD MILLION)
- TABLE 182 SOUTH AFRICA: ENTERPRISE ASSET MANAGEMENT MARKET, BY OFFERING, 2025-2030 (USD MILLION)
- TABLE 183 REST OF MIDDLE EAST & AFRICA: ENTERPRISE ASSET MANAGEMENT MARKET, BY OFFERING, 2020-2024 (USD MILLION)
- TABLE 184 REST OF MIDDLE EAST & AFRICA: ENTERPRISE ASSET MANAGEMENT MARKET, BY OFFERING, 2025-2030 (USD MILLION)
- TABLE 185 LATIN AMERICA: ENTERPRISE ASSET MANAGEMENT MARKET, BY OFFERING, 2020-2024 (USD MILLION)
- TABLE 186 LATIN AMERICA: ENTERPRISE ASSET MANAGEMENT MARKET, BY OFFERING, 2025-2030 (USD MILLION)
- TABLE 187 LATIN AMERICA: ENTERPRISE ASSET MANAGEMENT SERVICES MARKET, BY TYPE, 2020-2024 (USD MILLION)
- TABLE 188 LATIN AMERICA: ENTERPRISE ASSET MANAGEMENT SERVICES MARKET, BY TYPE, 2025-2030 (USD MILLION)
- TABLE 189 LATIN AMERICA: ENTERPRISE ASSET MANAGEMENT MARKET, BY APPLICATION, 2020-2024 (USD MILLION)
- TABLE 190 LATIN AMERICA: ENTERPRISE ASSET MANAGEMENT MARKET, BY APPLICATION, 2025-2030 (USD MILLION)
- TABLE 191 LATIN AMERICA: ENTERPRISE ASSET MANAGEMENT MARKET, BY DEPLOYMENT TYPE, 2020-2024 (USD MILLION)
- TABLE 192 LATIN AMERICA: ENTERPRISE ASSET MANAGEMENT MARKET, BY DEPLOYMENT TYPE, 2025-2030 (USD MILLION)
- TABLE 193 LATIN AMERICA: ENTERPRISE ASSET MANAGEMENT MARKET, BY ASSET CLASS, 2020-2024 (USD MILLION)
- TABLE 194 LATIN AMERICA: ENTERPRISE ASSET MANAGEMENT MARKET, BY ASSET CLASS, 2025-2030 (USD MILLION)
- TABLE 195 LATIN AMERICA: ENTERPRISE ASSET MANAGEMENT MARKET, BY ORGANIZATION SIZE, 2020-2024 (USD MILLION)
- TABLE 196 LATIN AMERICA: ENTERPRISE ASSET MANAGEMENT MARKET, BY ORGANIZATION SIZE, 2025-2030 (USD MILLION)
- TABLE 197 LATIN AMERICA: ENTERPRISE ASSET MANAGEMENT MARKET, BY VERTICAL, 2020-2024 (USD MILLION)
- TABLE 198 LATIN AMERICA: ENTERPRISE ASSET MANAGEMENT MARKET, BY VERTICAL, 2025-2030 (USD MILLION)
- TABLE 199 LATIN AMERICA: ENTERPRISE ASSET MANAGEMENT MARKET, BY COUNTRY, 2020-2024 (USD MILLION)
- TABLE 200 LATIN AMERICA: ENTERPRISE ASSET MANAGEMENT MARKET, BY COUNTRY, 2025-2030 (USD MILLION)
- TABLE 201 BRAZIL: ENTERPRISE ASSET MANAGEMENT MARKET, BY OFFERING, 2020-2024 (USD MILLION)
- TABLE 202 BRAZIL: ENTERPRISE ASSET MANAGEMENT MARKET, BY OFFERING, 2025-2030 (USD MILLION)
- TABLE 203 MEXICO: ENTERPRISE ASSET MANAGEMENT MARKET, BY OFFERING, 2020-2024 (USD MILLION)
- TABLE 204 MEXICO: ENTERPRISE ASSET MANAGEMENT MARKET, BY OFFERING, 2025-2030 (USD MILLION)
- TABLE 205 REST OF LATIN AMERICA: ENTERPRISE ASSET MANAGEMENT MARKET, BY OFFERING, 2020-2024 (USD MILLION)
- TABLE 206 REST OF LATIN AMERICA: ENTERPRISE ASSET MANAGEMENT MARKET, BY OFFERING, 2025-2030 (USD MILLION)
- TABLE 207 OVERVIEW OF STRATEGIES ADOPTED BY KEY PLAYERS IN ENTERPRISE ASSET MANAGEMENT MARKET, 2023-2025
- TABLE 208 ENTERPRISE ASSET MANAGEMENT MARKET: DEGREE OF COMPETITION, 2024
- TABLE 209 ENTERPRISE ASSET MANAGEMENT MARKET: REGION FOOTPRINT
- TABLE 210 ENTERPRISE ASSET MANAGEMENT MARKET: OFFERING FOOTPRINT
- TABLE 211 ENTERPRISE ASSET MANAGEMENT MARKET: APPLICATION FOOTPRINT
- TABLE 212 ENTERPRISE ASSET MANAGEMENT MARKET: DEPLOYMENT TYPE FOOTPRINT
- TABLE 213 ENTERPRISE ASSET MANAGEMENT MARKET: ORGANIZATION SIZE FOOTPRINT
- TABLE 214 ENTERPRISE ASSET MANAGEMENT MARKET: VERTICAL FOOTPRINT
- TABLE 215 ENTERPRISE ASSET MANAGEMENT MARKET: LIST OF KEY STARTUPS/SMES
- TABLE 216 ENTERPRISE ASSET MANAGEMENT MARKET: COMPETITIVE BENCHMARKING OF STARTUPS/SMES
- TABLE 217 ENTERPRISE ASSET MANAGEMENT MARKET: PRODUCT LAUNCHES, MARCH 2024-AUGUST 2025
- TABLE 218 ENTERPRISE ASSET MANAGEMENT MARKET: DEALS, MARCH 2023 -AUGUST 2025
- TABLE 219 IBM: COMPANY OVERVIEW
- TABLE 220 IBM: PRODUCTS/SOLUTIONS/SERVICES OFFERED
- TABLE 221 IBM: PRODUCT ENHANCEMENTS
- TABLE 222 IBM: DEALS
- TABLE 223 SAP: COMPANY OVERVIEW
- TABLE 224 SAP: PRODUCTS/SOLUTIONS/SERVICES OFFERED
- TABLE 225 ORACLE: COMPANY OVERVIEW
- TABLE 226 ORACLE: PRODUCTS/SOLUTIONS/SERVICES OFFERED
- TABLE 227 IFS: COMPANY OVERVIEW
- TABLE 228 IFS: PRODUCTS/SOLUTIONS/SERVICES OFFERED
- TABLE 229 IFS: DEALS
- TABLE 230 HEXAGON AB: COMPANY OVERVIEW
- TABLE 231 HEXAGON AB: PRODUCTS/SOLUTIONS/SERVICES OFFERED
- TABLE 232 HEXAGON AB: PRODUCT LAUNCHES & ENHANCEMENTS
- TABLE 233 HEXAGON AB: DEALS
- TABLE 234 TRIMBLE: COMPANY OVERVIEW
- TABLE 235 TRIMBLE: PRODUCTS/SOLUTIONS/SERVICES OFFERED
- TABLE 236 TRIMBLE: PRODUCT LAUNCHES
- TABLE 237 TRIMBLE: DEALS
- TABLE 238 APTEAN: COMPANY OVERVIEW
- TABLE 239 APTEAN: PRODUCTS/SOLUTIONS/SERVICES OFFERED
- TABLE 240 APTEAN: DEALS
- TABLE 241 SERVICENOW: COMPANY OVERVIEW
- TABLE 242 SERVICENOW: PRODUCTS/SOLUTIONS/SERVICES OFFERED
- TABLE 243 SERVICENOW: PRODUCT ENHANCEMENTS
- TABLE 244 SERVICENOW: DEALS
- TABLE 245 HITACHI ENERGY: COMPANY OVERVIEW
- TABLE 246 HITACHI ENERGY: PRODUCTS/SOLUTIONS/SERVICES OFFERED
- TABLE 247 RAMCO: COMPANY OVERVIEW
- TABLE 248 RAMCO: PRODUCTS/SOLUTIONS/SERVICES OFFERED
- TABLE 249 HUMAN CAPITAL MANAGEMENT MARKET, BY OFFERING, 2019-2023 (USD MILLION)
- TABLE 250 HUMAN CAPITAL MANAGEMENT MARKET, BY OFFERING, 2024-2029 (USD MILLION)
- TABLE 251 HUMAN CAPITAL MANAGEMENT MARKET, BY SOFTWARE, 2019-2023 (USD MILLION)
- TABLE 252 HUMAN CAPITAL MANAGEMENT MARKET, BY SOFTWARE, 2024-2029 (USD MILLION)
- TABLE 253 WORKFORCE MANAGEMENT MARKET, BY COMPONENT, 2018-2025 (USD MILLION)
- TABLE 254 SOLUTIONS: WORKFORCE MANAGEMENT MARKET, BY REGION, 2018-2025 (USD MILLION)
- TABLE 255 SERVICES: WORKFORCE MANAGEMENT MARKET, BY REGION, 2018-2025 (USD MILLION)
List of Figures
- FIGURE 1 ENTERPRISE ASSET MANAGEMENT MARKET: RESEARCH DESIGN
- FIGURE 2 BREAKUP OF PRIMARY INTERVIEWS, BY COMPANY TYPE, DESIGNATION, AND REGION
- FIGURE 3 ENTERPRISE ASSET MANAGEMENT MARKET: TOP-DOWN AND BOTTOM-UP APPROACHES
- FIGURE 4 MARKET SIZE ESTIMATION METHODOLOGY: TOP-DOWN APPROACH
- FIGURE 5 MARKET SIZE ESTIMATION METHODOLOGY: BOTTOM-UP APPROACH
- FIGURE 6 ENTERPRISE ASSET MANAGEMENT MARKET: RESEARCH FLOW
- FIGURE 7 MARKET SIZE ESTIMATION METHODOLOGY: SUPPLY-SIDE ANALYSIS
- FIGURE 8 MARKET SIZE ESTIMATION METHODOLOGY: BOTTOM-UP APPROACH FROM SUPPLY SIDE - COLLECTIVE REVENUE OF VENDORS
- FIGURE 9 ENTERPRISE ASSET MANAGEMENT MARKET: DEMAND-SIDE APPROACH
- FIGURE 10 GLOBAL ENTERPRISE ASSET MANAGEMENT MARKET TO WITNESS SIGNIFICANT GROWTH
- FIGURE 11 FASTEST-GROWING SEGMENTS IN ENTERPRISE ASSET MANAGEMENT MARKET, 2025-2030
- FIGURE 12 ENTERPRISE ASSET MANAGEMENT MARKET: REGIONAL SNAPSHOT
- FIGURE 13 GROWING ADOPTION OF AI- AND IOT-ENABLED PREDICTIVE MAINTENANCE SOLUTIONS TO ENHANCE ASSET RELIABILITY AND REDUCE OPERATIONAL COSTS
- FIGURE 14 SOLUTIONS SEGMENT TO ACCOUNT FOR LARGEST MARKET SHARE DURING FORECAST PERIOD
- FIGURE 15 OPERATION MANAGEMENT SEGMENT TO ACCOUNT FOR LARGEST MARKET SHARE DURING FORECAST PERIOD
- FIGURE 16 CLOUD SEGMENT TO ACCOUNT FOR LARGEST MARKET SHARE BY 2030
- FIGURE 17 LARGE ENTERPRISES TO RETAIN MARKET LEADERSHIP TILL 2030
- FIGURE 18 LINEAR ASSETS TO ACCOUNT FOR LARGEST MARKET SHARE DURING FORECAST PERIOD
- FIGURE 19 MANUFACTURING TO ACCOUNT FOR LARGEST MARKET SHARE TILL 2030
- FIGURE 20 ASIA PACIFIC TO EMERGE AS TOP MARKET FOR INVESTMENT IN NEXT FIVE YEARS
- FIGURE 21 ENTERPRISE ASSET MANAGEMENT MARKET: DRIVERS, RESTRAINTS, OPPORTUNITIES, AND CHALLENGES
- FIGURE 22 ENTERPRISE ASSET MANAGEMENT MARKET: PORTER'S FIVE FORCES ANALYSIS
- FIGURE 23 INFLUENCE OF STAKEHOLDERS ON BUYING PROCESS FOR TOP THREE VERTICALS
- FIGURE 24 KEY BUYING CRITERIA FOR TOP THREE VERTICALS
- FIGURE 25 ENTERPRISE ASSET MANAGEMENT MARKET: ECOSYSTEM ANALYSIS
- FIGURE 26 ENTERPRISE ASSET MANAGEMENT MARKET: SUPPLY CHAIN ANALYSIS
- FIGURE 27 AVERAGE SELLING PRICE OF EAM SOLUTIONS, BY REGION (2021-2024)
- FIGURE 28 NUMBER OF PATENTS PUBLISHED, 2015-2025
- FIGURE 29 ENTERPRISE ASSET MANAGEMENT VENDORS: TOTAL FUNDING VALUE AND NUMBER OF FUNDING ROUNDS, 2024
- FIGURE 30 IMPACT OF AI/GEN AI IN ENTERPRISE ASSET MANAGEMENT MARKET
- FIGURE 31 ENTERPRISE ASSET MANAGEMENT MARKET: TRENDS/DISRUPTIONS IMPACTING CUSTOMERS' BUSINESSES
- FIGURE 32 SOLUTIONS SEGMENT TO DOMINATE MARKET DURING FORECAST PERIOD
- FIGURE 33 OPERATION MANAGEMENT SEGMENT TO DOMINATE MARKET
- FIGURE 34 CLOUD SEGMENT TO LEAD MARKET DURING FORECAST PERIOD
- FIGURE 35 LINEAR ASSETS SEGMENT TO DOMINATE MARKET DURING FORECAST PERIOD
- FIGURE 36 LARGE ENTERPRISES SEGMENT TO HOLD MAJOR MARKET SHARE DURING FORECAST PERIOD
- FIGURE 37 MANUFACTURING SEGMENT TO DOMINATE MARKET DURING FORECAST PERIOD
- FIGURE 38 NORTH AMERICA TO ACCOUNT FOR LARGEST MARKET SHARE TILL 2030
- FIGURE 39 NORTH AMERICA: MARKET SNAPSHOT
- FIGURE 40 ASIA PACIFIC: MARKET SNAPSHOT
- FIGURE 41 ENTERPRISE ASSET MANAGEMENT MARKET: REVENUE ANALYSIS OF KEY PLAYERS, 2020-2024 (USD MILLION)
- FIGURE 42 ENTERPRISE ASSET MANAGEMENT: MARKET SHARE ANALYSIS, 2024
- FIGURE 43 ENTERPRISE ASSET MANAGEMENT MARKET: BRAND/PRODUCT COMPARISON
- FIGURE 44 COMPANY EVALUATION MATRIX FOR KEY PLAYERS: WEIGHTAGE OF CRITERIA
- FIGURE 45 ENTERPRISE ASSET MANAGEMENT MARKET: COMPANY EVALUATION MATRIX (KEY PLAYERS), 2024
- FIGURE 46 ENTERPRISE ASSET MANAGEMENT MARKET: COMPANY FOOTPRINT
- FIGURE 47 EVALUATION MATRIX FOR STARTUPS/SMES: WEIGHTAGE OF CRITERIA
- FIGURE 48 ENTERPRISE ASSET MANAGEMENT MARKET: COMPANY EVALUATION MATRIX (STARTUPS/SMES), 2024
- FIGURE 49 COMPANY VALUATION OF KEY VENDORS
- FIGURE 50 EV/EBITDA ANALYSIS OF KEY VENDORS
- FIGURE 51 YEAR-TO-DATE (YTD) PRICE TOTAL RETURN, AND FIVE-YEAR STOCK BETA OF KEY VENDORS
- FIGURE 52 IBM: COMPANY SNAPSHOT
- FIGURE 53 SAP: COMPANY SNAPSHOT
- FIGURE 54 ORACLE: COMPANY SNAPSHOT
- FIGURE 55 HEXAGON AB: COMPANY SNAPSHOT
- FIGURE 56 TRIMBLE: COMPANY SNAPSHOT
- FIGURE 57 SERVICENOW: COMPANY SNAPSHOT
- FIGURE 58 RAMCO: COMPANY SNAPSHOT
 企业资产管理市场:依组织规模、部署模式、组件、资产类型及产业划分-2026-2032年全球市场预测
 2026年全球企业资产管理(EAM)市场报告2026年全球企业资产管理市场报告
 企业资产管理市场分析及预测(至2035年):依类型、产品类型、服务、技术、组件、应用、部署类型、最终用户、模组及功能划分
 企业资产管理市场 - 全球产业规模、份额、趋势、机会及预测(按组件、组织规模、部署模式、应用、产业垂直领域、地区和竞争格局划分,2021-2031 年)
 全球企业资产管理市场:市场规模、占有率、成长率、产业分析、依类型、应用和地区划分的分析及预测(2026-2034年)企业资产管理工具市场:2026-2032年全球预测(依组件、部署类型、组织规模及产业垂直领域划分)
 企业资产管理系统市场规模、份额和成长分析(按产品、应用、部署模式、组织规模、垂直产业和地区划分)-2026-2033年产业预测
 企业资产管理市场:产业趋势·全球预测 (~2035年):元件类型·解决方案·服务·部署模式·组织·用途·终端用户·各地区
 企业资产管理市场规模、份额、趋势分析报告:按部署、公司规模、最终用途、地区、细分预测,2025-2030 年