


 |
市场调查报告书
商品编码
1883943
全球智慧购物车市场(至 2030 年)按购物车类型(完全整合购物车/改装套件)、应用(购物中心/超级市场)和分销类型(直销/经销商)划分Smart Shopping Cart Market by Cart Type (Fully Integrated Carts, Retrofit Kits), Application Area (Shopping Malls, Supermarkets), Mode of Sale (Direct, Distributor) - Global Forecast to 2030 |
||||||
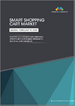
智慧购物车市场预计将从 2025 年的 3.26 亿美元成长到 2030 年的 1,4,231 亿美元,复合年增长率为 34.3%。
| 调查范围 | |
|---|---|
| 调查期 | 2025-2030 |
| 基准年 | 2025 |
| 预测期 | 2025-2030 |
| 单元 | 金额(美元) |
| 部分 | 用途、销售格式、购物车类型 |
| 目标区域 | 北美、亚太地区、欧洲、拉丁美洲、中东和非洲 |
人工智慧、电脑视觉、重量感测器和边缘运算技术的快速发展正在推动智慧购物车市场的成长。这些技术提高了产品辨识的准确性,降低了硬体成本,并增强了自动结帐系统的可靠性。现代购物车能够辨识商品(包括无需条码的生鲜食品),侦测误扫,并即时安全地处理交易。随着底层技术变得更加经济实惠且扩充性,零售商对大规模应用和长期投资报酬率 (ROI) 也越来越有信心。成熟的技术生态系统也支援模组化升级、提高电池效率以及与门市系统更紧密的集成,使智慧购物车比以往任何一代都更加实用且商业性吸引力。
“按销售方式划分,预计直销将占据最大的市场份额。”
在直销模式下,供应商与零售商紧密合作,负责安装、整合和后续服务。此模式确保与门市系统(包括POS系统、库存管理系统、忠诚度计画和即时分析平台)的紧密整合。零售商可享有高度客製化、快速问题解决和优先改进等优势。供应商则能获得宝贵的用户回馈,加速产品改进。直销模式在大型超级市场和其他需要高精度、高可靠性和长期伙伴关係的零售商中十分常见。此模式支援进阶部署,在这些部署中,人工智慧模型、边缘处理、连接性和支付处理的全端整合至关重要。近期大型连锁超市的大规模部署通常都透过直接伙伴关係进行,从而确保技术针对零售商独特的库存管理和业务流程进行最佳化。
预计北美将占据最大的市场份额。
在不断提升客户体验和降低营运成本的驱动下,北美智慧购物车市场正经历快速转型。在竞争激烈的零售环境中,主要企业正积极创新,采用并推动智慧购物车技术。购物车边缘运算和先进感测器融合技术的创新,提高了防盗性能,并实现了销售点的动态定价。企业也正在探索创新的融资模式,例如「机器人即服务」(Robot-as-a-Service),以加速智慧购物车在各种零售业态中的应用。北美消费者较高的可支配收入和已养成的数位化支付习惯,使他们更容易接受购物车内支付和个人化优惠。此外,供应链物流的持续发展也影响购物车的设计,并促进其与库存管理系统的更紧密整合。这些旨在利用科技重新定义实体购物体验的共同努力,巩固了北美作为智慧购物车关键成长中心的地位。
本报告调查了全球智慧购物车市场,并提供了市场概况、影响市场成长的各种因素分析、技术和专利趋势、法律制度、案例研究、市场规模趋势和预测、按各个细分市场、地区/主要国家/地区进行的详细分析、竞争格局以及主要企业的概况。
目录
第一章 引言
第二章调查方法
第三章执行摘要
第四章重要考察
第五章 市场概览与产业趋势
- 市场动态
- 司机
- 抑制因素
- 机会
- 任务
- 与相关市场和不同产业相关的跨领域机会
- 一级/二级/三级公司的策略性倡议
第六章 产业趋势
- 波特五力分析
- 宏观经济展望
- 供应链分析
- 价值链分析
- 生态系统
- 定价分析
- 贸易分析
- 大型会议和活动
- 影响您业务的趋势/颠覆性因素
- 投资和资金筹措方案
- 案例研究分析
- 美国关税对2025年智慧购物车市场的影响
第七章 策略颠覆:专利、数位化与人工智慧的应用
- 关键新兴技术
- 电脑视觉 SKU 检测
- 边缘人工智慧硬体和车载处理单元
- 多感测器融合(重量感测器、深度摄影机、光达)
- 互补技术
- 基于RFID和NFC的物品追踪
- 云端分析与零售数据平台
- 数位双胞胎与门市模拟系统
- 技术和产品蓝图
- 专利分析
- 人工智慧/生成式人工智慧对智慧购物车市场的影响
- 竞争对手采用的技术
- 经营模式
- 目前正在测试或部署智慧购物车的零售商
第八章:监理环境与合规性
- 监管状态
第九章:顾客状况与购买行为
- 决策流程
- 主要相关利益者和采购标准
- 招募也面临各种障碍和内部挑战。
- 各个终端使用者领域尚未满足的需求
第十章 科技驱动的智慧购物车市场
- 电脑视觉
- 人工智慧模组
- 感应器
- 边缘运算
- 连接性
- 展示
- 支付处理
第十一章 依购物车类型分類的智慧购物车市场
- 全集成推车
- 改装套件
第十二章 智慧购物车市场应用
- 购物中心
- 超级市场
- 其他的
第十三章 依销售类型分類的智慧购物车市场
- 直销
- 经销商
第十四章 各区域的智慧购物车市场
- 北美洲
- 美国
- 加拿大
- 欧洲
- 英国
- 德国
- 法国
- 义大利
- 其他的
- 亚太地区
- 中国
- 印度
- 日本
- 澳洲和纽西兰
- 其他的
- 中东和非洲
- 以色列
- 阿拉伯聯合大公国
- 南非
- 其他的
- 拉丁美洲
- 智利
- 墨西哥
- 其他的
第十五章 竞争格局
- 主要参与企业的策略/优势
- 市占率分析
- 品牌/产品对比
- 估值和财务指标
- 公司评估矩阵:主要企业
- 竞争场景
第十六章:公司简介
- 主要企业
- AMAZON
- CAPER
- VEEVE
- SHOPIC
- SUPERHII
- TRACXPOINT
- CUST2MATE
- SHEKEL
- FAYTECH
- KBST
- 其他公司
- METROCLICK
- RETAIL AI
- PENTLAND FIRTH SOFTWARE
- VASY ERP
- SMAPCA
- SWIFTFORCE
- KWIKKART
- ZEROQS
- SHOPREME
- TROLLEE
第十七章附录
The smart shopping cart market is estimated to be USD 326.0 million in 2025 and is expected to reach USD 1,423.1 billion by 2030, growing at a CAGR of 34.3%.
| Scope of the Report | |
|---|---|
| Years Considered for the Study | 2025-2030 |
| Base Year | 2025 |
| Forecast Period | 2025-2030 |
| Units Considered | Value (USD Million) |
| Segments | Application Area, By Mode of Sale, By Cart Type |
| Regions covered | North America, Asia Pacific, Europe, Latin America, Middle East & Africa |
Rapid advancements in AI, computer vision, weight sensors, and edge processing are significantly driving the growth of the smart shopping cart market. These technologies have improved item recognition accuracy, reduced hardware costs, and enhanced the reliability of autonomous checkout systems. Modern carts can identify products, including produce without barcodes, detect mis-scans, and process transactions securely in real time. As the underlying technology becomes more affordable and scalable, retailers gain confidence in large-scale deployment and long-term ROI. The maturing technology ecosystem also supports modular upgrades, improved battery efficiency, and better integration with store systems, making smart carts more practical and commercially attractive than earlier generations.
"The direct segment is expected to have the largest market size."
Direct sales involve the vendor working closely with retailers to manage installation, integration, and ongoing service. This model ensures tight alignment with store systems, including POS, inventory, loyalty, and real-time analytics platforms. Retailers benefit from higher customization, faster issue resolution, and prioritized feature enhancements. Vendors gain valuable user feedback that accelerates product improvement. Direct sales are common among large supermarket chains or retailers requiring high levels of accuracy, reliability, and long-term partnership commitments. This model supports advanced deployments where full-stack integration of AI models, edge processing, connectivity, and payment processing is crucial. Recent large-scale deployments by major grocery chains have typically been executed through direct partnerships, ensuring the technology is tailored specifically to the retailer's unique inventory and operational workflows.
"North America is expected to hold the largest market share."
North America's smart shopping cart market is undergoing a rapid transformation, driven by a relentless focus on enhancing customer experiences and reducing operational costs. The region's retail landscape, characterized by fierce competition, drives major players to innovate aggressively with smart cart technology. Innovations in on-cart edge computing and advanced sensor fusion are enhancing accuracy for loss prevention and enabling dynamic pricing at the point of sale. Companies are also exploring innovative financing models, such as "Robot-as-a-Service," to accelerate deployment across diverse retail formats. The high disposable income and established digital payment habits of North American consumers make them particularly receptive to in-cart payment and personalized offers. Additionally, the ongoing evolution of supply chain logistics is influencing cart design, integrating more closely with inventory management systems. This concerted effort to redefine the physical shopping experience through technology cements North America's position as a critical growth hub for smart shopping carts.
Breakdown of primaries
The study offers insights from a range of industry experts, including solution vendors and Tier 1 companies. The break-up of the primaries is as follows:
- By Company Type: Tier 1 - 62%, Tier 2 - 23%, and Tier 3 - 15%
- By Designation: C-level - 38%, D-level - 30%, and Others - 32%
- By Region: North America - 40%, Europe - 15%, Asia Pacific - 35%, Middle East & Africa - 5%, Latin America - 5%
The major players in the smart shopping cart market include Amazon (US), Caper (US), Veeve (US), Shopic (Israel), SuperHii (China), Tracxpoint (Israel), Cust2Mate (Israel), Shekel (Israel), Faytech (US), KBST (Germany), MetroClick (US), Retail AI (Japan), Pentland Firth Software (Germany), VasyERP (India), Smapca (India), SwiftForce (India), Kwikkart (US), ZeroQs (Poland), Shopreme (Austria), and Trollee (Hong Kong). These players have adopted various growth strategies, including partnerships, agreements, collaborations, new product launches, enhancements, and acquisitions, to expand their footprint in the smart shopping cart market.
Research Coverage
The market study covers the smart shopping cart market size and growth potential across different segments, including application areas, modes of sale, cart types, and regions. The application areas studied under the smart shopping cart market include shopping malls, supermarkets, and other application areas. The mode of sale segment includes direct and distributor. The cart type segment comprises fully integrated carts and retrofit carts. The regional analysis of the smart shopping cart market covers North America, Europe, the Asia Pacific, the Middle East & Africa, and Latin America.
Key Benefits of Buying the Report
The report will help market leaders and new entrants with information on the closest approximations of the global smart shopping cart market's revenue numbers and subsegments. It will also help stakeholders understand the competitive landscape, gain valuable insights, and develop effective go-to-market strategies. Moreover, the report will provide stakeholders with insights into the market's pulse, offering them information on key market drivers, restraints, challenges, and opportunities.
The report provides the following insights:
Analysis of key drivers (Growing consumer demand for frictionless, contactless, and personalized shopping, Technological advancements in computer vision, sensors, and edge computing enable reliable, low-latency item recognition), restraints (High upfront hardware and integration costs, Integration complexity with POS, inventory, and loyalty systems), opportunities (Retrofit devices/attachable solutions for existing carts, reducing the deployment cost, In-cart promotions, targeted offers, and ads create recurring revenue streams), and challenges (Robust item recognition across SKUs and packaging changes, Maintaining uptime, battery logistics, and field servicing across thousands of carts complicates scaling) influencing the growth of the smart shopping cart market.
Product Development/Innovation: Detailed insights on upcoming technologies, research & development activities, and product & service launches in the smart shopping cart market.
Market Development: The report provides comprehensive information about lucrative markets, analyzing the smart shopping cart market across various regions.
Market Diversification: Comprehensive information about new products and services, untapped geographies, recent developments, and investments in the smart shopping cart market.
Competitive Assessment: In-depth assessment of market shares, growth strategies, and service offerings of leading players such as Amazon (US), Caper (US), Veeve (US), Shopic (Israel), SuperHii (China), Tracxpoint (Israel), Cust2Mate (Israel), Shekel (Israel), Faytech (US), KBST (Germany), MetroClick (US), Retail AI (Japan), Pentland Firth Software (Germany), VasyERP (India), Smapca (India), SwiftForce (India), Kwikkart (US), ZeroQs (Poland), Shopreme (Austria), and Trollee (Hong Kong).
TABLE OF CONTENTS
1 INTRODUCTION
- 1.1 STUDY OBJECTIVES
- 1.2 MARKET DEFINITION
- 1.3 MARKET SCOPE
- 1.3.1 MARKET SEGMENTATION & REGIONAL SCOPE
- 1.3.2 INCLUSIONS AND EXCLUSIONS
- 1.4 YEARS CONSIDERED
- 1.5 CURRENCY CONSIDERED
- 1.6 STAKEHOLDERS
2 RESEARCH METHODOLOGY
- 2.1 RESEARCH DATA
- 2.1.1 SECONDARY DATA
- 2.1.1.1 Key data from secondary sources
- 2.1.2 PRIMARY DATA
- 2.1.2.1 Primary interviews with experts
- 2.1.2.2 Breakdown of primary profiles
- 2.1.2.3 Key data from primary sources
- 2.1.2.4 Key industry insights
- 2.1.1 SECONDARY DATA
- 2.2 MARKET BREAKUP AND DATA TRIANGULATION
- 2.3 MARKET SIZE ESTIMATION
- 2.3.1 TOP-DOWN APPROACH
- 2.3.2 BOTTOM-UP APPROACH
- 2.4 MARKET FORECAST
- 2.4.1 FACTOR ANALYSIS
- 2.5 RESEARCH ASSUMPTIONS
- 2.6 LIMITATIONS
3 EXECUTIVE SUMMARY
- 3.1 KEY INSIGHTS AND MARKET HIGHLIGHTS
- 3.2 KEY MARKET PARTICIPANTS: MAPPING OF STRATEGIC DEVELOPMENTS
- 3.3 DISRUPTIONS SHAPING MARKET
- 3.4 HIGH-GROWTH SEGMENTS
- 3.5 SNAPSHOT: GLOBAL MARKET SIZE, GROWTH RATE, AND FORECAST
4 PREMIUM INSIGHTS
- 4.1 ATTRACTIVE OPPORTUNITIES FOR PLAYERS IN SMART SHOPPING CART MARKET
- 4.2 SMART SHOPPING CART MARKET, BY MODE OF SALE AND REGION
- 4.3 SMART SHOPPING CART MARKET, BY APPLICATION AREA
- 4.4 SMART SHOPPING CART MARKET, BY MODE OF SALE
5 MARKET OVERVIEW AND INDUSTRY TRENDS
- 5.1 INTRODUCTION
- 5.2 MARKET DYNAMICS
- 5.2.1 DRIVERS
- 5.2.1.1 Growing consumer demand for frictionless, contactless, and personalized shopping
- 5.2.1.2 Technological advancements in computer vision, sensors, and edge computing enable reliable, low-latency item recognition
- 5.2.2 RESTRAINTS
- 5.2.2.1 High upfront hardware and integration costs
- 5.2.2.2 Integration complexity with POS, inventory, and loyalty systems
- 5.2.3 OPPORTUNITIES
- 5.2.3.1 Retrofit devices/attachable solutions for existing carts, reducing deployment cost
- 5.2.3.2 In-cart promotions, targeted offers, and ads create recurring revenue streams
- 5.2.4 CHALLENGES
- 5.2.4.1 Robust item recognition across SKUs and packaging changes
- 5.2.4.2 Maintaining uptime, battery logistics, and field servicing across thousands of carts complicates scaling
- 5.2.1 DRIVERS
- 5.3 INTERCONNECTED MARKETS AND CROSS-SECTOR OPPORTUNITIES
- 5.3.1 INTERCONNECTED MARKETS
- 5.3.2 CROSS-SECTOR OPPORTUNITIES
- 5.4 STRATEGIC MOVES BY TIER-1/2/3 PLAYERS
- 5.4.1 KEY MOVES AND STRATEGIC FOCUS
6 INDUSTRY TRENDS
- 6.1 PORTER'S FIVE FORCES MODEL ANALYSIS
- 6.1.1 THREAT OF NEW ENTRANTS
- 6.1.2 THREAT OF SUBSTITUTES
- 6.1.3 BARGAINING POWER OF SUPPLIERS
- 6.1.4 BARGAINING POWER OF BUYERS
- 6.1.5 INTENSITY OF COMPETITIVE RIVALRY
- 6.2 MACROECONOMIC OUTLOOK
- 6.2.1 INTRODUCTION
- 6.2.2 GDP TRENDS AND FORECAST
- 6.2.3 TRENDS IN GLOBAL SMART SHOPPING CART INDUSTRY
- 6.3 SUPPLY CHAIN ANALYSIS
- 6.4 VALUE CHAIN ANALYSIS
- 6.5 ECOSYSTEM
- 6.6 PRICING ANALYSIS
- 6.6.1 AVERAGE PRICING ANALYSIS
- 6.6.2 INDICATIVE PRICING ANALYSIS, BY CART TYPE
- 6.7 TRADE ANALYSIS
- 6.7.1 EXPORT SCENARIO OF TRAILERS AND SEMI-TRAILERS; OTHER VEHICLES, NOT MECHANICALLY PROPELLED
- 6.7.2 IMPORT SCENARIO OF VEHICLES PUSHED OR DRAWN BY HAND AND OTHER VEHICLES NOT MECHANICALLY PROPELLED BY COUNTRY, 2020-2024 (USD MILLION)
- 6.8 KEY CONFERENCES AND EVENTS
- 6.9 TRENDS/DISRUPTIONS IMPACTING CUSTOMER BUSINESS
- 6.10 INVESTMENT AND FUNDING SCENARIO
- 6.11 CASE STUDY ANALYSIS
- 6.11.1 VEEVE - SMART CART ROLLOUTS & RETAIL MEDIA PIVOT
- 6.11.2 TRACXPOINT - AI CART PLATFORM
- 6.11.3 SHOPREME'S SCAN & GO SDK INTEGRATED INTO REWE'S
- 6.12 IMPACT OF 2025 US TARIFF - SMART SHOPPING CART MARKET
- 6.12.1 INTRODUCTION
- 6.12.2 KEY TARIFF RATES
- 6.12.3 PRICE IMPACT ANALYSIS
- 6.12.4 IMPACT ON COUNTRY/REGION
- 6.12.4.1 US
- 6.12.4.2 Europe
- 6.12.4.3 Asia Pacific
- 6.12.4.4 IMPACT ON IoT END USERS
7 STRATEGIC DISRUPTION: PATENTS, DIGITAL, AND AI ADOPTION
- 7.1 KEY EMERGING TECHNOLOGIES
- 7.1.1 COMPUTER VISION-DRIVEN SKU DETECTION
- 7.1.2 EDGE AI HARDWARE & ON-CART PROCESSING UNITS
- 7.1.3 MULTI-SENSOR FUSION (WEIGHT SENSORS, DEPTH CAMERAS, LIDAR)
- 7.2 COMPLEMENTARY TECHNOLOGIES
- 7.2.1 RFID & NFC-BASED ITEM TRACKING
- 7.2.2 CLOUD ANALYTICS & RETAIL DATA PLATFORMS
- 7.2.3 DIGITAL TWIN & STORE SIMULATION SYSTEMS
- 7.3 TECHNOLOGY/PRODUCT ROADMAP FOR SMART SHOPPING CART MARKET
- 7.3.1 SHORT-TERM ROADMAP (2023-2025)
- 7.3.2 MID-TERM ROADMAP (2026-2028)
- 7.3.3 LONG-TERM ROADMAP (2029-2030)
- 7.3.4 SMART SHOPPING CART ECOSYSTEM
- 7.3.4.1 Web management platform
- 7.3.4.2 Cloud infrastructure
- 7.3.4.3 Products & hardware
- 7.3.4.4 Middleware
- 7.3.4.5 ERP & POS system integration
- 7.4 PATENT ANALYSIS
- 7.4.1 LIST OF MAJOR PATENTS
- 7.5 IMPACT OF AI/GENERATIVE AI ON SMART SHOPPING CART MARKET
- 7.5.1 TOP USE CASES AND MARKET POTENTIAL OF GENERATIVE AI IN SMART SHOPPING CARTS
- 7.5.2 BEST PRACTICES OF SMART SHOPPING CART MARKET
- 7.5.3 CASE STUDIES OF AI IMPLEMENTATION IN SMART SHOPPING CART MARKET
- 7.5.3.1 Case study 1: Caper AI-powered Smart Cart Deployment
- 7.5.3.2 Case study 2: Shopic Clip-On Device Rollout
- 7.5.3.3 Case study 3: Cust2Mate Intelligent Cart Program
- 7.5.3.4 Case study 4: Shekel Scales & Vision System Integration
- 7.5.4 INTERCONNECTED ADJACENT ECOSYSTEM AND IMPACT ON MARKET PLAYERS
- 7.5.5 CLIENTS' READINESS TO ADOPT GENERATIVE AI IN SMART SHOPPING CARTS
- 7.6 TECHNOLOGIES ADOPTED BY COMPETITORS
- 7.7 BUSINESS MODELS
- 7.8 RETAILERS CURRENTLY TESTING OR ADOPTING SMART CARTS
8 REGULATORY LANDSCAPE AND COMPLIANCE
- 8.1 REGULATORY LANDSCAPE
- 8.1.1 REGULATORY BODIES, GOVERNMENT AGENCIES, AND OTHER ORGANIZATIONS
- 8.1.2 INDUSTRY STANDARDS
- 8.1.2.1 North America
- 8.1.2.1.1 US
- 8.1.2.1.2 Canada
- 8.1.2.2 Europe
- 8.1.2.3 Asia Pacific
- 8.1.2.3.1 China
- 8.1.2.3.2 Japan
- 8.1.2.3.3 India
- 8.1.2.4 Middle East & Africa
- 8.1.2.4.1 UAE
- 8.1.2.4.2 Saudi Arabia
- 8.1.2.4.3 South Africa
- 8.1.2.5 Latin America
- 8.1.2.5.1 Brazil
- 8.1.2.1 North America
9 CUSTOMER LANDSCAPE & BUYER BEHAVIOR
- 9.1 DECISION-MAKING PROCESS
- 9.2 KEY STAKEHOLDERS AND BUYING CRITERIA
- 9.2.1 KEY STAKEHOLDERS IN BUYING PROCESS
- 9.2.2 BUYING CRITERIA
- 9.3 ADOPTION BARRIERS & INTERNAL CHALLENGES
- 9.4 UNMET NEEDS IN VARIOUS END-USE VERTICALS
10 SMART SHOPPING CART MARKET, BY TECHNOLOGY
- 10.1 INTRODUCTION
- 10.1.1 TECHNOLOGY: SMART SHOPPING CART MARKET DRIVERS
- 10.2 COMPUTER VISION
- 10.2.1 VISUALIZING CART'S CONTENTS FOR SEAMLESS TRACKING
- 10.2.1.1 Use Cases
- 10.2.1 VISUALIZING CART'S CONTENTS FOR SEAMLESS TRACKING
- 10.3 AI MODULES
- 10.3.1 POWER REAL-TIME DECISIONS AND PERSONALIZED INTERACTIONS
- 10.3.1.1 Use Cases
- 10.3.1 POWER REAL-TIME DECISIONS AND PERSONALIZED INTERACTIONS
- 10.4 SENSORS
- 10.4.1 CAPTURING GRANULAR DATA FOR MULTI-MODAL VERIFICATION
- 10.4.1.1 Use Cases
- 10.4.1 CAPTURING GRANULAR DATA FOR MULTI-MODAL VERIFICATION
- 10.5 EDGE COMPUTING
- 10.5.1 ENABLE LOW-LATENCY PROCESSING FOR REAL-TIME CART FUNCTIONS
- 10.5.1.1 Use Cases
- 10.5.1 ENABLE LOW-LATENCY PROCESSING FOR REAL-TIME CART FUNCTIONS
- 10.6 CONNECTIVITY
- 10.6.1 MAINTAIN SEAMLESS COMMUNICATION BETWEEN CART AND STORE SYSTEMS
- 10.6.1.1 Use Cases
- 10.6.1 MAINTAIN SEAMLESS COMMUNICATION BETWEEN CART AND STORE SYSTEMS
- 10.7 DISPLAY
- 10.7.1 ENHANCE USER INTERACTION AND IMPROVE SHOPPING EFFICIENCY
- 10.7.1.1 Use Cases
- 10.7.1 ENHANCE USER INTERACTION AND IMPROVE SHOPPING EFFICIENCY
- 10.8 PAYMENT PROCESSING
- 10.8.1 ENABLE SECURE, FRICTIONLESS DIGITAL TRANSACTIONS
- 10.8.1.1 Use Cases
- 10.8.1 ENABLE SECURE, FRICTIONLESS DIGITAL TRANSACTIONS
11 SMART SHOPPING CART MARKET, BY CART TYPE
- 11.1 INTRODUCTION
- 11.1.1 CART TYPE: SMART SHOPPING CART MARKET DRIVERS
- 11.2 FULLY INTEGRATED CARTS
- 11.2.1 INCREASING DEMAND FOR HIGH-PRECISION, END-TO-END IN-STORE AUTOMATION
- 11.3 RETROFIT KITS
- 11.3.1 LOW UPFRONT COST AND RAPID DEPLOYMENT CAPABILITIES
12 SMART SHOPPING CART MARKET, BY APPLICATION AREA
- 12.1 INTRODUCTION
- 12.1.1 APPLICATION AREA: SMART SHOPPING CART MARKET DRIVERS
- 12.2 SHOPPING MALLS
- 12.2.1 ENHANCE MULTI-STORE EXPERIENCE AND SHOPPER ENGAGEMENT
- 12.3 SUPERMARKETS
- 12.3.1 OPTIMIZE HIGH-FREQUENCY, HIGH-SKU SHOPPING JOURNEYS
- 12.4 OTHER APPLICATION AREAS
13 SMART SHOPPING CART MARKET, BY MODE OF SALE
- 13.1 INTRODUCTION
- 13.1.1 MODE OF SALE: SMART SHOPPING CART MARKET DRIVERS
- 13.2 DIRECT
- 13.2.1 DEEP INTEGRATION AND CONTROL OVER RETAILER EXPERIENCE
- 13.3 DISTRIBUTOR
- 13.3.1 EXPAND MARKET REACH AND ENABLE LOCALIZED SUPPORT
14 SMART SHOPPING CART MARKET, BY REGION
- 14.1 INTRODUCTION
- 14.2 NORTH AMERICA
- 14.2.1 US
- 14.2.1.1 Accelerated Retail Digitalization Driving Smart Cart Uptake
- 14.2.2 CANADA
- 14.2.2.1 Growing Retail Modernization Supporting Smart Cart Pilots
- 14.2.1 US
- 14.3 EUROPE
- 14.3.1 UK
- 14.3.1.1 AI-led Store Innovation Fueling Smart Trolley Deployments
- 14.3.2 GERMANY
- 14.3.2.1 Expansion of Seamless Checkout Technologies Enabling Smart Cart Adoption
- 14.3.3 FRANCE
- 14.3.3.1 Retail Automation Investments Catalyzing Smart Cart Trials
- 14.3.4 ITALY
- 14.3.4.1 Increasing Omnichannel Retail Focus Encouraging Smart Cart Use Cases
- 14.3.5 REST OF EUROPE
- 14.3.1 UK
- 14.4 ASIA PACIFIC
- 14.4.1 CHINA
- 14.4.1.1 Focus on Alternative Retail Tech
- 14.4.2 INDIA
- 14.4.2.1 Conglomerate Unveils Smart Cart Demo
- 14.4.3 JAPAN
- 14.4.3.1 National Chain Trials Scanning Carts
- 14.4.4 AUSTRALIA & NEW ZEALAND
- 14.4.4.1 Government Pilots Driving Trusted RAG Use Cases
- 14.4.5 REST OF ASIA PACIFIC
- 14.4.1 CHINA
- 14.5 MIDDLE EAST & AFRICA
- 14.5.1 ISRAEL
- 14.5.1.1 Tech Exporter of Smart Carts
- 14.5.2 UAE
- 14.5.2.1 Vision 2030 Investments Scaling Knowledge-centric AI
- 14.5.3 SOUTH AFRICA
- 14.5.3.1 First Smart Trolley Trials
- 14.5.4 REST OF MIDDLE EAST & AFRICA
- 14.5.1 ISRAEL
- 14.6 LATIN AMERICA
- 14.6.1 CHILE
- 14.6.1.1 Driving AI-enabled Checkout Transformation Across Leading Supermarket Chains
- 14.6.2 MEXICO
- 14.6.2.1 Accelerating Retail Modernization Through Large-scale Smart Cart Pilots
- 14.6.3 REST OF LATIN AMERICA
- 14.6.1 CHILE
15 COMPETITIVE LANDSCAPE
- 15.1 INTRODUCTION
- 15.2 KEY PLAYER STRATEGIES/RIGHT TO WIN, 2023-2025
- 15.3 MARKET SHARE ANALYSIS, 2025
- 15.4 BRAND/PRODUCT COMPARISON
- 15.5 COMPANY VALUATION AND FINANCIAL METRICS
- 15.6 COMPANY EVALUATION MATRIX: MAJOR PLAYERS, 2025
- 15.6.1 STARS
- 15.6.2 EMERGING LEADERS
- 15.6.3 PERVASIVE PLAYERS
- 15.6.4 PARTICIPANTS
- 15.6.5 COMPANY FOOTPRINT: MAJOR PLAYERS, 2025
- 15.6.5.1 Company footprint
- 15.6.5.2 Region footprint
- 15.6.5.3 Application area footprint
- 15.6.5.4 Mode of sale footprint
- 15.7 COMPETITIVE SCENARIO
- 15.7.1 PRODUCT LAUNCHES AND ENHANCEMENTS
- 15.7.2 DEALS
16 COMPANY PROFILES
- 16.1 KEY PLAYERS
- 16.1.1 AMAZON
- 16.1.1.1 Business overview
- 16.1.1.2 Products/Solutions/Services offered
- 16.1.1.3 Recent developments
- 16.1.1.3.1 Product launches
- 16.1.1.3.2 Deals
- 16.1.1.4 MnM view
- 16.1.1.4.1 Key strengths/Right to win
- 16.1.1.4.2 Strategic choices
- 16.1.1.4.3 Weaknesses and competitive threats
- 16.1.2 CAPER
- 16.1.2.1 Business overview
- 16.1.2.2 Products/Solutions/Services offered
- 16.1.2.3 Recent developments
- 16.1.2.3.1 Deals
- 16.1.2.4 MnM view
- 16.1.2.4.1 Key strengths/Right to win
- 16.1.2.4.2 Strategic choices
- 16.1.2.4.3 Weaknesses and competitive threats
- 16.1.3 VEEVE
- 16.1.3.1 Business overview
- 16.1.3.2 Products/Solutions/Services offered
- 16.1.3.3 Recent developments
- 16.1.3.3.1 Product launches
- 16.1.3.3.2 Deals
- 16.1.3.4 MnM view
- 16.1.3.4.1 Key strengths/Right to win
- 16.1.3.4.2 Strategic choices
- 16.1.3.4.3 Weaknesses and competitive threats
- 16.1.4 SHOPIC
- 16.1.4.1 Business overview
- 16.1.4.2 Products/Solutions/Services offered
- 16.1.4.3 Recent developments
- 16.1.4.3.1 Deals
- 16.1.4.4 MnM view
- 16.1.4.4.1 Key strengths/Right to win
- 16.1.4.4.2 Strategic choices
- 16.1.4.4.3 Weaknesses and competitive threats
- 16.1.5 SUPERHII
- 16.1.5.1 Business overview
- 16.1.5.2 Products/Solutions/Services offered
- 16.1.5.3 Recent developments
- 16.1.5.3.1 Product launches
- 16.1.5.4 MnM view
- 16.1.5.4.1 Key strengths/Right to win
- 16.1.5.4.2 Strategic choices
- 16.1.5.4.3 Weaknesses and competitive threats
- 16.1.6 TRACXPOINT
- 16.1.6.1 Business overview
- 16.1.6.2 Products/Solutions/Services offered
- 16.1.6.3 Recent developments
- 16.1.6.3.1 Deals
- 16.1.7 CUST2MATE
- 16.1.7.1 Business overview
- 16.1.7.2 Products/Solutions/Services offered
- 16.1.7.3 Recent developments
- 16.1.7.3.1 Expansions
- 16.1.8 SHEKEL
- 16.1.8.1 Business overview
- 16.1.8.2 Products/Solutions/Services offered
- 16.1.9 FAYTECH
- 16.1.9.1 Business overview
- 16.1.9.2 Products/Solutions/Services offered
- 16.1.10 KBST
- 16.1.10.1 Business overview
- 16.1.10.2 Products/Solutions/Services offered
- 16.1.1 AMAZON
- 16.2 OTHER PLAYERS
- 16.2.1 METROCLICK
- 16.2.2 RETAIL AI
- 16.2.3 PENTLAND FIRTH SOFTWARE
- 16.2.4 VASY ERP
- 16.2.5 SMAPCA
- 16.2.6 SWIFTFORCE
- 16.2.7 KWIKKART
- 16.2.8 ZEROQS
- 16.2.9 SHOPREME
- 16.2.10 TROLLEE
17 APPENDIX
- 17.1 DISCUSSION GUIDE
- 17.2 KNOWLEDGESTORE: MARKETSANDMARKETS' SUBSCRIPTION PORTAL
- 17.3 CUSTOMIZATION OPTIONS
- 17.4 RELATED REPORTS
- 17.5 AUTHOR DETAILS
List of Tables
- TABLE 1 INCLUSIONS AND EXCLUSIONS
- TABLE 2 USD EXCHANGE RATES, 2022-2024
- TABLE 3 IMPACT OF PORTER'S FIVE FORCES ON SMART SHOPPING CART MARKET
- TABLE 4 GDP PERCENTAGE CHANGE, BY KEY COUNTRY, 2021-2029
- TABLE 5 SMART SHOPPING CART MARKET: ECOSYSTEM
- TABLE 6 AVERAGE SELLING PRICE OF KEY PLAYERS FOR SMART SHOPPING CARTS (USD)
- TABLE 7 INDICATIVE PRICING LEVELS OF SMART SHOPPING CART, BY CART TYPE (USD)
- TABLE 8 SMART SHOPPING CART MARKET: DETAILED LIST OF KEY CONFERENCES AND EVENTS, 2024-2025
- TABLE 9 US ADJUSTED RECIPROCAL TARIFF RATES
- TABLE 10 EXPECTED CHANGE IN PRICES AND IMPACT ON END-USE MARKETS DUE TO TARIFF IMPACT
- TABLE 11 NORTH AMERICA: LIST OF REGULATORY BODIES, GOVERNMENT AGENCIES, AND OTHER ORGANIZATIONS
- TABLE 12 EUROPE: LIST OF REGULATORY BODIES, GOVERNMENT AGENCIES, AND OTHER ORGANIZATIONS
- TABLE 13 ASIA PACIFIC: LIST OF REGULATORY BODIES, GOVERNMENT AGENCIES, AND OTHER ORGANIZATIONS
- TABLE 14 REST OF THE WORLD: LIST OF REGULATORY BODIES, GOVERNMENT AGENCIES, AND OTHER ORGANIZATIONS
- TABLE 15 INFLUENCE OF STAKEHOLDERS ON BUYING PROCESS FOR APPLICATION AREAS
- TABLE 16 KEY BUYING CRITERIA FOR APPLICATION AREAS
- TABLE 17 SMART SHOPPING CART MARKET: UNMET NEEDS IN KEY END-USE VERTICALS
- TABLE 18 SMART SHOPPING CART MARKET, BY CART TYPE, 2025-2030 (USD MILLION)
- TABLE 19 FULLY INTEGRATED CARTS: SMART SHOPPING CART MARKET, BY REGION, 2025-2030 (USD MILLION)
- TABLE 20 RETROFIT KITS: SMART SHOPPING CART MARKET, BY REGION, 2025-2030 (USD MILLION)
- TABLE 21 SMART SHOPPING CART MARKET, BY APPLICATION AREA, 2025-2030 (USD MILLION)
- TABLE 22 SHOPPING MALLS: SMART SHOPPING CART MARKET, BY REGION, 2025-2030 (USD MILLION)
- TABLE 23 SUPERMARKETS: SMART SHOPPING CART MARKET, BY REGION, 2025-2030 (USD MILLION)
- TABLE 24 OTHER APPLICATION AREAS: SMART SHOPPING CART MARKET, BY REGION, 2025-2030 (USD MILLION)
- TABLE 25 SMART SHOPPING CART MARKET, BY MODE OF SALE, 2025-2030 (USD MILLION)
- TABLE 26 DIRECT: SMART SHOPPING CART MARKET, BY REGION, 2025-2030 (USD MILLION)
- TABLE 27 DISTRIBUTOR: SMART SHOPPING CART MARKET, BY REGION, 2025-2030 (USD MILLION)
- TABLE 28 SMART SHOPPING CART MARKET, BY REGION, 2025-2030 (USD MILLION)
- TABLE 29 NORTH AMERICA: SMART SHOPPING CART MARKET, BY CART TYPE, 2025-2030 (USD MILLION)
- TABLE 30 NORTH AMERICA: SMART SHOPPING CART MARKET, BY APPLICATION AREA, 2025-2030 (USD MILLION)
- TABLE 31 NORTH AMERICA: SMART SHOPPING CART MARKET, BY MODE OF SALE, 2025-2030 (USD MILLION)
- TABLE 32 NORTH AMERICA: SMART SHOPPING CART MARKET, BY COUNTRY, 2025-2030 (USD MILLION)
- TABLE 33 US: SMART SHOPPING CART MARKET, BY CART TYPE, 2025-2030 (USD MILLION)
- TABLE 34 US: SMART SHOPPING CART MARKET, BY APPLICATION AREA, 2025-2030 (USD MILLION)
- TABLE 35 US: SMART SHOPPING CART MARKET, BY MODE OF SALE, 2025-2030 (USD MILLION)
- TABLE 36 CANADA: SMART SHOPPING CART MARKET, BY CART TYPE, 2025-2030 (USD MILLION)
- TABLE 37 CANADA: SMART SHOPPING CART MARKET, BY APPLICATION AREA, 2025-2030 (USD MILLION)
- TABLE 38 CANADA: SMART SHOPPING CART MARKET, BY MODE OF SALE, 2025-2030 (USD MILLION)
- TABLE 39 EUROPE: SMART SHOPPING CART MARKET, BY CART TYPE, 2025-2030 (USD MILLION)
- TABLE 40 EUROPE: SMART SHOPPING CART MARKET, BY APPLICATION AREA, 2025-2030 (USD MILLION)
- TABLE 41 EUROPE: SMART SHOPPING CART MARKET, BY MODE OF SALE, 2025-2030 (USD MILLION)
- TABLE 42 EUROPE: SMART SHOPPING CART MARKET, BY COUNTRY, 2025-2030 (USD MILLION)
- TABLE 43 UK: SMART SHOPPING CART MARKET, BY CART TYPE, 2025-2030 (USD MILLION)
- TABLE 44 UK: SMART SHOPPING CART MARKET, BY APPLICATION AREA, 2025-2030 (USD MILLION)
- TABLE 45 UK: SMART SHOPPING CART MARKET, BY MODE OF SALE, 2025-2030 (USD MILLION)
- TABLE 46 GERMANY: SMART SHOPPING CART MARKET, BY CART TYPE, 2025-2030 (USD MILLION)
- TABLE 47 GERMANY: SMART SHOPPING CART MARKET, BY APPLICATION AREA, 2025-2030 (USD MILLION)
- TABLE 48 GERMANY: SMART SHOPPING CART MARKET, BY MODE OF SALE, 2025-2030 (USD MILLION)
- TABLE 49 FRANCE: SMART SHOPPING CART MARKET, BY CART TYPE, 2025-2030 (USD MILLION)
- TABLE 50 FRANCE: SMART SHOPPING CART MARKET, BY APPLICATION AREA, 2025-2030 (USD MILLION)
- TABLE 51 FRANCE: SMART SHOPPING CART MARKET, BY MODE OF SALE, 2025-2030 (USD MILLION)
- TABLE 52 ITALY: SMART SHOPPING CART MARKET, BY CART TYPE, 2025-2030 (USD MILLION)
- TABLE 53 ITALY: SMART SHOPPING CART MARKET, BY APPLICATION AREA, 2025-2030 (USD MILLION)
- TABLE 54 ITALY: SMART SHOPPING CART MARKET, BY MODE OF SALE, 2025-2030 (USD MILLION)
- TABLE 55 REST OF EUROPE: SMART SHOPPING CART MARKET, BY CART TYPE, 2025-2030 (USD MILLION)
- TABLE 56 REST OF EUROPE: SMART SHOPPING CART MARKET, BY APPLICATION AREA, 2025-2030 (USD MILLION)
- TABLE 57 REST OF EUROPE: SMART SHOPPING CART MARKET, BY MODE OF SALE, 2025-2030 (USD MILLION)
- TABLE 58 ACIA PACIFIC: SMART SHOPPING CART MARKET, BY CART TYPE, 2025-2030 (USD MILLION)
- TABLE 59 ASIA PACIFIC: SMART SHOPPING CART MARKET, BY APPLICATION AREA, 2025-2030 (USD MILLION)
- TABLE 60 ASIA PACIFIC: SMART SHOPPING CART MARKET, BY MODE OF SALE, 2025-2030 (USD MILLION)
- TABLE 61 ASIA PACIFIC: SMART SHOPPING CART MARKET, BY COUNTRY, 2025-2030 (USD MILLION)
- TABLE 62 CHINA: SMART SHOPPING CART MARKET, BY CART TYPE, 2025-2030 (USD MILLION)
- TABLE 63 CHINA: SMART SHOPPING CART MARKET, BY APPLICATION AREA, 2025-2030 (USD MILLION)
- TABLE 64 CHINA: SMART SHOPPING CART MARKET, BY MODE OF SALE, 2025-2030 (USD MILLION)
- TABLE 65 INDIA: SMART SHOPPING CART MARKET, BY CART TYPE, 2025-2030 (USD MILLION)
- TABLE 66 INDIA: SMART SHOPPING CART MARKET, BY APPLICATION AREA, 2025-2030 (USD MILLION)
- TABLE 67 INDIA: SMART SHOPPING CART MARKET, BY MODE OF SALE, 2025-2030 (USD MILLION)
- TABLE 68 JAPAN: SMART SHOPPING CART MARKET, BY CART TYPE, 2025-2030 (USD MILLION)
- TABLE 69 JAPAN: SMART SHOPPING CART MARKET, BY APPLICATION AREA, 2025-2030 (USD MILLION)
- TABLE 70 JAPAN: SMART SHOPPING CART MARKET, BY MODE OF SALE, 2025-2030 (USD MILLION)
- TABLE 71 ANZ: SMART SHOPPING CART MARKET, BY CART TYPE, 2025-2030 (USD MILLION)
- TABLE 72 ANZ: SMART SHOPPING CART MARKET, BY APPLICATION AREA, 2025-2030 (USD MILLION)
- TABLE 73 ANZ: SMART SHOPPING CART MARKET, BY MODE OF SALE, 2025-2030 (USD MILLION)
- TABLE 74 REST OF ASIA PACIFIC: SMART SHOPPING CART MARKET, BY CART TYPE, 2025-2030 (USD MILLION)
- TABLE 75 REST OF ASIA PACIFIC: SMART SHOPPING CART MARKET, BY APPLICATION AREA, 2025-2030 (USD MILLION)
- TABLE 76 REST OF ASIA PACIFIC: SMART SHOPPING CART MARKET, BY MODE OF SALE, 2025-2030 (USD MILLION)
- TABLE 77 MIDDLE EAST & AFRICA: SMART SHOPPING CART MARKET, BY CART TYPE, 2025-2030 (USD MILLION)
- TABLE 78 MIDDLE EAST & AFRICA: SMART SHOPPING CART MARKET, BY APPLICATION AREA, 2025-2030 (USD MILLION)
- TABLE 79 MIDDLE EAST & AFRICA: SMART SHOPPING CART MARKET, BY MODE OF SALE, 2025-2030 (USD MILLION)
- TABLE 80 MIDDLE EAST & AFRICA: SMART SHOPPING CART MARKET, BY COUNTRY, 2025-2030 (USD MILLION)
- TABLE 81 ISRAEL: SMART SHOPPING CART MARKET, BY CART TYPE, 2025-2030 (USD MILLION)
- TABLE 82 ISRAEL: SMART SHOPPING CART MARKET, BY APPLICATION AREA, 2025-2030 (USD MILLION)
- TABLE 83 ISRAEL: SMART SHOPPING CART MARKET, BY MODE OF SALE, 2025-2030 (USD MILLION)
- TABLE 84 UAE: SMART SHOPPING CART MARKET, BY CART TYPE, 2025-2030 (USD MILLION)
- TABLE 85 UAE: SMART SHOPPING CART MARKET, BY APPLICATION AREA, 2025-2030 (USD MILLION)
- TABLE 86 UAE: SMART SHOPPING CART MARKET, BY MODE OF SALE, 2025-2030 (USD MILLION)
- TABLE 87 SOUTH AFRICA: SMART SHOPPING CART MARKET, BY CART TYPE, 2025-2030 (USD MILLION)
- TABLE 88 SOUTH AFRICA: SMART SHOPPING CART MARKET, BY APPLICATION AREA, 2025-2030 (USD MILLION)
- TABLE 89 SOUTH AFRICA: SMART SHOPPING CART MARKET, BY MODE OF SALE, 2025-2030 (USD MILLION)
- TABLE 90 REST OF MIDDLE EAST & AFRICA: SMART SHOPPING CART MARKET, BY CART TYPE, 2025-2030 (USD MILLION)
- TABLE 91 REST OF MIDDLE EAST & AFRICA: SMART SHOPPING CART MARKET, BY APPLICATION AREA, 2025-2030 (USD MILLION)
- TABLE 92 REST OF MIDDLE EAST & AFRICA: SMART SHOPPING CART MARKET, BY MODE OF SALE, 2025-2030 (USD MILLION)
- TABLE 93 LATIN AMERICA: SMART SHOPPING CART MARKET, BY CART TYPE, 2025-2030 (USD MILLION)
- TABLE 94 LATIN AMERICA: SMART SHOPPING CART MARKET, BY APPLICATION AREA, 2025-2030 (USD MILLION)
- TABLE 95 LATIN AMERICA: SMART SHOPPING CART MARKET, BY MODE OF SALE, 2025-2030 (USD MILLION)
- TABLE 96 LATIN AMERICA: SMART SHOPPING CART MARKET, BY COUNTRY, 2025-2030 (USD MILLION)
- TABLE 97 CHILE: SMART SHOPPING CART MARKET, BY CART TYPE, 2025-2030 (USD MILLION)
- TABLE 98 CHILE: SMART SHOPPING CART MARKET, BY APPLICATION AREA, 2025-2030 (USD MILLION)
- TABLE 99 CHILE: SMART SHOPPING CART MARKET, BY MODE OF SALE, 2025-2030 (USD MILLION)
- TABLE 100 MEXICO: SMART SHOPPING CART MARKET, BY CART TYPE, 2025-2030 (USD MILLION)
- TABLE 101 MEXICO: SMART SHOPPING CART MARKET, BY APPLICATION AREA, 2025-2030 (USD MILLION)
- TABLE 102 MEXICO: SMART SHOPPING CART MARKET, BY MODE OF SALE, 2025-2030 (USD MILLION)
- TABLE 103 REST OF LATIN AMERICA: SMART SHOPPING CART MARKET, BY CART TYPE, 2025-2030 (USD MILLION)
- TABLE 104 REST OF LATIN AMERICA: SMART SHOPPING CART MARKET, BY APPLICATION AREA, 2025-2030 (USD MILLION)
- TABLE 105 REST OF LATIN AMERICA: SMART SHOPPING CART MARKET, BY MODE OF SALE, 2025-2030 (USD MILLION)
- TABLE 106 OVERVIEW OF STRATEGIES ADOPTED BY KEY SMART SHOPPING CART MARKET PLAYERS, 2022-2025
- TABLE 107 SMART SHOPPING CART MARKET: DEGREE OF COMPETITION
- TABLE 108 SMART SHOPPING CART MARKET: REGION FOOTPRINT
- TABLE 109 SMART SHOPPING CART MARKET: APPLICATION AREA FOOTPRINT
- TABLE 110 SMART SHOPPING CART MARKET: MODE OF SALE FOOTPRINT
- TABLE 111 SMART SHOPPING CART MARKET: PRODUCT LAUNCHES AND ENHANCEMENTS, FEBRUARY 2021-OCTOBER 2025
- TABLE 112 SMART SHOPPING CART MARKET: DEALS, MARCH 2022-AUGUST 2025
- TABLE 113 AMAZON: COMPANY OVERVIEW
- TABLE 114 AMAZON: PRODUCTS/SOLUTIONS/SERVICES OFFERED
- TABLE 115 AMAZON: PRODUCT LAUNCHES
- TABLE 116 AMAZON: DEALS
- TABLE 117 CAPER: COMPANY OVERVIEW
- TABLE 118 CAPER: PRODUCTS/SOLUTIONS/SERVICES OFFERED
- TABLE 119 CAPER: DEALS
- TABLE 120 VEEVE: COMPANY OVERVIEW
- TABLE 121 VEEVE: PRODUCTS/SOLUTIONS/SERVICES OFFERED
- TABLE 122 VEEVE: PRODUCT LAUNCHES
- TABLE 123 VEEVE: DEALS
- TABLE 124 SHOPIC: COMPANY OVERVIEW
- TABLE 125 SHOPIC: PRODUCTS/SOLUTIONS/SERVICES OFFERED
- TABLE 126 SHOPIC: DEALS
- TABLE 127 SUPERHII: COMPANY OVERVIEW
- TABLE 128 SUPERHII: PRODUCTS/SOLUTIONS/SERVICES OFFERED
- TABLE 129 SUPERHII: PRODUCT LAUNCHES
- TABLE 130 TRACXPOINT: COMPANY OVERVIEW
- TABLE 131 TRACXPOINT: PRODUCTS/SOLUTIONS/SERVICES OFFERED
- TABLE 132 TRACXPOINT: DEALS
- TABLE 133 CUST2MATE: BUSINESS OVERVIEW
- TABLE 134 CUST2MATE: PRODUCTS/SOLUTIONS/SERVICES OFFERED
- TABLE 135 CUST2MATE: EXPANSIONS
- TABLE 136 SHEKEL: BUSINESS OVERVIEW
- TABLE 137 SHEKEL: PRODUCTS/SOLUTIONS/SERVICES OFFERED
- TABLE 138 FAYTECH: COMPANY OVERVIEW
- TABLE 139 FAYTECH: PRODUCTS/SOLUTIONS/SERVICES OFFERED
- TABLE 140 KBST: BUSINESS OVERVIEW
- TABLE 141 KBST: PRODUCTS/SOLUTIONS/SERVICES OFFERED
List of Figures
- FIGURE 1 SMART SHOPPING CART MARKET SEGMENTATION
- FIGURE 2 YEARS CONSIDERED
- FIGURE 3 SMART SHOPPING CART MARKET: RESEARCH DESIGN
- FIGURE 4 BREAKDOWN OF PRIMARY INTERVIEWS, BY COMPANY TYPE, DESIGNATION, AND REGION
- FIGURE 5 KEY INSIGHTS FROM INDUSTRY EXPERTS
- FIGURE 6 DATA TRIANGULATION
- FIGURE 7 RESEARCH METHODOLOGY: APPROACH
- FIGURE 8 MARKET SIZE ESTIMATION METHODOLOGY - APPROACH 1 (SUPPLY SIDE): REVENUE OF SMART SHOPPING CART MARKET
- FIGURE 9 MARKET SIZE ESTIMATION METHODOLOGY - APPROACH 2 BOTTOM-UP (DEMAND SIDE): COLLECTIVE REVENUE OF SMART SHOPPING CART VENDORS
- FIGURE 10 TOP-DOWN APPROACH
- FIGURE 11 BOTTOM-UP APPROACH
- FIGURE 12 MARKET SCENARIO
- FIGURE 13 GLOBAL SMART SHOPPING CART MARKET, 2025-2030
- FIGURE 14 MAJOR STRATEGIES ADOPTED BY KEY PLAYERS IN SMART SHOPPING CART MARKET, 2025
- FIGURE 15 DISRUPTIVE TRENDS INFLUENCING GROWTH OF SMART SHOPPING CART MARKET
- FIGURE 16 HIGH-GROWTH SEGMENTS IN SMART SHOPPING CART MARKET, 2025
- FIGURE 17 ASIA PACIFIC TO REGISTER FASTEST GROWTH DURING FORECAST PERIOD
- FIGURE 18 DIGITAL TRANSFORMATION AND CONSUMER DEMAND FUEL SMART CART MARKET BOOM
- FIGURE 19 DIRECT SEGMENT ACCOUNTED FOR LARGEST MARKET SHARE IN 2025
- FIGURE 20 SUPERMARKETS SEGMENT SET TO DOMINATE SMART SHOPPING CART MARKET IN 2025
- FIGURE 21 DIRECT SEGMENT TO ACCOUNT FOR LARGEST MARKET SHARE IN 2025
- FIGURE 22 SMART SHOPPING CART MARKET: DRIVERS, RESTRAINTS, OPPORTUNITIES, AND CHALLENGES
- FIGURE 23 PORTER'S FIVE FORCES ANALYSIS
- FIGURE 24 SMART SHOPPING CART MARKET: SUPPLY CHAIN ANALYSIS
- FIGURE 25 SMART SHOPPING CART MARKET: VALUE CHAIN ANALYSIS
- FIGURE 26 KEY PLAYERS IN SMART SHOPPING CART MARKET ECOSYSTEM
- FIGURE 27 AVERAGE SELLING PRICE TREND OF KEY PLAYERS FOR SMART SHOPPING CART PROVIDERS (USD)
- FIGURE 28 EXPORTS SCENARIO OF VEHICLES PUSHED OR DRAWN BY HAND AND OTHER VEHICLES NOT MECHANICALLY PROPELLED, BY COUNTRY, 2020-2024 (USD MILLION)
- FIGURE 29 IMPORTS OF TRAILERS AND SEMI-TRAILERS; OTHER VEHICLES, NOT MECHANICALLY PROPELLED, BY COUNTRY, 2020-2024 (USD MILLION)
- FIGURE 30 TRENDS/DISRUPTIONS IMPACTING CUSTOMER BUSINESS
- FIGURE 31 INVESTMENT AND FUNDING SCENARIO
- FIGURE 32 LIST OF MAJOR PATENTS
- FIGURE 33 USE CASES AND MARKET POTENTIAL OF GENERATIVE AI IN SMART SHOPPING CARTS
- FIGURE 34 SMART SHOPPING CART MARKET: DECISION-MAKING FACTORS
- FIGURE 35 INFLUENCE OF STAKEHOLDERS ON BUYING PROCESS FOR APPLICATION AREAS
- FIGURE 36 KEY BUYING CRITERIA FOR APPLICATION AREAS
- FIGURE 37 ADOPTION BARRIERS & INTERNAL CHALLENGES
- FIGURE 38 RETROFIT KITS SEGMENT TO GROW AT HIGHER CAGR DURING FORECAST PERIOD
- FIGURE 39 SUPERMARKETS SEGMENT TO GROW AT HIGHEST CAGR DURING FORECAST PERIOD
- FIGURE 40 DISTRIBUTOR SEGMENT TO GROW AT HIGHER CAGR DURING FORECAST PERIOD
- FIGURE 41 NORTH AMERICA: MARKET SNAPSHOT
- FIGURE 42 ASIA PACIFIC: MARKET SNAPSHOT
- FIGURE 43 SHARES OF LEADING COMPANIES IN SMART SHOPPING CART MARKET, 2025
- FIGURE 44 SMART SHOPPING CART MARKET: BRAND/PRODUCT COMPARISON
- FIGURE 45 COMPANY VALUATION, 2025
- FIGURE 46 FINANCIAL METRICS OF KEY VENDORS, 2025
- FIGURE 47 SMART SHOPPING CART MARKET: COMPANY EVALUATION MATRIX (MAJOR PLAYERS), 2025
- FIGURE 48 SMART SHOPPING CART MARKET: COMPANY FOOTPRINT
- FIGURE 49 AMAZON: COMPANY SNAPSHOT
- FIGURE 50 CUST2MATE: COMPANY SNAPSHOT


