


 |
市场调查报告书
商品编码
1237829
航空航天压力表市场—增长、趋势、COVID-19 的影响和预测2023-2028Aerospace Pressure Gauge Market - Growth, Trends, And Forecasts (2023 - 2028) |
||||||
※ 本网页内容可能与最新版本有所差异。详细情况请与我们联繫。
在预测期内,航空压力表市场预计将以超过 3% 的复合年增长率增长。
由于 COVID-19 大流行,全球航空业面临着前所未有的挑战。 大流行对航空业产生了重大影响,导致客运量大幅减少,并对新飞机的需求产生负面影响。 根据国际民航组织 (ICAO) 的一份报告,全球机场在 2020 年第一季度的全球客运量下降了 28.4%。 自 COVID-19 以来,由于管制放鬆和空中交通量增加,航空业已显着復苏,导致对飞机零件的需求增加。
由于航空旅行的增加,对新飞机的需求增加,从而创造了对飞机零部件的需求,从而推动了市场增长。 在飞机上,许多仪器测量压力以告知飞行员飞机的状态和飞行条件。 压敏仪表安装在飞行组和发动机组。 这些部件具有遥感和直读功能。 这些是飞机上最重要的仪器,可为飞行员提供准确的信息并保持安全运行。
对新飞机不断增长的需求以及对飞机现代化项目投资的增加正在推动市场的增长。 飞机上使用的压力表有不同类型,例如燃油压力表、液压压力表、歧管压力表和液压压力表。 飞机燃油压力表是一种测量和报告车辆油箱中剩余燃油量的装置。 因此,航空业的扩张预计将推动未来几年的市场增长。
航空压力表的市场趋势
数字压力表在预测期内将大幅增长
预计数字压力表领域在预测期内将经历显着增长。 数字压力表用于将压力转换为电子信号。 仪表在数字显示屏上显示压力,信号可用于控制设备。 Newbow Aerospace 推出了革命性的数字轮胎压力检查仪,校准精度为正负0.4%FS。 因此,增加对开发创新产品的投资正在推动市场的增长。
此外,空中交通量的增加、飞机系统现代化投资的增加以及航空领域研发支出的增加也在推动市场的增长。 根据国际航空运输协会的一份报告,航空业在大流行之后出现了强劲復苏。 到2024年,航空旅客总数将达到40亿人次。 报告称,到2021年将是2019年水平的47%。 这将导致机场数量增加,从而产生对此类飞机系统和组件的需求

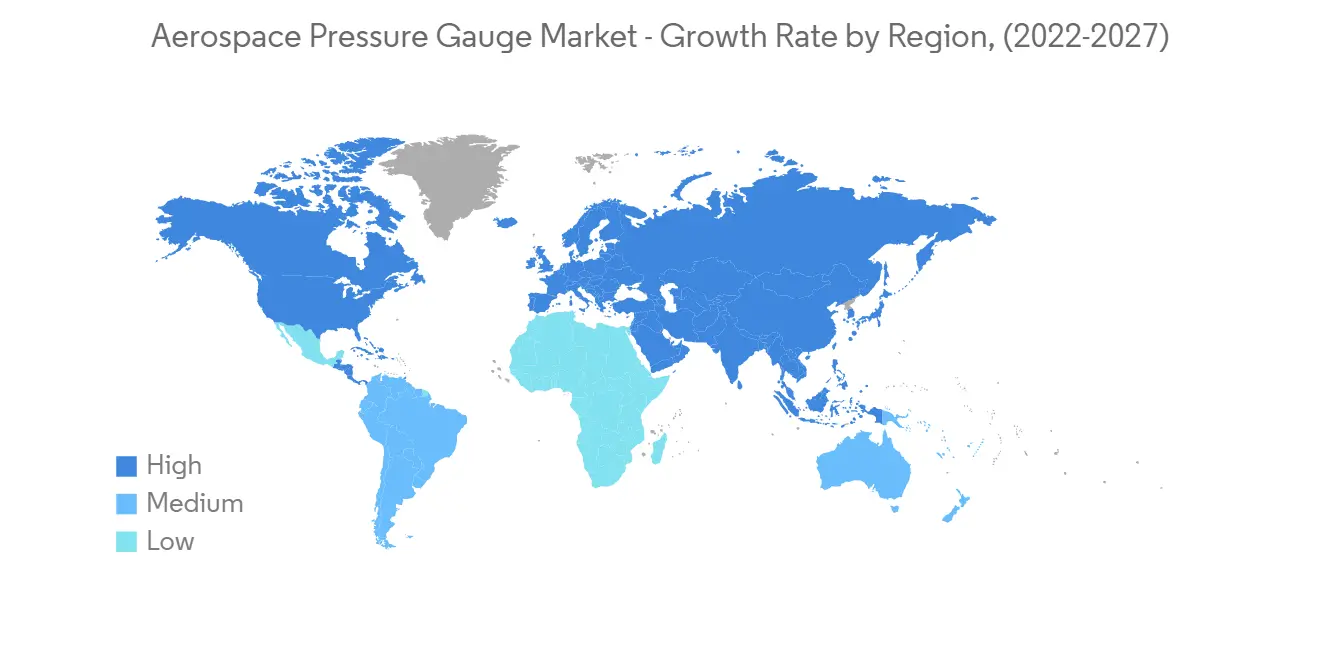
亚太地区预计在预测期内呈现最高增长
预计亚太地区在预测期内将出现显着增长。 这一增长是由航空客运量增加、机场数量增加以及中国和印度等新兴经济体航空支出增加推动的。 在亚太地区,中国、印度、日本和新加坡等主要国家都在计划新建或扩建现有机场。 机场的增加将导致对飞机零部件的需求增加,从而推动市场增长。
2020年2月,印度政府宣布到2024年将新建100座机场。 这创造了对各种航空航天组件的需求,例如压力表、温度计、传感器和其他系统。 此外,2022 年 6 月,印度联邦民航部长宣布到 2024-2025 年将增加 33 个货运站。 可支配收入的增加、快速的城市化以及建设新机场的投资增加,因此增加了容纳更多飞机的机会,从而导致对航空航天部件和系统的巨大需求,从而推动市场增长。
航天压力表市场竞争者分析
航空航天压力表市场本质上是分散的,其特点是有多家供应商提供各种类型的压力表。 然而,航空航天压力表市场的主要参与者包括 UMA Instruments、Ahlers Aerospace, Inc.、Alcor Inc.、Davtron Inc. 和 L3Harris Technologies, Inc. 等公司。 随着行业内竞争的加剧,主要原始设备製造商专注于为航空业开发创新解决方案。
2022 年 10 月:Parker Meggitt 推出了 iPRESS,这是一种用于航空的远程无线轮胎压力计。 未来,我们计划支持各种 Beechcraft 和 Cessna 产品。 这种新的压力表使用无线轮胎压力传感器 (WTPS) 和新的轮胎压力状态功能来改善用户在检查压力时的体验。 因此,主要公司对创新技术的投资增加和研发支出的增加将推动预测期内的市场增长。
其他福利。
- Excel 格式的市场预测 (ME) 表
- 3 个月的分析师支持
内容
第一章介绍
- 调查先决条件
- 调查范围
第二章研究方法论
第 3 章执行摘要
第四章市场动态
- 市场概览
- 市场驱动力
- 市场製约因素
- 搬运工 5 力分析
- 新进入者的威胁
- 买家/消费者的议价能力
- 供应商的议价能力
- 替代品的威胁
- 竞争对手之间的竞争强度
第 5 章市场细分
- 按类型
- 模拟
- 数字
- 通过使用
- 商业航空
- 军事航空
- 按地区
- 北美
- 美国
- 加拿大
- 欧洲
- 德国
- 英国
- 法国
- 俄罗斯
- 其他欧洲
- 亚太地区
- 印度
- 中国
- 日本
- 韩国
- 其他亚太地区
- 拉丁美洲
- 巴西
- 其他拉丁美洲地区
- 中东和非洲
- 阿拉伯联合酋长国
- 沙特阿拉伯
- 南非
- 其他中东和非洲地区
- 北美
第六章竞争格局
- 供应商市场份额
- 公司简介
- UMA Instruments
- Ahlers Aerospace Inc.
- L3Harris Technologies Inc.
- Davtron Inc.
- Alcor Inc.
- Flybox Avionics
- Howell Instruments Inc.
- Meggitt PLC
- Adams Aviation
- CIRCOR AEROSPACE PRODUCTS GROUP
第7章 市场机会与今后动向
The aerospace pressure gauge market is expected to grow at a CAGR of more than 3% during the forecast period.
The global aviation sector faced unmatched challenges due to the COVID-19 pandemic. The pandemic significantly affected the aviation sector, resulting in a drastic reduction in passenger traffic, which negatively affected demand for new aircraft. According to the International Civil Aviation Organization (ICAO) report, global airports have seen a 28.4% decline in global passenger traffic volumes for the first quarter of 2020. The aviation sector has witnessed significant recovery post-COVID-19 due to reduced restrictions and increased air traffic, which resulted in the growing demand for aircraft components.
Rising demand for new aircraft due to the growing number of air travelers creates demand for aircraft parts and components, which drives the market's growth. In an aircraft, the number of instruments informs the pilot about the aircraft's condition and flight situations through measuring pressure. The pressure-sensing instruments are installed in the flight group and the engine group. These components can be either remote sensing or direct reading. These are the most critical instruments on the aircraft and accurately inform the pilot to maintain safe operations.
An increase in demand for new aircraft and growing investment in aircraft modernization programs drive market growth. There are different types of pressure gauges, such as fuel pressure gauges, hydraulic pressure gauges, manifold pressure gauges, oil pressure gauges, and others used in an aircraft. An aircraft fuel pressure gauge is a device that measures and reports the quantity of fuel remaining in a vehicle's tank(s). thus, the growing expansion of the aviation sector will drive market growth in the coming years.
Aerospace Pressure Gauge Market Trends
Digital Pressure Gauge Will Showcase Significant Growth During the Forecast Period
The digital pressure gauges segment is estimated to have remarkable growth during the forecast period. These are used to convert the pressure to an electronic signal. The gauge shows the pressure using a digital display, furthermore, the signal can be used to control equipment. Newbow Aerospace launched an innovative range of digital tyre pressure checking gauges that are calibrated to an accuracy of +/-0.4% FS. Thus, growing investments in developing such innovative products propel market growth.
Furthermore, growing air traffic, rising investment in aircraft systems modernization, and growing spending on research and development in aviation boost the market growth. According to the International Air Transport Association report, the aviation sector witnessed a strong recovery after the pandemic. The overall number of air passengers will reach 4.0 billion by 2024. The report stated that in 2021, the numbers were 47% of 2019 levels. This leads to the growing number of airports which creates demand for such aircraft systems and components
Asia Pacific is Projected to Show Highest Growth During the Forecast Period
Asia-Pacific is projected to show remarkable growth during the forecast period. The growth is due to a rising number of air passengers, a growing number of airports, and increasing expenditure on the aviation sector from emerging economies such as China and India. In Asia-Pacific, major countries like China, India, Japan, and Singapore are planning to construct new airports and expand the existing airports. An increasing number of airports leads to rising demand for aircraft components, thus driving the growth of the market.
In February 2020, the Indian government announced that 100 new airports would be built by 2024. This will create demand for various aerospace components such as pressure gauges, temperature gauges, sensors, and other systems. Furthermore, in June 2022, the Union Civil Aviation Minister of India announced that the country will have 33 additional cargo terminals by 2024-2025. Thus, rising disposable income, rapid urbanization, and growing investment in constructing new airports will improve the opportunities to accommodate a higher number of aircraft and consequently lead to a huge demand for aerospace parts and systems, driving the market's growth.
Aerospace Pressure Gauge Market Competitor Analysis
The market of aerospace pressure gauges is fragmented in nature and is characterized by several suppliers who provide various types of pressure gauges. However, some of the prominent players in the aerospace pressure gauge market are UMA Instruments, Ahlers Aerospace, Inc., Alcor Inc., Davtron Inc., L3Harris Technologies, Inc., and others. With the growing competition in the industry, the key OEMs are focusing on the development of innovative solutions for the aviation sector.
October 2022: Parker Meggitt launched a long-range wireless tire pressure gauge for aviation, iPRESS. It will be available for a range of Beechcraft and Cessna products in the coming days. The new gauge will deliver an enhanced user experience while verifying inflation pressure through the use of a Wireless Tire Pressure Sensor (WTPS) and a new tire pressure status feature. Thus, rising investment in innovative technologies and increased spending on research and development from key players will boost market growth during the forecast period
Additional Benefits:
- The market estimate (ME) sheet in Excel format
- 3 months of analyst support
TABLE OF CONTENTS
1 INTRODUCTION
- 1.1 Study Assumptions
- 1.2 Scope of the Study
2 RESEARCH METHODOLOGY
3 EXECUTIVE SUMMARY
4 MARKET DYNAMICS
- 4.1 Market Overview
- 4.2 Market Drivers
- 4.3 Market Restraints
- 4.4 Porters 5 Force Analysis
- 4.4.1 Threat of New Entrants
- 4.4.2 Bargaining Power of Buyers/Consumers
- 4.4.3 Bargaining Power of Suppliers
- 4.4.4 Threat of Substitute Products
- 4.4.5 Intensity of Competitive Rivalry
5 MARKET SEGMENTATION
- 5.1 By Type
- 5.1.1 Analog
- 5.1.2 Digital
- 5.2 By Application
- 5.2.1 Commercial Aviation
- 5.2.2 Military Aviation
- 5.3 By Geography
- 5.3.1 North America
- 5.3.1.1 United States
- 5.3.1.2 Canada
- 5.3.2 Europe
- 5.3.2.1 Germany
- 5.3.2.2 United Kingdom
- 5.3.2.3 France
- 5.3.2.4 Russia
- 5.3.2.5 Rest of Europe
- 5.3.3 Asia Pacific
- 5.3.3.1 India
- 5.3.3.2 China
- 5.3.3.3 Japan
- 5.3.3.4 South Korea
- 5.3.3.5 Rest of Asia Pacific
- 5.3.4 Latin America
- 5.3.4.1 Brazil
- 5.3.4.2 Rest of Latin America
- 5.3.5 Middle East and Africa
- 5.3.5.1 United Arab Emirates
- 5.3.5.2 Saudi Arabia
- 5.3.5.3 South Africa
- 5.3.5.4 Rest of Middle East and Africa
- 5.3.1 North America
6 COMPETITIVE LANDSCAPE
- 6.1 Vendor Market Share**
- 6.2 Company Profiles*
- 6.2.1 UMA Instruments
- 6.2.2 Ahlers Aerospace Inc.
- 6.2.3 L3Harris Technologies Inc.
- 6.2.4 Davtron Inc.
- 6.2.5 Alcor Inc.
- 6.2.6 Flybox Avionics
- 6.2.7 Howell Instruments Inc.
- 6.2.8 Meggitt PLC
- 6.2.9 Adams Aviation
- 6.2.10 CIRCOR AEROSPACE PRODUCTS GROUP


