 |
市场调查报告书
商品编码
1273338
鲜梨市场 - COVID-19 的增长、趋势、影响和预测 (2023-2028)Fresh Pears Market - Growth, Trends, and Forecasts (2023 - 2028) |
||||||
※ 本网页内容可能与最新版本有所差异。详细情况请与我们联繫。
在预测期内,鲜梨市场的复合年增长率预计为 4.7%。
主要亮点
- 梨含有特殊的植物营养素,例如抗炎类黄酮、抗癌多酚和抗衰老类黄酮。 梨是维生素 C、维生素 K 和硼的最佳来源之一。 它可以减少炎症,这是大多数疾病的根本原因。 因此,这种水果的好处导致其主要在美国消费。 健康意识的增强和对有机水果的需求不断增长是新鲜梨市场增长的主要推动力。
- 日本政府的目标是到 2030 年扩大年度农产品出口,因为国内消费会随着人口减少而减少,特别是梨产业会考虑增加对各个市场的出口。
- 针对注重饮食习惯的高端消费者,在超市和保健食品店畅销。 根据粮农组织统计数据库,去年全球梨产量为 2560 万吨,收穫面积为 130 万公顷。 亚洲是最大的梨产区,去年产量为 2080 万吨。
新鲜梨市场趋势
美国鲜梨产量和人均消费量增加
梨是纤维和维生素 C 的重要来源,每个梨的热量仅为 100 卡路里。 它还不含钠、胆固醇和脂肪,并含有 190 毫克的钾。 根据美国农业部饮食指南,美国梨降低了几种慢性病的风险,对国内梨生产和消费产生了很高的需求,这将在未来几年加强市场。
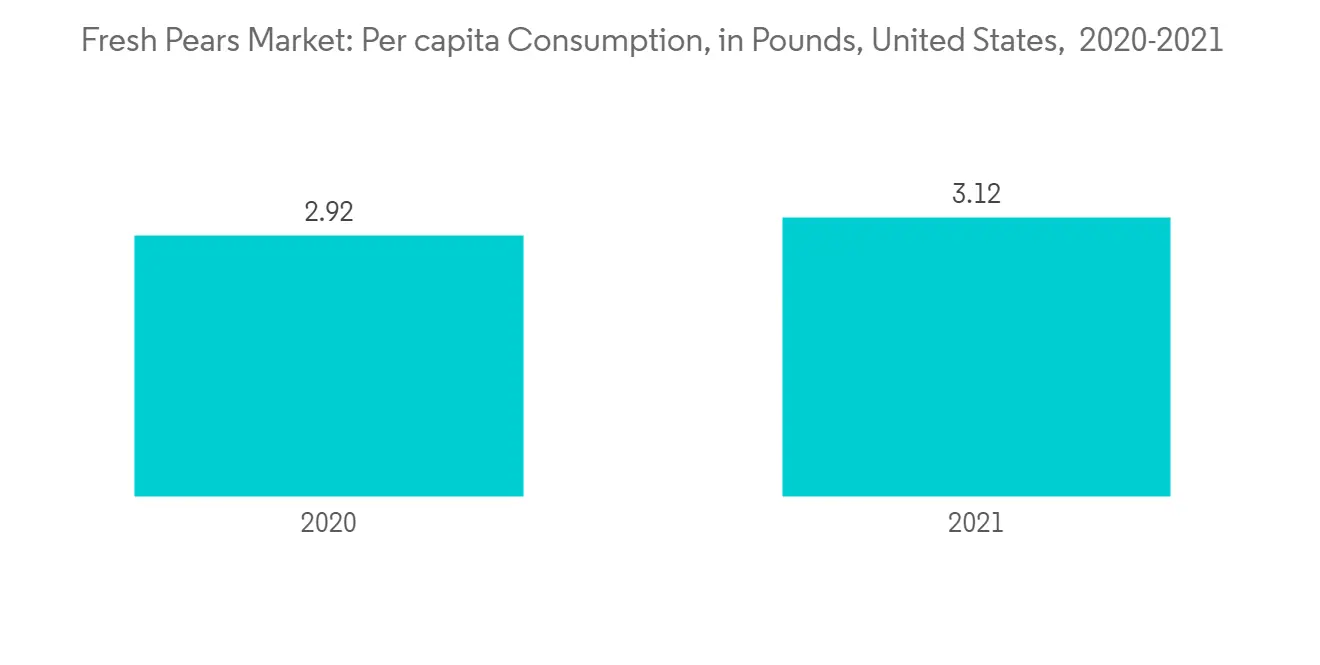
根据粮农组织统计数据,2021年美国梨总产量为6.3639亿吨,收穫面积为16876公顷。 从 2020 年到 2021 年,美国人均鲜梨消费量从 2.92 磅增加到 3.12 磅。
梨主要产于美国的华盛顿州和俄勒冈州。 华盛顿州是美国最大的鲜梨产地,占全国梨产量的一半。 俄勒冈州和华盛顿州占美国梨产量的 25%。 西北梨主要产于华盛顿州的亚基马和韦纳奇地区以及俄勒冈州的罗格河和胡德河地区。
然而,获得足够的劳动力是一个大问题,与劳动力相关的成本也很高。 因此,预计在预测期内,利用 GPS 和可变速率技术等现代农业技术施用肥料和水来维持生产的经济将提振市场。

中国是主要出口国和生产国
中国是世界上最大的梨生产国和出口国。 随着气温逐渐回升,中国梨的销售达到顶峰,清明节期间的国内采购和伊斯兰世界开斋节期间的海外采购,两个市场的需求增加,价格小幅上涨约 10%。 尤其是随着生鲜电商的快速发展,消费者现在只需在平台上点击一下,就可以购买到各种中国鲜梨。
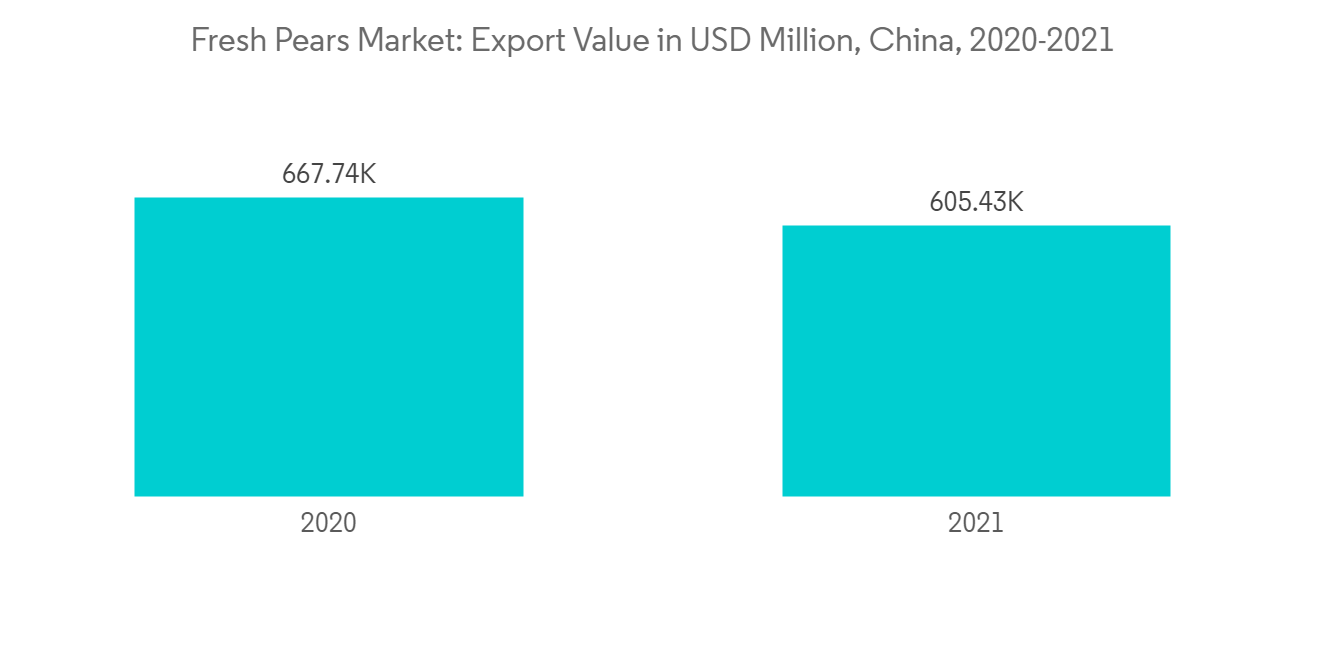
根据 FAOSTAT 的数据,2021 年中国将生产 1890 万吨鲜梨,出口 510138 吨,价值 605400 美元。 在中国,受全球大流行的影响,2021年的出口与上年相比略有下降。 据美国农业部对外农业服务局(FAS)称,预计中国产量同比增长近2%。 儘管干旱降低了中国东部省份的梨产量,但随着其他地区的丰收,预计总产量将增加。
2020年人均梨消费量最高的国家是阿根廷、意大利、美国和中国。 这样一来,世界范围内对梨的需求量不断增加,未来消费量有望增加,市场有望扩大。

鲜梨行业概况
其他福利:
- Excel 格式的市场预测 (ME) 表
- 3 个月的分析师支持
内容
第一章介绍
- 研究假设和市场定义
- 本次调查的范围
第二章研究方法论
第 3 章执行摘要
第四章市场动态
- 市场概览
- 市场驱动力
- 市场製约因素
- 供应链/价值链分析
第 5 章市场细分
- 地区
- 北美
- 美国
- 生产分析
- 消费市场分析(数量和价值)
- 进口市场分析(数量和价值)
- 出口市场分析(数量和价值)
- 价格趋势分析
- 加拿大
- 生产分析
- 消费分析(数量和价值)
- 进口市场分析(数量和价值)
- 出口市场分析(数量和价值)
- 价格趋势分析
- 墨西哥
- 生产分析
- 消费分析(数量和价值)
- 进口市场分析(数量和价值)
- 出口市场分析(数量和价值)
- 价格趋势分析
- 欧洲
- 德国
- 生产分析
- 消费市场分析(数量和价值)
- 进口市场分析(数量和价值)
- 出口市场分析(数量和价值)
- 价格趋势分析
- 波兰
- 生产分析
- 消费分析(数量和价值)
- 进口市场分析(数量和价值)
- 出口市场分析(数量和价值)
- 价格趋势分析
- 意大利
- 生产分析
- 消费分析(数量和价值)
- 进口市场分析(数量和价值)
- 出口市场分析(数量和价值)
- 价格趋势分析
- 法国
- 生产分析
- 消费分析(数量和价值)
- 进口市场分析(数量和价值)
- 出口市场分析(数量和价值)
- 价格趋势分析
- 土耳其人
- 生产分析
- 消费市场分析(数量和价值)
- 进口市场分析(数量和价值)
- 出口市场分析(数量和价值)
- 价格趋势分析
- 亚太地区
- 中国
- 生产分析
- 消费市场分析(数量和价值)
- 进口市场分析(数量和价值)
- 出口市场分析(数量和价值)
- 价格趋势分析
- 韩国
- 生产分析
- 消费市场分析(数量和价值)
- 进口市场分析(数量和价值)
- 出口市场分析(数量和价值)
- 价格趋势分析
- 日本
- 生产分析
- 消费分析(数量和价值)
- 进口市场分析(数量和价值)
- 出口市场分析(数量和价值)
- 价格趋势分析
- 印度
- 生产分析
- 消费市场分析(数量和价值)
- 进口市场分析(数量和价值)
- 出口市场分析(数量和价值)
- 价格趋势分析
- 南美洲
- 巴西
- 生产分析
- 消费市场分析(数量和价值)
- 进口市场分析(数量和价值)
- 出口市场分析(数量和价值)
- 价格趋势分析
- 阿根廷
- 生产分析
- 消费分析(数量和价值)
- 进口市场分析(数量和价值)
- 出口市场分析(数量和价值)
- 价格趋势分析
- 智利
- 生产分析
- 消费分析(数量和价值)
- 进口市场分析(数量和价值)
- 出口市场分析(数量和价值)
- 价格趋势分析
- 非洲
- 南非
- 生产分析
- 消费市场分析(数量和价值)
- 进口市场分析(数量和价值)
- 出口市场分析(数量和价值)
- 价格趋势分析
- 埃及
- 生产分析
- 消费分析(数量和价值)
- 进口市场分析(数量和价值)
- 出口市场分析(数量和价值)
- 价格趋势分析
- 北美
第六章市场机会与未来趋势
The fresh pears market was projected to register a CAGR of 4.7% during the forecast period.
Key Highlights
- Pears contain special phytonutrients, including anti-inflammatory flavonoids, anticancer polyphenols, and anti-aging flavonoids. Pear is one of the best sources of vitamin C, vitamin K, and boron. It can help lower inflammation, which is the root cause of most diseases. Thus, the benefits of this fruit have, in turn, driven its consumption, majorly across the United States. The increasing health consciousness and the increasing demand for organic fruits act as the major driving forces behind the growth of the fresh pears market.
- The Japanese government is looking to export to various markets, the pear industry in particular, as domestic consumption is set to decrease with a declining population, so the country is aiming to expand its annual agriculture exports by 2030.
- The sales have been high in supermarkets and health food stores, targeting upscale consumers with specialized eating habits. According to FAOSTAT, global pear production accounted for 25.6 million metric tons last year, with a harvested area of 1.3 million hectares. Asia was the largest pear-producing region, with a production of 20.8 million metric tons last year.
Fresh Pears Market Trends
Increasing Production and Per capita consumption of Fresh Pears in United States
Pears are an excellent source of fiber and a good source of vitamin C for only 100 calories per serving. They are sodium-free, cholesterol-free, and fat-free and contain 190 mg of potassium. The USDA Dietary Guidelines for American pears will reduce their risk of some chronic diseases and this makes the high demand for domestic production and consumption of pears in the country and this will strengthen the market in coming years.
According to FAOSTAT, 2021, the total pear production in the United States was 636,390 thousand metric tons with a harvested area of 16,876 hectares. The United States per capita consumption of fresh pears increased from 2.92 pounds to 3.12 pounds from 2020 to 2021.
Pear is mainly produced in Washington and Oregon in the United States. Washington's fresh pear production is the largest in the United States, accounting for half of the pear production in the country. Oregon and Washington account for 25% of pear production in the United States. Northwest pears are majorly produced in the Yakima and Wenatchee areas of Washington and the Rogue River Valley and Hood river areas of Oregon.
Although finding adequate labor is a major concern and the cost associated with the labor is also high. As a result, modern techniques of farming are utilized, including GPS and variable rate technologies, for fertilizer and water applications to maintain production in the economy which will boost the market during the forecasting period.

China is the Major Exporter and Producer
China is the largest producer and exporter of pears in the world. With the gradual rise in temperatures, China's pears entered their period of peak sales and were affected by the domestic stocking for the Qingming Festival and overseas stocking for Muslim countries' Eid al-Fitr, the demand in both markets increased, leading to a slight rise in the price of fresh pears by about 10%. Merchants managed to increase sales through online and offline channels, especially with the rapid development of fresh food e-commerce, consumers can buy a variety of China's fresh pears through an easy click on the platforms.
According to FAOSTAT, 2021, China's fresh pear production was 18.9 million ton, and exported 510,138 ton of pears worth USD 605.4 thousand. In China, the export value has slightly declined in 2021, compared to the previous year due to the impact of the pandemic all over the world. According to the Foreign Agricultural Service (FAS) of the United States Department of Agriculture, China is anticipated to produce almost 2% higher than in the previous year. Though the drought has reduced the pear harvest in China's eastern provinces, the total production is expected to increase because of abundant harvests in other regions.
The countries with the highest levels of pear per capita consumption in 2020 were Argentina, Italy, the United States, and China. Thus, the increasing demand for pear worldwide, the market is expected to continue an upward consumption and tends to grow the market in the coming years.

Fresh Pears Industry Overview
Additional Benefits:
- The market estimate (ME) sheet in Excel format
- 3 months of analyst support
TABLE OF CONTENTS
1 INTRODUCTION
- 1.1 Study Assumptions & Market Definitions
- 1.2 Scope of the Study
2 RESEARCH METHODOLOGY
3 EXECUTIVE SUMMARY
4 MARKET DYNAMICS
- 4.1 Market Overview
- 4.2 Market Drivers
- 4.3 Market Restraints
- 4.4 Supply Chain/Value Chain Analysis
5 MARKET SEGMENTATION
- 5.1 Geography
- 5.1.1 North America
- 5.1.1.1 United States
- 5.1.1.1.1 Production Analysis
- 5.1.1.1.2 Consumption Analysis (Volume and Value)
- 5.1.1.1.3 Import Market Analysis (Volume and Value)
- 5.1.1.1.4 Export Market Analysis (Volume and Value)
- 5.1.1.1.5 Price Trend Analysis
- 5.1.1.2 Canada
- 5.1.1.2.1 Production Analysis
- 5.1.1.2.2 Consumption Analysis (Volume and Value)
- 5.1.1.2.3 Import Market Analysis (Volume and Value)
- 5.1.1.2.4 Export Market Analysis (Volume and Value)
- 5.1.1.2.5 Price Trend Analysis
- 5.1.1.3 Mexico
- 5.1.1.3.1 Production Analysis
- 5.1.1.3.2 Consumption Analysis(Volume and Value)
- 5.1.1.3.3 Import Market Analysis (Volume and Value)
- 5.1.1.3.4 Export Market Analysis (Volume and Value)
- 5.1.1.3.5 Price Trend Analysis
- 5.1.2 Europe
- 5.1.2.1 Germany
- 5.1.2.1.1 Production Analysis
- 5.1.2.1.2 Consumption Analysis(Volume and Value)
- 5.1.2.1.3 Import Market Analysis (Volume and Value)
- 5.1.2.1.4 Export Market Analysis (Volume and Value)
- 5.1.2.1.5 Price Trend Analysis
- 5.1.2.2 Poland
- 5.1.2.2.1 Production Analysis
- 5.1.2.2.2 Consumption Analysis (Volume and Value)
- 5.1.2.2.3 Import Market Analysis (Volume and Value)
- 5.1.2.2.4 Export Market Analysis (Volume and Value)
- 5.1.2.2.5 Price Trend Analysis
- 5.1.2.3 Italy
- 5.1.2.3.1 Production Analysis
- 5.1.2.3.2 Consumption Analysis (Volume and Value)
- 5.1.2.3.3 Import Market Analysis (Volume and Value)
- 5.1.2.3.4 Export Market Analysis (Volume and Value)
- 5.1.2.3.5 Price Trend Analysis
- 5.1.2.4 France
- 5.1.2.4.1 Production Analysis
- 5.1.2.4.2 Consumption Analysis (Volume and Value)
- 5.1.2.4.3 Import Market Analysis (Volume and Value)
- 5.1.2.4.4 Export Market Analysis (Volume and Value)
- 5.1.2.4.5 Price Trend Analysis
- 5.1.2.5 Turkey
- 5.1.2.5.1 Production Analysis
- 5.1.2.5.2 Consumption Analysis (Volume and Value)
- 5.1.2.5.3 Import Market Analysis (Volume and Value)
- 5.1.2.5.4 Export Market Analysis (Volume and Value)
- 5.1.2.5.5 Price Trend Analysis
- 5.1.3 Asia Pacific
- 5.1.3.1 China
- 5.1.3.1.1 Production Analysis
- 5.1.3.1.2 Consumption Analysis (Volume and Value)
- 5.1.3.1.3 Import Market Analysis (Volume and Value)
- 5.1.3.1.4 Export Market Analysis (Volume and Value)
- 5.1.3.1.5 Price Trend Analysis
- 5.1.3.2 South Korea
- 5.1.3.2.1 Production Analysis
- 5.1.3.2.2 Consumption Analysis (Volume and Value)
- 5.1.3.2.3 Import Market Analysis (Volume and Value)
- 5.1.3.2.4 Export Market Analysis (Volume and Value)
- 5.1.3.2.5 Price Trend Analysis
- 5.1.3.3 Japan
- 5.1.3.3.1 Production Analysis
- 5.1.3.3.2 Consumption Analysis (Volume and Value)
- 5.1.3.3.3 Import Market Analysis (Volume and Value)
- 5.1.3.3.4 Export Market Analysis (Volume and Value)
- 5.1.3.3.5 Price Trend Analysis
- 5.1.3.4 India
- 5.1.3.4.1 Production Analysis
- 5.1.3.4.2 Consumption Analysis (Volume and Value)
- 5.1.3.4.3 Import Market Analysis (Volume and Value)
- 5.1.3.4.4 Export Market Analysis (Volume and Value)
- 5.1.3.4.5 Price Trend Analysis
- 5.1.4 South America
- 5.1.4.1 Brazil
- 5.1.4.1.1 Production Analysis
- 5.1.4.1.2 Consumption Analysis (Volume and Value)
- 5.1.4.1.3 Import Market Analysis (Volume and Value)
- 5.1.4.1.4 Export Market Analysis (Volume and Value)
- 5.1.4.1.5 Price Trend Analysis
- 5.1.4.2 Argentina
- 5.1.4.2.1 Production Analysis
- 5.1.4.2.2 Consumption Analysis (Volume and Value)
- 5.1.4.2.3 Import Market Analysis (Volume and Value)
- 5.1.4.2.4 Export Market Analysis (Volume and Value)
- 5.1.4.2.5 Price Trend Analysis
- 5.1.4.3 Chile
- 5.1.4.3.1 Production Analysis
- 5.1.4.3.2 Consumption Analysis (Volume and Value)
- 5.1.4.3.3 Import Market Analysis (Volume and Value)
- 5.1.4.3.4 Export Market Analysis (Volume and Value)
- 5.1.4.3.5 Price Trend Analysis
- 5.1.5 Africa
- 5.1.5.1 South Africa
- 5.1.5.1.1 Production Analysis
- 5.1.5.1.2 Consumption Analysis (Volume and Value)
- 5.1.5.1.3 Import Market Analysis (Volume and Value)
- 5.1.5.1.4 Export Market Analysis (Volume and Value)
- 5.1.5.1.5 Price Trend Analysis
- 5.1.5.2 Egypt
- 5.1.5.2.1 Production Analysis
- 5.1.5.2.2 Consumption Analysis (Volume and Value)
- 5.1.5.2.3 Import Market Analysis (Volume and Value)
- 5.1.5.2.4 Export Market Analysis (Volume and Value)
- 5.1.5.2.5 Price Trend Analysis
- 5.1.1 North America


