


 |
市场调查报告书
商品编码
1273486
芋头市场 - COVID-19 的增长、趋势、影响和预测 (2023-2028)Taro Market - Growth, Trends, and Forecasts (2023 - 2028) |
||||||
※ 本网页内容可能与最新版本有所差异。详细情况请与我们联繫。
在预测期内,全球芋头市场预计将以 3.5% 的复合年增长率增长。
主要亮点
- 芋头 (Colocasia esculenta) 富含碳水化合物,是小麦粉的良好替代品。 然而,众所周知,它经常被资源匮乏的农民种植,因为即使在贫瘠的土壤条件下,它也可以在很少或没有作物投入的情况下产生合理的产量,因此是粮食安全的受益者。应该是有帮助的。 芋头粉也越来越受欢迎,预计将在未来几年推动市场增长。
- 芋头是锦葵科植物中栽培最广泛的品种。 美国、澳大利亚、日本和新西兰等国家是主要的进口市场。 主要生产国是中国、厄瓜多尔、哥斯达黎加、斐济和印度尼西亚。
- 在全球范围内,北美在芋头进口中占主导地位。 例如,2021年,美国将进口芋头占总进口量的35.7%。 北美和亚太国家不断增长的需求推动了芋头的生产。 2021年芋头产量1230万吨。 由于全球大流行的影响,这比上一年的 1260 万吨产量略有下降。
芋头市场趋势
芋头产量稳定
芋头是碳水化合物的极好来源,可用于婴儿食品和适合糖尿病患者的低血糖食品。 芋头块茎的淀粉分子比马铃薯、玉米和小麦小,可用作化妆品和药片的粘合剂。 球茎和叶子都含有优质蛋白质,并且是磷、钾、钙和现成铁的来源。 此外,芋头块茎中的淀粉有可能解决世界塑料问题,并可用于製造可随时间降解的塑料。 芋头因其高营养价值而在世界范围内需求量很大。 因此,农民们正在增加芋头的种植面积。
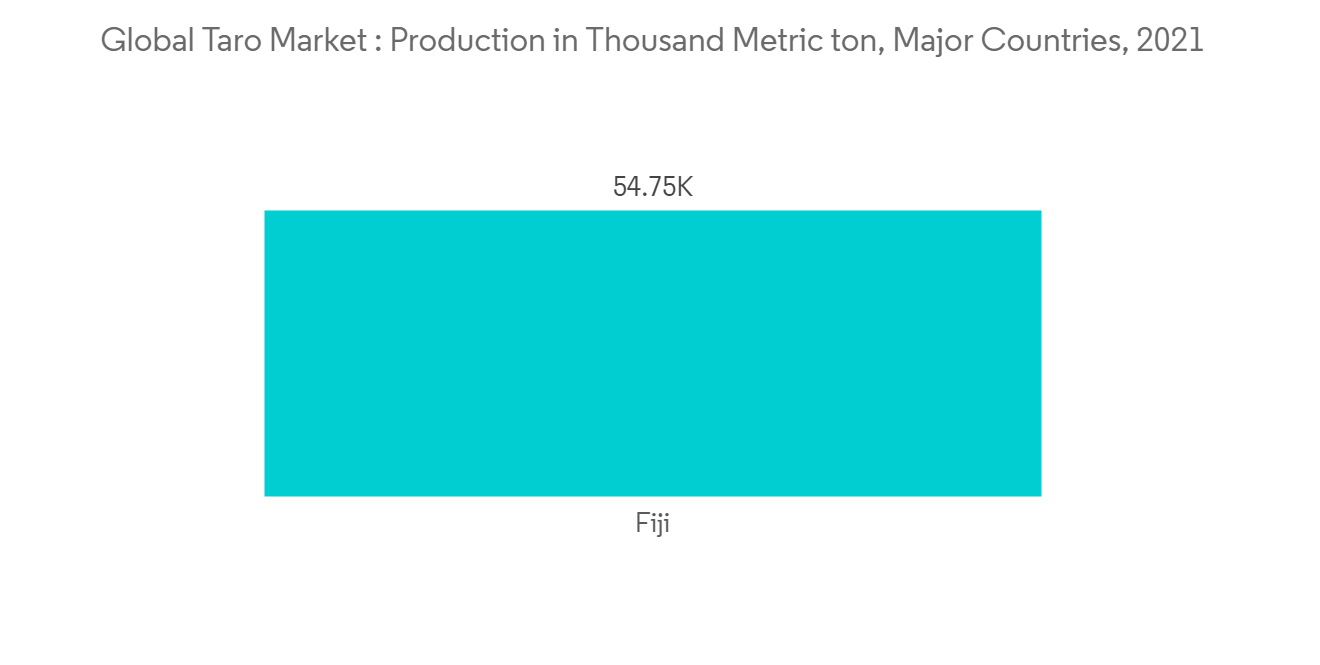
根据 FAOSTAT 的数据,受全球大流行的影响,芋头产量为 1230 万吨,略低于上年的 1260 万吨。 中国、厄瓜多尔、哥斯达黎加、斐济和印度尼西亚等主要生产国当年的产量占世界的近86.3%,其中中国产量最高,达190万吨,其次是斐济。 这将在预测期内提振亚洲地区的芋头市场。
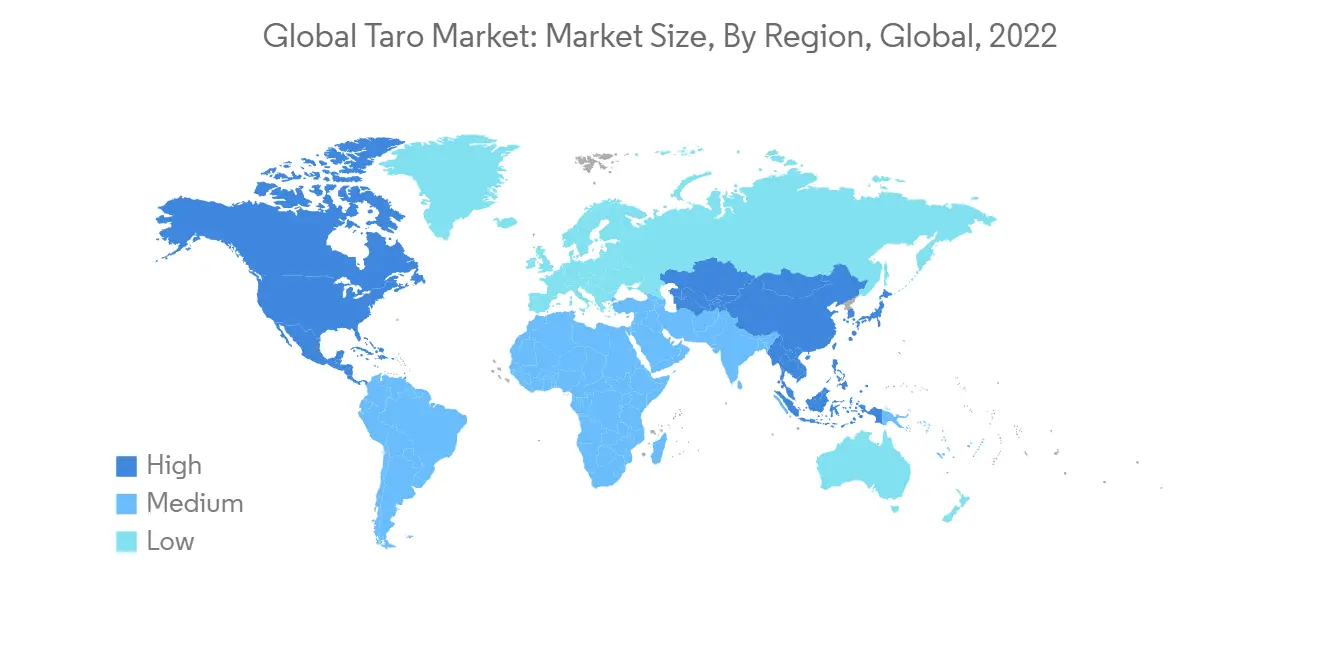
北美主导世界进口
北美是芋头的最大市场,由于消费者需求旺盛,它在全球市场中占有压倒性的份额。 在餐馆里,芋头最常用于製作薯片,是玉米片或薯片的健康替代品。 根据 ITC Trade 的数据,2021 年全球进口额将达到 18125.8 万美元,比 2020 年增长 21%。 2021年,美国和加拿大位居主要进口国之列,其中美国是北美地区最大的芋头进口国。
2021年美国进口芋头价值6467.4万美元,占全球进口的35.9%。 厄瓜多尔、墨西哥和哥斯达黎加是美国的主要出口国。 据ITC Trade称,2021年,厄瓜多尔将向美国出口筒仓3530.9万美元,墨西哥902.1万美元,哥斯达黎加733.6万美元。
此外,cocoyam 的高营养价值可能导致其在欧洲和美国的新市场中被用作其他蔬菜(例如菠菜)的替代品。 预计这将在预测期内推动市场扩张。
芋头产业概况
其他福利:
- Excel 格式的市场预测 (ME) 表
- 3 个月的分析师支持
内容
第一章介绍
- 研究假设和市场定义
- 本次调查的范围
第二章研究方法论
第 3 章执行摘要
第四章市场动态
- 市场概览
- 市场驱动力
- 市场製约因素
- 价值链分析
第 5 章市场细分
- 地区
- 北美
- 美国
- 生产分析
- 消费市场分析和市场价值
- 进口市场分析(数量和价值)
- 出口市场分析(数量和价值)
- 价格趋势分析
- 加拿大
- 生产分析
- 消费市场分析和市场价值
- 进口市场分析(数量和价值)
- 出口市场分析(数量和价值)
- 价格趋势分析
- 欧洲
- 法国
- 生产分析
- 消费市场分析和市场价值
- 进口市场分析(数量和价值)
- 出口市场分析(数量和价值)
- 价格趋势分析
- 德国
- 生产分析
- 消费市场分析和市场价值
- 进口市场分析(数量和价值)
- 出口市场分析(数量和价值)
- 价格趋势分析
- 波兰
- 生产分析
- 消费市场分析和市场价值
- 进口市场分析(数量和价值)
- 出口市场分析(数量和价值)
- 价格趋势分析
- 俄罗斯
- 生产分析
- 消费市场分析和市场价值
- 进口市场分析(数量和价值)
- 出口市场分析(数量/价值)
- 价格趋势分析
- 智利
- 生产分析
- 消费市场分析和市场价值
- 进口市场分析(数量和价值)
- 出口市场分析(数量和价值)
- 价格趋势分析
- 亚太地区
- 中国
- 产量分析
- 消费市场分析和市场价值
- 进口市场分析(数量和价值)
- 出口市场分析(数量和价值)
- 价格趋势分析
- 日本
- 生产分析
- 消费市场分析和市场价值
- 进口市场分析(数量和价值)
- 出口市场分析(数量和价值)
- 价格趋势分析
- 马来西亚
- 生产分析
- 消费市场分析和市场价值
- 进口市场分析(数量和价值)
- 出口市场分析(数量/价值)
- 价格趋势分析
- 澳大利亚
- 生产分析
- 消费市场分析和市场价值
- 进口市场分析(数量和价值)
- 出口市场分析(数量和价值)
- 价格趋势分析
- 印度
- 生产分析
- 消费市场分析和市场价值
- 进口市场分析(数量和价值)
- 出口市场分析(数量/价值)
- 价格趋势分析
- 南美洲
- 巴西
- 生产分析
- 消费市场分析和市场价值
- 进口市场分析(数量和价值)
- 出口市场分析(数量和价值)
- 价格趋势分析
- 阿根廷
- 生产分析
- 消费市场分析和市场价值
- 进口市场分析(数量和价值)
- 出口市场分析(数量和价值)
- 价格趋势分析
- 中东和非洲
- 土耳其人
- 生产分析
- 消费市场分析和市场价值
- 进口市场分析(数量/价格)
- 出口市场分析(数量/价值)
- 价格趋势分析
- 南非
- 生产分析
- 消费市场分析和市场价值
- 进口市场分析(数量和价值)
- 出口市场分析(数量/价值)
- 价格趋势分析
- 北美
第六章市场机会与未来趋势
The Global Taro Market is projected to register a CAGR of 3.5% during the forecast period.
Key Highlights
- Taro (Colocasia esculenta) is rich in carbohydrates and a good replacement for wheat flour. However, it is well-known to farmers for its ability to produce a reasonable yield in poor soil conditions with less or no farm inputs and often grown by resource-limited farmers, and is regarded as a good source of food security. Taro powder is also becoming popular, and this will boost the growth of the market in the coming years.
- Taro is the most widely cultivated species in the family Araceae, which is used as a vegetable. Countries such as the United States, Australia, Japan, and New Zealand are the key import market. Major producing countries are China, Ecuador, Costa Rica, Fiji, and Indonesia.
- Globally, North America is dominating taro imports. For instance, in 2021, the United States imported 35.7% of the total taro imports. Rising demand from North America and Asia-Pacific countries is driving taro production. In 2021, taro production was 12.3 million tons. This was which is slightly declined compared to the previous year's production which is 12.6 million metric ton due to the pandemic effect in the world.
Taro Market Trends
Strong Growth in Taro Production
Taro is a great source of carbohydrate used in infant weaning diets and low glycaemic index foods suitable for diabetics. Its tuber has starch molecules which are smaller than those of potato, corn and wheat and can be used in cosmetics and in pharmaceuticals as binders in tablets. Both corms and leaves contain good-quality protein and are good sources of phosphorus, potassium, calcium, and readily available iron. Moreover, the starch in taro's tuber has the capacity to end the world's plastic menace and it can be used to make plastic that degenerates over time. Due to its nutritional benefit and other industrial, the demand for the taro is increasing across the globe. To satisfy the rising demand, farmers are increasing the area cultivated under taro.
According to FAOSTAT, taro production was 12.3 million ton which slightly declined compared to the previous year's production which is 12.6 million metric ton due to the pandemic effect in the world. During the same year, nearly 86.3% of global production was dominated by major producing countries such as China, Ecuador, Costa Rica, Fiji, and Indonesia in which China showed the highest production value compared to all countries with 1.9 million metric ton followed by Fiji. This will boost the taro market in the Asia region during the forecasting period.
North America Dominates the Global Imports
North America is the largest market for Taro which dominates globally due to the high consumer demand. In restaurants, Taro root is most commonly used to make chips and is a healthier alternative to corn or potato chips. According to ITC Trade, in 2021, Global import value was valued at USD 181,258 thousand, which increased by 21% compared to 2020. In 2021, the United States and Canada were among the major importing countries, and the United States is the largest importer of taro in the North American region.
In 2021, the United States imported taros worth USD 64,674 thousand, depicting 35.9% of the global imports. Ecuador, Mexico, and Costa Rica are the major exporting countries to the United States. According to ITC Trade, in 2021, Ecuador exported USD 35,309 thousand worth of taros to the United States, Mexico exported USD 9,021 thousand worth of taros, and the exports from Costa Rica were valued at USD 7,336 thousand.
Moreover, the high nutritional value of cocoyam could be explored in new markets in Europe and the United States of America to substitute for other vegetables, such as spinach. This is expected to lead to the market growth over the forecast period.
Taro Industry Overview
Additional Benefits:
- The market estimate (ME) sheet in Excel format
- 3 months of analyst support
TABLE OF CONTENTS
1 INTRODUCTION
- 1.1 Study Assumptions & Market Definitions
- 1.2 Scope of the Study
2 RESEARCH METHODOLOGY
3 EXECUTIVE SUMMARY
4 MARKET DYNAMICS
- 4.1 Market Overview
- 4.2 Market Drivers
- 4.3 Market Restraints
- 4.4 Value Chain Analysis
5 MARKET SEGMENTATION
- 5.1 Geography
- 5.1.1 North America
- 5.1.1.1 United States
- 5.1.1.1.1 Production Analysis
- 5.1.1.1.2 Consumption Analysis and Market Value
- 5.1.1.1.3 Import Market Analysis (Volume and Value)
- 5.1.1.1.4 Export Market Analysis (Volume and Value)
- 5.1.1.1.5 Price Trend Analysis
- 5.1.1.2 Canada
- 5.1.1.2.1 Production Analysis
- 5.1.1.2.2 Consumption Analysis and Market Value
- 5.1.1.2.3 Import Market Analysis (Volume and Value)
- 5.1.1.2.4 Export Market Analysis (Volume and Value)
- 5.1.1.2.5 Price Trend Analysis
- 5.1.2 Europe
- 5.1.2.1 France
- 5.1.2.1.1 Production Analysis
- 5.1.2.1.2 Consumption Analysis and Market Value
- 5.1.2.1.3 Import Market Analysis (Volume and Value)
- 5.1.2.1.4 Export Market Analysis (Volume and Value)
- 5.1.2.1.5 Price Trend Analysis
- 5.1.2.2 Germany
- 5.1.2.2.1 Production Analysis
- 5.1.2.2.2 Consumption Analysis and Market Value
- 5.1.2.2.3 Import Market Analysis (Volume and Value)
- 5.1.2.2.4 Export Market Analysis (Volume and Value)
- 5.1.2.2.5 Price Trend Analysis
- 5.1.2.3 Poland
- 5.1.2.3.1 Production Analysis
- 5.1.2.3.2 Consumption Analysis and Market Value
- 5.1.2.3.3 Import Market Analysis (Volume and Value)
- 5.1.2.3.4 Export Market Analysis (Volume and Value)
- 5.1.2.3.5 Price Trend Analysis
- 5.1.2.4 Russia
- 5.1.2.4.1 Production Analysis
- 5.1.2.4.2 Consumption Analysis and Market Value
- 5.1.2.4.3 Import Market Analysis (Volume and Value)
- 5.1.2.4.4 Export Market Analysis (Volume and Value)
- 5.1.2.4.5 Price Trend Analysis
- 5.1.2.5 Chile
- 5.1.2.5.1 Production Analysis
- 5.1.2.5.2 Consumption Analysis and Market Value
- 5.1.2.5.3 Import Market Analysis (Volume and Value)
- 5.1.2.5.4 Export Market Analysis (Volume and Value)
- 5.1.2.5.5 Price Trend Analysis
- 5.1.3 Asia-Pacific
- 5.1.3.1 China
- 5.1.3.1.1 Production Analysis
- 5.1.3.1.2 Consumption Analysis and Market Value
- 5.1.3.1.3 Import Market Analysis (Volume and Value)
- 5.1.3.1.4 Export Market Analysis (Volume and Value)
- 5.1.3.1.5 Price Trend Analysis
- 5.1.3.2 Japan
- 5.1.3.2.1 Production Analysis
- 5.1.3.2.2 Consumption Analysis and Market Value
- 5.1.3.2.3 Import Market Analysis (Volume and Value)
- 5.1.3.2.4 Export Market Analysis (Volume and Value)
- 5.1.3.2.5 Price Trend Analysis
- 5.1.3.3 Malaysia
- 5.1.3.3.1 Production Analysis
- 5.1.3.3.2 Consumption Analysis and Market Value
- 5.1.3.3.3 Import Market Analysis (Volume and Value)
- 5.1.3.3.4 Export Market Analysis (Volume and Value)
- 5.1.3.3.5 Price Trend Analysis
- 5.1.3.4 Australia
- 5.1.3.4.1 Production Analysis
- 5.1.3.4.2 Consumption Analysis and Market Value
- 5.1.3.4.3 Import Market Analysis (Volume and Value)
- 5.1.3.4.4 Export Market Analysis (Volume and Value)
- 5.1.3.4.5 Price Trend Analysis
- 5.1.3.5 India
- 5.1.3.5.1 Production Analysis
- 5.1.3.5.2 Consumption Analysis and Market Value
- 5.1.3.5.3 Import Market Analysis (Volume and Value)
- 5.1.3.5.4 Export Market Analysis (Volume and Value)
- 5.1.3.5.5 Price Trend Analysis
- 5.1.4 South America
- 5.1.4.1 Brazil
- 5.1.4.1.1 Production Analysis
- 5.1.4.1.2 Consumption Analysis and Market Value
- 5.1.4.1.3 Import Market Analysis (Volume and Value)
- 5.1.4.1.4 Export Market Analysis (Volume and Value)
- 5.1.4.1.5 Price Trend Analysis
- 5.1.4.2 Argentina
- 5.1.4.2.1 Production Analysis
- 5.1.4.2.2 Consumption Analysis and Market Value
- 5.1.4.2.3 Import Market Analysis (Volume and Value)
- 5.1.4.2.4 Export Market Analysis (Volume and Value)
- 5.1.4.2.5 Price Trend Analysis
- 5.1.5 Middle East And Africa
- 5.1.5.1 Turkey
- 5.1.5.1.1 Production Analysis
- 5.1.5.1.2 Consumption Analysis and Market Value
- 5.1.5.1.3 Import Market Analysis (Volume and Value)
- 5.1.5.1.4 Export Market Analysis (Volume and Value)
- 5.1.5.1.5 Price Trend Analysis
- 5.1.5.2 South Africa
- 5.1.5.2.1 Production Analysis
- 5.1.5.2.2 Consumption Analysis and Market Value
- 5.1.5.2.3 Import Market Analysis (Volume and Value)
- 5.1.5.2.4 Export Market Analysis (Volume and Value)
- 5.1.5.2.5 Price Trend Analysis
- 5.1.1 North America