


 |
市场调查报告书
商品编码
1273542
热流体市场 - 增长、趋势、COVID-19 的影响、预测 (2023-2028)Thermic Fluid Market - Growth, Trends, and Forecasts (2023 - 2028) |
||||||
※ 本网页内容可能与最新版本有所差异。详细情况请与我们联繫。
在预测期内,导热流体市场预计将以超过 5% 的复合年增长率增长。
COVID-19 对 2020 年的市场产生了负面影响。 鑑于大流行的情况,炼油厂全面减产,许多化学品製造活动暂时停止,从而减少了研究市场的需求。 然而,在大流行期间对该药物的需求增加,市场研究增加了需求。 然而,该行业在大流行后復苏,预计在预测期内将延续这一趋势。
主要亮点
- 预计市场增长将受到石油和天然气行业需求增加的推动,该行业严重依赖于传热介质的使用,以及对聚光光伏的需求增加。
- 另一方面,原材料价格的波动预计会阻碍市场增长。
- 开发生物基传热介质的巨大潜力可能会为所研究的市场提供重要的增长机会。
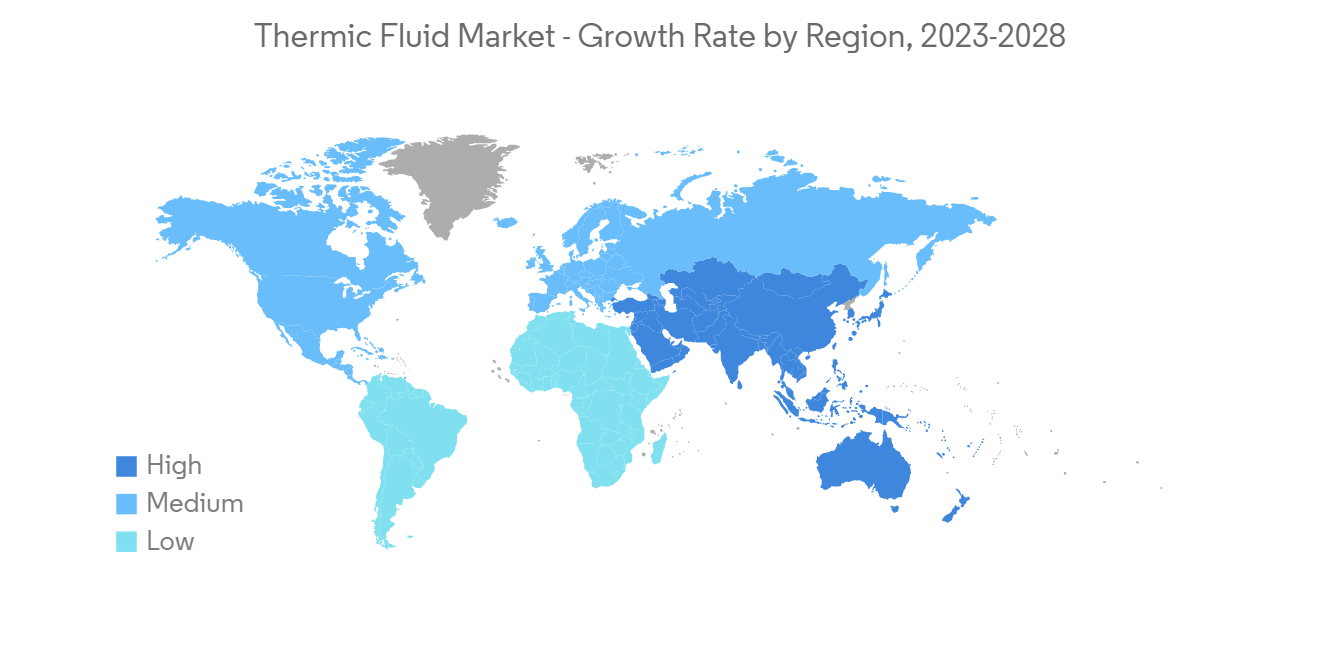
- 亚太地区拥有最高的炼油能力以及在化学和製药行业的全球影响力,在热流体市场份额中处于领先地位。 预计这一趋势将在预测期内继续。
热流体市场趋势
石油和天然气行业的广泛需求
- 石油和天然气行业不断扩大传热介质的使用范围,以满足不断增长的能源需求。 热流体用于执行石油和天然气行业的基本操作,例如石油和天然气加工、天然气精炼和提炼、气体液化以及沥青加工和储存。
- 导热液主要用于天然气加工中的气体脱硫、乙二醇脱水和分馏等阶段。 用于气体脱硫和乙二醇脱水阶段的再生器由锅炉加热,锅炉由热流体加热。 此外,分馏过程使用热流体来加热安装在每个蒸馏塔中的再沸器。
- 根据《BP世界能源统计年鑑2022》,2021年全球天然气产量为40369亿立方米,同比增长约4.5%。 天然气加工过程中对热流体的需求不断增加。
- 热流体也用于净化程序。 特别是,它用作分馏塔再沸器和塔顶冷却冷凝器中的加热流体。 据《BP世界能源统计年鑑2022》,全球炼油总吞吐量约为7922.9万桶/日,较上年增长5%。 美国绝对是最大的,每天有 15,148,000 桶,其次是中国。
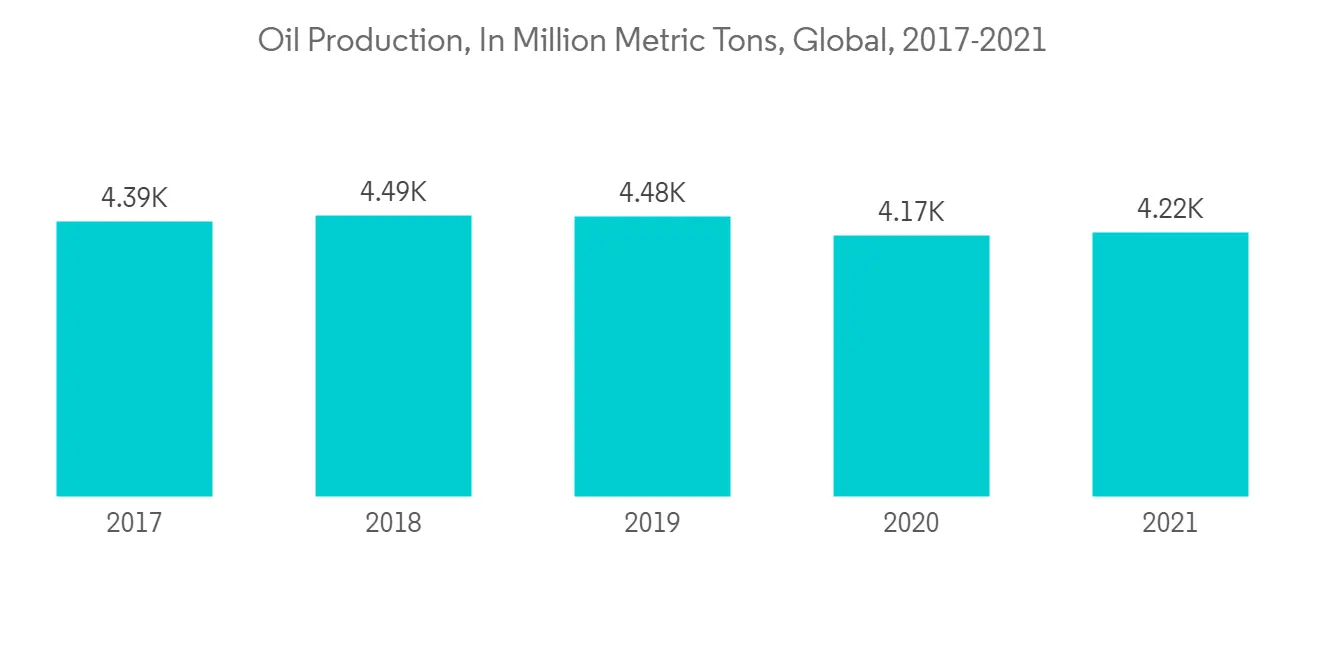
- 此外,与上一年相比,全球石油产量略有增加。 根据《BP 世界能源 2022 统计年鑑》,2021 年的产量约为 42.21 亿吨。
- 根据经济分析局的数据,2022 年前三季度美国石油和天然气开采业的增加值约为 1.16 万亿美元,比前三季度增长 43%比去年四季度大幅增加。 该值按季节性调整后的年率增加。
- 油气业务未来发展的招股书建议,石油勘探以长远发展为目标,提倡导热液并用。 此外,随着碳氢化合物的发现随着时间的推移变得越来越低产,每个石油单位需要进行更多的渗透。
- 因此,预计上述因素将在未来几年对导热液市场产生重大影响。
亚太地区主导市场
- 亚太地区在全球热流体市场份额中占据主导地位。 可以说,这一地区是化工、製药、石油炼製等製造业的繁荣区。
- 根据《BP 世界能源统计年鑑 2022》,2021 年亚太地区炼油总产能将同比增长 3.3% 至 2950 万桶/日。
- 亚太地区对天然气的生产和使用也有重大影响。 根据BP Statistics《世界能源2022年版》,2021年亚太地区天然气消费总量为9183亿立方米,较上年增长约5%。
- 製药业和化学加工也是使用热流体的行业示例。 印度化学品和化肥部数据显示,2022-23 年(至 2022 年 7 月)化学品产量从去年同期的 410 万吨增长 5.73% 至 435 万吨。
- IQVIA 估计,作为世界第二大医药消费国的中国在未来五年内将增长 8%,而支出将增长 19%,增速低于以往。重点将放在扩大获得创新药物。 印度的製药业也有望在2030年达到1300亿美元(印度品牌资产基金会(IBEF)的建议)。 该国是世界上最大的疫苗生产国,到 2021 年将占所有疫苗的 60%,并且是世界第三大药品生产国。
- 食品和饮料聚光太阳能等最终用户行业是在加工设施中使用热流体进行加热和冷却的示例。
- 根据印度政府电力部的数据,截至 2023 年 1 月,印度拥有 11,56105MVA 的变电站容量和 4,63758 公里的输电线路,使其成为世界上最大的同步电网之一. 已经成为一个。
- 预计在预测期内,该地区各行业的各种投资和增长将对导热流体市场产生积极影响。
热流体行业概览
热流体市场因其性质而部分分散。 市场上的主要参与者包括伊士曼化学公司、埃克森美孚公司、壳牌公司、印度斯坦石油公司、英国石油公司(排名不分先后)。
其他福利:
- Excel 格式的市场预测 (ME) 表
- 3 个月的分析师支持
内容
第一章介绍
- 调查先决条件
- 本次调查的范围
第二章研究方法论
第 3 章执行摘要
第四章市场动态
- 主持人
- 石油和天然气行业的广泛需求
- 扩大聚光太阳能发电的使用
- 阻碍因素
- 原材料价格波动
- 其他限制
- 工业价值链分析
- 波特的五力分析
- 供应商的议价能力
- 买家的议价能力
- 新进入者的威胁
- 替代品的威胁
- 竞争程度
第 5 章市场细分(市场规模:基于金额)
- 类型
- 矿物油
- 硅/芳烃
- 乙二醇
- 其他类型
- 最终用户行业
- 食物和饮料
- 化学
- 医药
- 石油和天然气
- 太阳能发电
- 其他最终用户行业
- 地区
- 亚太地区
- 中国
- 印度
- 日本
- 韩国
- 其他亚太地区
- 北美
- 美国
- 加拿大
- 墨西哥
- 欧洲
- 德国
- 英国
- 法国
- 意大利
- 其他欧洲
- 南美洲
- 巴西
- 阿根廷
- 其他南美洲
- 中东和非洲
- 沙特阿拉伯
- 南非
- 阿拉伯联合酋长国
- 其他中东和非洲地区
- 亚太地区
第六章竞争格局
- 併购、合资、合作、合同等。
- 市场份额分析**/排名分析
- 主要公司采用的策略
- 公司简介
- BP plc
- Bozzler Energy Pvt Ltd
- Dow
- Dynalene, Inc.
- Eastman Chemical Company
- Exxon Mobil Corporation
- Hindustan Petroleum Corporation Limited
- Multitherm LLC
- Paratherm
- Shell plc
第七章市场机会与未来趋势
- 生物基热载体的开发
The thermic fluid market is anticipated to register a CAGR of over 5% during the forecast period.
COVID-19 negatively impacted the market in 2020. Considering the pandemic scenario, the petroleum refinery units had cut their production throughout, and many chemical manufacturing activities were temporarily stopped, reducing the studied market demand. However, the pharmaceutical product demand increased during the pandemic, enhancing the market-studied demand. Nonetheless, the industry picked up speed in the post-pandemic era and is expected to keep doing so during the forecast period.
Key Highlights
- The market growth is anticipated to be fueled by rising demand from the oil and gas sector, where the activities heavily rely on thermic fluid usage and rising demand for concentrated solar power.
- Conversely, the volatility in raw material prices is expected to hinder the market's growth.
- The high potential for developing bio-based thermic fluids will likely provide a significant growth opportunity for the market studied.
- With the highest refinery capacity and a substantial global presence in the chemical and pharmaceutical industries, the Asia-Pacific region led the market share for thermic fluids. It is expected to continue doing so during the forecast period.
Thermic Fluid Market Trends
Extensive Demand from the Oil and Gas Sector
- The oil and gas industry is continuously expanding its thermic fluid usage to meet the expanding energy requirements. Thermal fluid is used in the oil and gas industry to carry out essential operations such as processing oil and gas, purifying natural gas, refining, turning gas into liquid, processing and storing asphalt, etc.
- Thermic fluids are utilized in natural gas processing, primarily during gas sweetening, glycol dehydration, and fractionation train phases. The regenerators present during the gas sweetening and glycol dehydration stage is heated by a boiler, which in turn is heated by thermic fluid. Additionally, thermic fluid is used to heat the reboiler, which is present at each distillation column, during the fractionation train.
- According to the BP Statistical Review of World Energy 2022, global natural gas production accounted for 4,036.9 billion cubic meters in 2021, with a growth rate of about 4.5% compared to the previous year. It is enhancing the thermic fluid demand during natural gas processing.
- Refining procedures also use thermic fluids. They are utilized as a medium for heating fractionation unit reboilers and overhead cooling condensers, among other things. According to the BP Statistical Review of World Energy 2022, total refinery throughput worldwide was roughly 79,229 thousand barrels per day, a 5% increase over the previous year. The United States had an enormous refinery throughput, with 15,148 thousand barrels per day, followed by China.
- There was also a slight volume gain by comparing the amount of global oil production to the prior year's volume. About 4,221 million metric tons of volume were produced in 2021, according to the BP Statistical Review of World Energy 2022.
- The value added by oil and gas extraction mining in the United States in the first three quarters of 2022 was roughly USD 1,160 billion, up a whopping 43% from the value added in the first three quarters of the previous year, according to the Bureau of Economic Analysis. The value was added at seasonally adjusted annual rates.
- The prospectus for the future development of the oil and gas business recommends that oil exploration will proceed to develop in the long term and utilize thermic fluids simultaneously. Moreover, more penetration must be done per oil unit, as hydrocarbon discoveries become less productive with time.
- Therefore, the above factors are expected to impact the thermic fluid market in the coming years significantly.
Asia-Pacific Region to Dominate the Market
- The Asia-Pacific region dominated the market share for thermic fluids worldwide. It can be described as the region's extensive manufacturing operations for chemicals, pharmaceuticals, and petroleum refining.
- The overall refinery throughput in the Asia-Pacific area was 29.5 million barrels per day in 2021, up 3.3% from the year before, according to the BP Statistical Review of World Energy 2022.
- The Asia-Pacific region also substantially influences the production and use of natural gas. The overall amount of natural gas consumed in the Asia-Pacific area in 2021 was 918.3 billion cubic meters, up roughly 5% from the year before, according to the BP Statistical Review of World Energy 2022.
- The pharmaceutical industry and chemical processing are other industries where thermic fluid is used. The chemical production increased by 5.73% to 4.35 million tons in 2022-23 (up to July 2022) from 4.1 million tons in the same period the previous year, according to data provided by the Ministry of Chemicals and Fertilizers of India.
- According to the estimations by IQVIA, China, the world's second-largest pharmaceutical spending country, will increase the segment volume by 8% over the next five years, while spending will increase by 19%, a slower rate than in previous years but still at a focus on extending access to innovative drugs. Indian pharmaceutical industry is also expected to reach ~USD 130 billion by 2030, as India Brand Equity Foundation (IBEF) suggested. The country is the largest producer of vaccines worldwide, accounting for ~60% of the total vaccines as of 2021, and ranks third globally for pharmaceutical production by volume.
- Food and beverage concentrated solar power and other end-user sectors are examples of those who employ thermic fluid for heating and cooling purposes at their processing facilities.
- According to the Ministry of Power of the Government of India, as of January 2023, the nation had 11,56,105 MVA of transformation capacity and 4,63,758 circuit km of transmission line, making it one of the most extensive synchronous linked electricity grids in the world.
- With all the investments and the growth in the various industries across the region, a positive impact is expected on the thermic fluid market during the forecast period.
Thermic Fluid Industry Overview
The thermic fluid market is partially fragmented by nature. Some key players in the market include (not in any particular order) Eastman Chemical Company, Exxon Mobil Corporation, Shell plc, Hindustan Petroleum Corporation Limited, and BP plc, among others.
Additional Benefits:
- The market estimate (ME) sheet in Excel format
- 3 months of analyst support
TABLE OF CONTENTS
1 INTRODUCTION
- 1.1 Study Assumptions
- 1.2 Scope of the Study
2 RESEARCH METHODOLOGY
3 EXECUTIVE SUMMARY
4 MARKET DYNAMICS
- 4.1 Drivers
- 4.1.1 Extensive Demand from the Oil and Gas Sector
- 4.1.2 Increasing Use in Concentrated Solar Power
- 4.2 Restraints
- 4.2.1 Fluctuations in Raw Material Prices
- 4.2.2 Other Restraints
- 4.3 Industry Value Chain Analysis
- 4.4 Porter's Five Forces Analysis
- 4.4.1 Bargaining Power of Suppliers
- 4.4.2 Bargaining Power of Buyers
- 4.4.3 Threat of New Entrants
- 4.4.4 Threat of Substitute Products
- 4.4.5 Degree of Competition
5 MARKET SEGMENTATION (Market Size in Value)
- 5.1 Type
- 5.1.1 Mineral Oils
- 5.1.2 Silicon and Aromatics
- 5.1.3 Glycols
- 5.1.4 Other Types
- 5.2 End-user Industry
- 5.2.1 Food and Beverage
- 5.2.2 Chemical
- 5.2.3 Pharmaceutical
- 5.2.4 Oil and Gas
- 5.2.5 Concentrated Solar Power
- 5.2.6 Other End-user Industries
- 5.3 Geography
- 5.3.1 Asia-Pacific
- 5.3.1.1 China
- 5.3.1.2 India
- 5.3.1.3 Japan
- 5.3.1.4 South Korea
- 5.3.1.5 Rest of Asia-Pacific
- 5.3.2 North America
- 5.3.2.1 United States
- 5.3.2.2 Canada
- 5.3.2.3 Mexico
- 5.3.3 Europe
- 5.3.3.1 Germany
- 5.3.3.2 United Kingdom
- 5.3.3.3 France
- 5.3.3.4 Italy
- 5.3.3.5 Rest of Europe
- 5.3.4 South America
- 5.3.4.1 Brazil
- 5.3.4.2 Argentina
- 5.3.4.3 Rest of South America
- 5.3.5 Middle East & Africa
- 5.3.5.1 Saudi Arabia
- 5.3.5.2 South Africa
- 5.3.5.3 United Arab Emirates
- 5.3.5.4 Rest of Middle East & Africa
- 5.3.1 Asia-Pacific
6 COMPETITIVE LANDSCAPE
- 6.1 Mergers and Acquisitions, Joint Ventures, Collaborations, and Agreements
- 6.2 Market Share Analysis**/Ranking Analysis
- 6.3 Strategies Adopted by Leading Players
- 6.4 Company Profiles
- 6.4.1 BP plc
- 6.4.2 Bozzler Energy Pvt Ltd
- 6.4.3 Dow
- 6.4.4 Dynalene, Inc.
- 6.4.5 Eastman Chemical Company
- 6.4.6 Exxon Mobil Corporation
- 6.4.7 Hindustan Petroleum Corporation Limited
- 6.4.8 Multitherm LLC
- 6.4.9 Paratherm
- 6.4.10 Shell plc
7 MARKET OPPORTUNITIES AND FUTURE TRENDS
- 7.1 Development of Bio-based Thermic Fluids


