


 |
市场调查报告书
商品编码
1644300
采购分析 -市场占有率分析、产业趋势与统计、成长预测(2025-2030 年)Procurement Analytics - Market Share Analysis, Industry Trends & Statistics, Growth Forecasts (2025 - 2030) |
||||||
※ 本网页内容可能与最新版本有所差异。详细情况请与我们联繫。
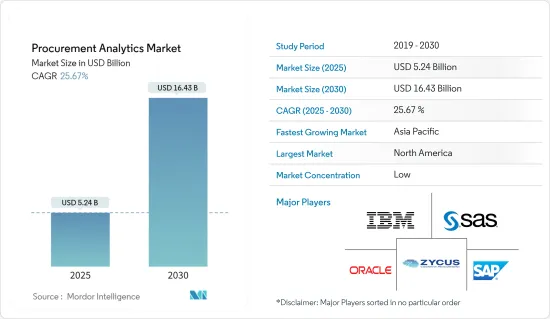
采购分析市场规模预计在 2025 年为 52.4 亿美元,预计到 2030 年将达到 164.3 亿美元,预测期内(2025-2030 年)的复合年增长率为 25.67%。
采购分析利用大量的采购资料来产生一系列有价值的见解,有助于推动价值并增强业务。
关键亮点
- 市场扩张的关键驱动力是企业越来越注重提高采购管道的业务效率,以及管理合约和合规措施的迫切需求。
- 支出分析的好处也在不断扩大,包括透过资料视觉化获得更深入的洞察、实施降低成本的流程的能力、轻鬆存取大文件、以及提供即时更新和填充的资料的能力。利用率和消耗的增加增加了系统的可扩展性并降低了组织所需的投资。
- 此外,在整个预测期内,由于软体与人工智慧(AI)的结合,采购软体市场预计将具有巨大的发展潜力。技术发展可能会推动市场参与企业的收益更快成长。相反,需要更多熟练的人力来确保市场成长。
- 此外,随着与资料相关的业务复杂性的增加,决策也会增加。中小企业需要更多资源来优化周围的资料,这可能会阻碍市场扩张。
- COVID-19疫情对采购分析市场的发展产生了重大影响。智慧型手机的日益普及、连网型设备的不断增长以及电子商务行业的蓬勃发展为市场提供了良好的成长机会。
采购分析市场趋势
零售和电子商务领域实现成长
- 采购分析很可能会被不断扩张的零售和电子商务行业迅速采用。企业使用电子商务分析来研究使用者行为并确定最有可能吸引访客兴趣并转化为销售的产品登陆页面的布局和内容。
- 电子商务是一个术语,用于描述商品和服务的买卖双方使用电脑、平板电脑、智慧型手机和其他智慧型装置存取网路上的网站、应用程式和其他内容的方式。大型电子商务公司和有组织的零售商经常使用采购分析,因为它可以让他们获得有关消费者支出和行为的资料驱动洞察。
- 每个家用电子电器产品和设备都配备了蓝牙和 Wi-Fi,大大提高了资料产生的品质和速度。
- 例如,印度管理学院加尔各答分校于 2022 年 6 月启动了供应链管理高级课程 (APSCM),旨在培养相关领域专业人士和供应链从业者建立具有弹性且具有成本效益的供应网络。课程重点在于供应链分析和物流,提高您的决策能力并提高您企业的整体盈利。
预计北美将占据较大的市场占有率
- 由于对集中采购流程的需求不断增长,北美目前在全球市场占据主导地位。此外,该地区公司的整合预计将刺激未来的市场扩张。
- 美国还拥有庞大的工业基础、支持创新的政府项目以及公民强大的购买力。成长的中心是美国。关键资料软体使用者经常使用列印管理解决方案来降低成本、改善业务运作并提高工人生产力。
- 早期采用技术,包括流程数位化和分析。该地区的成长可能会受到风险管理、供应链分析和供应商分析解决方案支出增加的推动。
- 美国正努力振兴製造业,重点在于提高工业部门的生产力和改善供应链运作。
- 北美采购分析市场的主要市场参与企业也不断更新和创新其产品。例如,2022 年 6 月,PartsSource 推出了视觉化配方控制和供应链风险监控器,帮助客户提高设备运作和供应链弹性。
采购分析行业概况
采购分析市场竞争激烈。市场参与企业不断采用产品创新、伙伴关係和收购等策略来加强其在市场中的地位。
2023 年 1 月,Zycus Inc. 宣布 DeAcero 将利用 Zycus 支援 AI 的 S2P 解决方案转变其采购流程,以加速从采购到付款的格局。
2022 年 11 月,SAS Institute Inc. 和再生医学发展组织 (ReMDO) 合作在北卡罗来纳州进行一项新的再生医学试验 ReMDO RegeneratOR 测试平台。该合资企业将充当经济发展的促进者,加速拥有创新和新兴技术的初创企业的成长,并帮助中型和大型新兴企业透过获得最先进的生物製造设备、行业专业知识、人才和培训计划来扩大规模,以支持新颖的原型製作和商业产品开发。
其他福利
- Excel 格式的市场预测 (ME) 表
- 3 个月的分析师支持
目录
第 1 章 简介
- 研究假设和市场定义
- 研究范围
第二章调查方法
第三章执行摘要
第四章 市场洞察
- 市场概况
- 产业吸引力-波特五力分析
- 供应商的议价能力
- 消费者议价能力
- 新进入者的威胁
- 替代品的威胁
- 竞争对手之间的竞争强度
- COVID-19影响评估
第五章 市场动态
- 市场驱动因素
- 在工业采购流程中采用率提高
- 对云端基础的分析解决方案的需求不断增加
- 市场限制
- 缺乏训练有素、技术娴熟的分析专业人员
- 资料外洩案例不断增加
第六章 市场细分
- 按类型
- 软体
- 服务
- 依部署类型
- 本地
- 云
- 按应用
- 供应链分析
- 风险分析
- 支出分析
- 需求预测
- 合约管理
- 按最终用户
- 製造业
- 运输和物流
- 零售与电子商务
- BFSI
- 资讯科技/通讯
- 其他最终使用者(教育、医疗)
- 按地区
- 北美洲
- 欧洲
- 亚太地区
- 其他的
第七章 竞争格局
- 公司简介
- SAP SE
- Oracle Corporation
- SAS Institute Inc.
- IBM Corporation
- Zycus Inc.
- BRIDGEi2i Analytics Solutions Pvt. Ltd.
- JAGGAER Inc.
- Genpact Limited
- Rosslyn Data Technologies PLC
- Simfoni Analytics
第八章投资分析
第九章 市场机会与未来趋势
The Procurement Analytics Market size is estimated at USD 5.24 billion in 2025, and is expected to reach USD 16.43 billion by 2030, at a CAGR of 25.67% during the forecast period (2025-2030).
To create a set of valuable insights that will help drive value and enhance operations, procurement analytics involves drawing on the vast pool of procurement data.
Key Highlights
- The primary drivers of the market's expansion are the organizations' growing emphasis on improving their operational efficiencies in their procurement channels and their impending need to manage contracts and compliance policies.
- The advantages of spend analytics are also expanding, including the ability to get deeper insights through data visualization, enable the implementation of processes that save costs, make it simple to access enormous files, and provide data that is updated and located in real time. Improved use and consumption increase the system's scalability and lower the organization's investment.
- Furthermore, throughout the projection period, the market for procurement software is projected to have significant development potential due to the software's integration with artificial intelligence (AI). Technological developments will likely hasten market participants' revenue growth. On the contrary, more skilled personnel is needed to ensure market growth.
- Additionally, as business complexity related to data has grown, making decisions has become more complex. Small and medium-sized businesses need more resources to optimize the data around them, which could impede market expansion.
- The COVID-19 outbreak significantly impacted the development of the procurement analytics market. The rising popularity of smartphones, the increasing uptake of connected devices, and the booming e-commerce industry presented the market with promising opportunities for growth.
Procurement Analytics Market Trends
Retail and E-commerce Sector to Witness the Growth
- Procurement analytics are likely to be adopted by the expanding retail and e-commerce industries at a rapid rate. E-commerce analytics are used by businesses to examine user behavior and determine the layout and content of product landing pages that are most likely to engage visitors and result in sales.
- E-commerce is the term used to describe a means by which buyers and sellers of goods and services use computers, tablets, smartphones, and other smart devices to access websites, applications, and other content on the Internet. Large e-commerce companies and organized retail outlets frequently use procurement analytics because it provides a data-driven analysis of consumer spending and behavior.
- The inclusion of Bluetooth and Wi-Fi in every consumer electronic product and piece of equipment has exponentially enhanced data generation quality and speed, which is also expected to drive demand for spending analytics, particularly in the retail industry.
- For instance, IIM Calcutta created the Advanced Programme in Supply Chain Management (APSCM) in June 2022 to help professionals in related fields and supply chain practitioners create resilient, cost-effective supply networks. The emphasis on supply chain analytics and logistics in this curriculum will help sharpen decision-making skills and increase overall business profitability.
North America is Expected to Hold Significant Market Share
- Due to the growing demand for centralized procurement processes, North America currently controls the global market. Additionally, it is anticipated that the consolidation of companies founded in the area will spur market expansion in the future.
- Also, the U.S. has a significant industrial base, there are government programs to support innovation, and the population has a high purchasing power. The U.S. is where the growth is mainly centered. Significant data software users frequently use print management solutions to save costs, improve industry verticals, and increase worker productivity.
- Early technology adoption, including process digitalization and analytics. Regional growth will likely be fueled by increased spending on risk management, supply chain analytics, and vendor analytical solutions.
- The United States is assiduously working to boost its manufacturing sector by increasing productivity and emphasizing better supply chain operations within its industrial sector.
- Major market participants in North America's procurement analytics market are also constantly updating and innovating their product lineup. For instance, in June 2022, PartsSource introduced a visual formulary control and supply chain risk monitor to assist clients in increasing equipment uptime and supply chain resilience.
Procurement Analytics Industry Overview
The procurement analytics market is highly competitive. Players in the market are continuously adopting strategies like innovations in their products, partnerships, acquisitions, and others to increase their market presence.
In January 2023, Zycus Inc has announced DeAcero transforms its procurement processes with Zycus' AI-enabled S2P solutions to accelerate its source-to-pay landscape, where DeAcerowill use Zycus' eProcurement, eInvoicing, sourcing, contract lifecycle management, request management, supplier information management, supplier risk management, spend analysis, and its Merlin AI offering
In November 2022, SAS Institute Inc and Regenerative Medicine Development Organization (ReMDO) were collaborating on the ReMDO RegeneratOR Test Bed, a novel regenerative medicine endeavor in North Carolina. The joint enterprise will serve as an economic development driver, helping to accelerate the growth of startups and scale up mid-to-large-sized companies with innovative and emerging technologies through access to state-of-the-art biomanufacturing equipment, industry expertise, talent, and training programs to support novel prototyping and commercial product development.
Additional Benefits:
- The market estimate (ME) sheet in Excel format
- 3 months of analyst support
TABLE OF CONTENTS
1 INTRODUCTION
- 1.1 Study Assumptions and Market Definition
- 1.2 Scope of the Study
2 RESEARCH METHODOLOGY
3 EXECUTIVE SUMMARY
4 MARKET INSIGHTS
- 4.1 Market Overview
- 4.2 Industry Attractiveness - Porter's Five Forces Analysis
- 4.2.1 Bargaining Power of Suppliers
- 4.2.2 Bargaining Power of Consumers
- 4.2.3 Threat of New Entrants
- 4.2.4 Threat of Substitute Products
- 4.2.5 Intensity of Competitive Rivalry
- 4.3 Assessment of the Impact of COVID-19
5 MARKET DYNAMICS
- 5.1 Market Drivers
- 5.1.1 Rising Adoption in Procurement Process in Industries
- 5.1.2 Rising Demand for Cloud Based Analytical Solutions
- 5.2 Market Restraints
- 5.2.1 Lack of Trained and Skilled Analytical Professionals
- 5.2.2 Growing Data Breaches Cases
6 MARKET SEGMENTATION
- 6.1 By Type
- 6.1.1 Software
- 6.1.2 Services
- 6.2 By Deployment Type
- 6.2.1 On-Premise
- 6.2.2 Cloud
- 6.3 By Application
- 6.3.1 Supply Chain Analytics
- 6.3.2 Risk Analytics
- 6.3.3 Spend Analytics
- 6.3.4 Demand Forecasting
- 6.3.5 Contract Management
- 6.4 By End-User
- 6.4.1 Manufacturing
- 6.4.2 Transportation & Logistic
- 6.4.3 Retail and E-commerce
- 6.4.4 BFSI
- 6.4.5 IT & Telecommunication
- 6.4.6 Other End-Users (Education, Healthcare)
- 6.5 By Geography
- 6.5.1 North America
- 6.5.2 Europe
- 6.5.3 Asia-Pacific
- 6.5.4 Rest of the World
7 COMPETITIVE LANDSCAPE
- 7.1 Company Profiles
- 7.1.1 SAP SE
- 7.1.2 Oracle Corporation
- 7.1.3 SAS Institute Inc.
- 7.1.4 IBM Corporation
- 7.1.5 Zycus Inc.
- 7.1.6 BRIDGEi2i Analytics Solutions Pvt. Ltd.
- 7.1.7 JAGGAER Inc.
- 7.1.8 Genpact Limited
- 7.1.9 Rosslyn Data Technologies PLC
- 7.1.10 Simfoni Analytics


