


 |
市场调查报告书
商品编码
1431259
生物农药:市场占有率分析、产业趋势与统计、成长预测(2024-2029)Bioinsecticides - Market Share Analysis, Industry Trends & Statistics, Growth Forecasts (2024 - 2029) |
||||||
价格
※ 本网页内容可能与最新版本有所差异。详细情况请与我们联繫。
简介目录
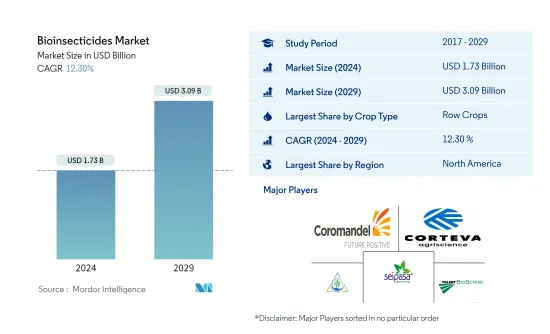
生物农药市场规模预计到2024年为17.3亿美元,预计到2029年将达到30.9亿美元,在预测期内(2024-2029年)复合年增长率为12.30%。
主要亮点
- 耕作作物是最大的作物类型:世界上种植的主要连作作物有大麦、玉米、小麦、油菜籽、黑麦、向日葵、大豆和水稻。连作作物的主导地位归因于世界上最大的耕地面积。
- 田间作物是生长最快的作物:生物杀虫剂是永续的害虫防治方法。
- 北美是最大的地区:在有机种植增加和化学农药使用减少的推动下,美国和加拿大主导该地区的生物农药市场。
- 美国是面积最大的国家:在有机转型倡议以及对有机和无农药食品的需求的推动下,可耕作物在 2021 年以 92.6% 的市场份额占据主导地位。
生物杀虫剂市场趋势
作物田间作物。
- 生物农药是从多种来源获得的天然物质,可有效控制害虫,同时对非目标生物安全,并且在污水处理厂和自然环境中易于降解。由于这些独特的特性,生物农药越来越受到农民和消费者的欢迎。
- 生物农药市场以连作作物为主,2022年占全球市场金额的84.0%。大麦、玉米、小麦、油菜籽、黑麦、向日葵、大豆和稻米等主要连作作物是全球种植最广泛的作物。紧随其后的是园艺作物,2022 年市场占有率为 11.8%。
- 全球生物农药市场以北美为主导,2022年市场占有率为40.8%,其次是欧洲(33.2%)及亚太地区(17.5%)。全球支持采用生态学和永续农业方法向有机农业过渡,特别着重于减少疫情造成的化肥和农药的消耗。
- 农药行动网络 (PAN) 是一个由 600 多个非政府组织、机构和个人组成的全球网络,致力于推广有害农药的无害环境和社会公正的普及。 PAN 透过其倡议和计划,提高人们对农药有害影响的认识,并促进采用生物农药作为更安全、更永续的替代品。
- 生物农药因其独特的功能和优点,以及消费者对无化学农产品和有机种植食品日益增长的偏好,预计将在全球市场增长,预计市场预测和预测期(2023年~2029年)复合年增长率是12.2%。
北美是最大的地区
- 生物农药是生物源杀虫剂,利用真菌、细菌或植物抽取物等微生物对抗抑製作物生长和发育的害虫。北美、欧洲和亚太地区主导全球生物农药市场。
- 2022年,北美地区将占全球生物农药市场的40.8%(以金额为准计算)。北美国家采取了一定的政策来增加有机农业。例如,在美国,实施了美国的有机农业转型计画和区域害虫综合防制中心。加拿大透过害虫管理中心实施了对某些农药的禁令。在墨西哥,越来越多的人反对使用化学农药。所有这些努力正在推动该地区的生物农药市场。
- 欧洲是生物农药的第二大市场。欧盟(EU)正在推广有机农业,目标是到2030年该地区25%的农地采用有机农业。作为该策略的一部分,所有成员国必须在 2030 年将化学农药的使用量减少一半。因此,所有成员国都实施了各自的措施和政策,例如义大利对化学农药征收高额税收。
- 亚太地区是生物农药的第三大市场。中国和印度占据亚太生物农药市场的主要份额。中国是全球最大的农药使用国,计画在2025年将园艺作物农药使用量减少10%,水稻、小麦和玉米种植农药使用量减少5%。全球农药禁令和有机农业的增加预计将在预测期内推动全球生物农药市场。
生物农药产业概况
生物农药市场较为分散,前五家企业占比为1.69%。该市场的主要企业为(按字母顺序排列)Coromandel International Ltd、Corteva Agriscience、IPL Biologicals Limited、Seipasa SA、Valent Biosciences LLC。
其他福利
- Excel 格式的市场预测 (ME) 表
- 3 个月分析师支持
目录
第一章执行摘要和主要发现
第二章 检举要约
第三章简介
- 研究假设和市场定义
- 调查范围
- 调查方法
第四章 产业主要趋势
- 有机种植面积
- 人均有机产品支出
- 法律规范
- 价值炼和通路分析
第五章市场区隔
- 作物类型
- 经济作物
- 园艺作物
- 栽培作物
- 地区
- 非洲
- 按国家/地区
- 埃及
- 奈及利亚
- 南非
- 其他非洲
- 亚太地区
- 按国家/地区
- 澳洲
- 中国
- 印度
- 印尼
- 日本
- 菲律宾
- 泰国
- 越南
- 其他亚太地区
- 欧洲
- 按国家/地区
- 法国
- 德国
- 义大利
- 荷兰
- 俄罗斯
- 西班牙
- 土耳其
- 英国
- 其他欧洲国家
- 中东
- 按国家/地区
- 伊朗
- 沙乌地阿拉伯
- 其他中东地区
- 北美洲
- 按国家/地区
- 加拿大
- 墨西哥
- 美国
- 北美其他地区
- 南美洲
- 按国家/地区
- 阿根廷
- 巴西
- 南美洲其他地区
- 非洲
第六章 竞争形势
- 主要策略趋势
- 市场占有率分析
- 公司形势
- 公司简介
- Andermatt Group AG
- Certis USA LLC
- Coromandel International Ltd
- Corteva Agriscience
- IPL Biologicals Limited
- Jaipur Bio Fertilizers
- Lallemand Inc.
- Seipasa SA
- T.Stanes and Company Limited
- Valent Biosciences LLC
第七章 CEO 面临的关键策略问题
第8章附录
- 世界概况
- 概述
- 五力分析框架
- 世界价值链分析
- 市场动态(DRO)
- 资讯来源和参考文献
- 图表列表
- 重要见解
- 资料包
- 词彙表
简介目录
Product Code: 500008
The Bioinsecticides Market size is estimated at USD 1.73 billion in 2024, and is expected to reach USD 3.09 billion by 2029, growing at a CAGR of 12.30% during the forecast period (2024-2029).
Key Highlights
- Row Crops is the Largest Crop Type : The main row crops farmed globally are barley, corn, wheat, rapeseed, rye, sunflower, soybean, and rice. Row crops dominance is due to largest cultivation area globally.
- Row Crops is the Fastest-growing Crop Type : Increased pest pressure is thought to be caused by increasing crop field sizes and decreasing seminatural area; bioinsecticides are a sustainable method of controlling it.
- North America is the Largest Region : United states and Canada are dominating the bioinsecticides market in the region, increased organic cultivation and reducing use of chemical pesticides are driving factors.
- United States is the Largest Country : Row crops are dominating the market with 92.6% in 2021, organic transition initiative and demand for organic and pesticide-free food products driving the market.
Bioinsecticides Market Trends
Row Crops is the largest Crop Type
- Bioinsecticides are natural substances derived from various sources that effectively control insect pests while being safe for non-target organisms and easily degradable in sewage treatment plants and natural environments. These unique features make bioinsecticides an increasingly popular choice for farmers and consumers.
- The bioinsecticides market is dominated by row crops, which accounted for 84.0% of the global market value in 2022. Major row crops such as barley, corn, wheat, rapeseed, rye, sunflower, soybean, and rice are among the most widely farmed globally. Following closely behind are horticulture crops, which had a market share of 11.8% in 2022.
- North America leads the global bioinsecticides market, accounting for 40.8% of the market share in 2022, followed by Europe and Asia-Pacific, with market shares of 33.2% and 17.5%, respectively. The transition to organic agriculture through agroecological and sustainable agricultural practices gained traction globally, focusing on reducing fertilizers and pesticide consumption, particularly due to the pandemic.
- The Pesticide Action Network (PAN) is a global network of over 600 non-governmental organizations, institutions, and individuals working to promote environmentally sound and socially just alternatives to hazardous pesticides. Through its initiatives and programs, PAN is raising awareness about the negative effects of pesticides and driving the adoption of bioinsecticides as a safer and more sustainable alternative.
- With its unique features and benefits and growing consumer preference for chemical-free produce and organically grown food, bioinsecticides are set to experience growth in the global market, with an estimated CAGR of 12.2% during the forecast period (2023-2029).
North America is the largest Region
- Bioinsecticides are biologically-derived pesticides that use microorganisms such as fungi, bacteria, or even plant extracts to combat pest insects that disrupt crop growth and development. North America, Europe, and Asia-Pacific are dominating the global bioinsecticides market.
- The North American region accounted for 40.8%, by value, of the global bioinsecticides market in 2022. North American countries are establishing certain policies to increase organic farming. For instance, the United States implemented USDA's Organic Transition Initiative and a regional integrated pest management center. Canada implemented a ban on certain pesticides through pest management centers. In Mexico, there is growing opposition to the use of chemical pesticides. All these initiatives are driving the bioinsecticides market in the region.
- Europe is the second-largest market for bioinsecticides. The European Union is promoting organic farming by setting the target of achieving 25% of the region's agricultural land under organic farming by 2030. As part of the strategy, all member countries must reduce their use of chemical pesticides by half by 2030. Therefore all the member countries are implementing individual initiatives and policies, including imposing a high tax on chemical pesticides in Italy.
- Asia-Pacific is the third-largest market for bioinsecticides. China and India hold the major share of the Asia-Pacific bioinsecticides market. China, the world's largest pesticide user, intends to reduce pesticide use by 10% in horticultural crops and 5% in rice, wheat, and corn cultivation by 2025. Pesticide bans worldwide and increased organic farming are expected to drive the global bioinsecticides market during the forecast period.
Bioinsecticides Industry Overview
The Bioinsecticides Market is fragmented, with the top five companies occupying 1.69%. The major players in this market are Coromandel International Ltd, Corteva Agriscience, IPL Biologicals Limited, Seipasa SA and Valent Biosciences LLC (sorted alphabetically).
Additional Benefits:
- The market estimate (ME) sheet in Excel format
- 3 months of analyst support
TABLE OF CONTENTS
1 EXECUTIVE SUMMARY & KEY FINDINGS
2 REPORT OFFERS
3 INTRODUCTION
- 3.1 Study Assumptions & Market Definition
- 3.2 Scope of the Study
- 3.3 Research Methodology
4 KEY INDUSTRY TRENDS
- 4.1 Area Under Organic Cultivation
- 4.2 Per Capita Spending On Organic Products
- 4.3 Regulatory Framework
- 4.4 Value Chain & Distribution Channel Analysis
5 MARKET SEGMENTATION
- 5.1 Crop Type
- 5.1.1 Cash Crops
- 5.1.2 Horticultural Crops
- 5.1.3 Row Crops
- 5.2 Region
- 5.2.1 Africa
- 5.2.1.1 By Country
- 5.2.1.1.1 Egypt
- 5.2.1.1.2 Nigeria
- 5.2.1.1.3 South Africa
- 5.2.1.1.4 Rest Of Africa
- 5.2.2 Asia-Pacific
- 5.2.2.1 By Country
- 5.2.2.1.1 Australia
- 5.2.2.1.2 China
- 5.2.2.1.3 India
- 5.2.2.1.4 Indonesia
- 5.2.2.1.5 Japan
- 5.2.2.1.6 Philippines
- 5.2.2.1.7 Thailand
- 5.2.2.1.8 Vietnam
- 5.2.2.1.9 Rest Of Asia-Pacific
- 5.2.3 Europe
- 5.2.3.1 By Country
- 5.2.3.1.1 France
- 5.2.3.1.2 Germany
- 5.2.3.1.3 Italy
- 5.2.3.1.4 Netherlands
- 5.2.3.1.5 Russia
- 5.2.3.1.6 Spain
- 5.2.3.1.7 Turkey
- 5.2.3.1.8 United Kingdom
- 5.2.3.1.9 Rest Of Europe
- 5.2.4 Middle East
- 5.2.4.1 By Country
- 5.2.4.1.1 Iran
- 5.2.4.1.2 Saudi Arabia
- 5.2.4.1.3 Rest Of Middle East
- 5.2.5 North America
- 5.2.5.1 By Country
- 5.2.5.1.1 Canada
- 5.2.5.1.2 Mexico
- 5.2.5.1.3 United States
- 5.2.5.1.4 Rest Of North America
- 5.2.6 South America
- 5.2.6.1 By Country
- 5.2.6.1.1 Argentina
- 5.2.6.1.2 Brazil
- 5.2.6.1.3 Rest Of South America
- 5.2.1 Africa
6 COMPETITIVE LANDSCAPE
- 6.1 Key Strategic Moves
- 6.2 Market Share Analysis
- 6.3 Company Landscape
- 6.4 Company Profiles
- 6.4.1 Andermatt Group AG
- 6.4.2 Certis U.S.A. LLC
- 6.4.3 Coromandel International Ltd
- 6.4.4 Corteva Agriscience
- 6.4.5 IPL Biologicals Limited
- 6.4.6 Jaipur Bio Fertilizers
- 6.4.7 Lallemand Inc.
- 6.4.8 Seipasa SA
- 6.4.9 T.Stanes and Company Limited
- 6.4.10 Valent Biosciences LLC
7 KEY STRATEGIC QUESTIONS FOR AGRICULTURAL BIOLOGICALS CEOS
8 APPENDIX
- 8.1 Global Overview
- 8.1.1 Overview
- 8.1.2 Porter's Five Forces Framework
- 8.1.3 Global Value Chain Analysis
- 8.1.4 Market Dynamics (DROs)
- 8.2 Sources & References
- 8.3 List of Tables & Figures
- 8.4 Primary Insights
- 8.5 Data Pack
- 8.6 Glossary of Terms
02-2729-4219
+886-2-2729-4219
 生物农药市场规模、份额及成长分析(按来源、用途、配方、应用方法、最终用户和地区)-2025-2032 年产业预测
 生物农药市场:按类型、按作物、按机制、按配方、按作用方式、按应用 - 2025-2030 年全球预测
 生物杀虫剂市场 - 2018-2028 年全球产业规模、份额、趋势、机会和预测,按来源、按应用、地区和竞争细分
 全球生物农药市场规模、份额和行业趋势分析报告:2023-2030年按来源、用途和地区分類的展望和预测
 2023-2030年全球生物杀虫剂市场规模研究与预测,按类型、按生物体、按应用方式、按作物类型和区域分析
 生物杀虫剂市场:各产品类型,各生物类型,各用途,各国,各地区- 产业分析,市场规模,市场占有率,2023-2030年预测