


 |
市场调查报告书
商品编码
1431450
全球运转率追踪市场:市场占有率分析、产业趋势/统计、成长预测(2024-2029)Occupancy Tracking - Market Share Analysis, Industry Trends & Statistics, Growth Forecasts (2024 - 2029) |
||||||
※ 本网页内容可能与最新版本有所差异。详细情况请与我们联繫。
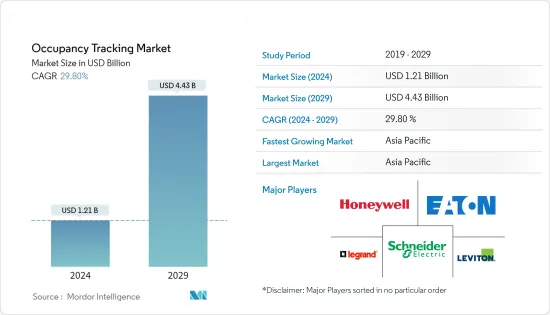
全球运转率追踪市场规模预计到 2024 年为 12.1 亿美元,到 2029 年将达到 44.3 亿美元,在预测期内(2024-2029 年)复合年增长率为 29.80%。
各种建筑业主越来越需要监控实际空间使用情况并制定节能目标,以减少能源消费量并实现脱碳和永续性目标,推动了预测期内的市场成长。
主要亮点
- 运转率追踪技术可帮助企业实现其持续目标,即仅使用适量的建筑空间来降低成本并高效运作。对于任何想要智慧、有效率地管理建筑物的人来说,运作监控感测器都是必不可少的。
- 许多组织浪费了多达一半的空间。换句话说,它的保存潜力是巨大的。根据世界绿色建筑研究,欧洲公司可以透过减少办公大楼浪费的空间节省 2,430 亿美元。优化的工作空间可以在全球整体节省高达 1.5 兆美元。其他资讯来源称,在北美,平均约有三分之二的办公桌和办公室閒置。此外,根据 Herman Miller 的空间利用率研究,分配的私人办公室平均一天有 77% 的时间处于閒置状态。
- 对节能设备的需求不断增长可能会推动所研究市场的成长。了解运作状态对于降低能耗有重要作用。这是透过运作感测器来完成的,感测器根据运转率关闭设备和其他设备。这些有助于减少光污染,可用于室内和室外空间。例如,在美国,照明占建筑物总能源消耗的11%,空调系统消耗35%。它约占美国商业建筑总用电量的 36%。这种能源使用通常被认为是不可避免的开支。然而,大部分能量每天都被浪费掉。无数企业为无人使用的暖气、冷气和照明房间付费。
- 在预测期内,对智慧房屋、企业建筑、工厂和城市开发的投资不断增加可能会推动市场发展。作为数位印度计划的一部分,印度政府计划在该国推广物联网。政府已拨款 700 亿卢比,用于开发 100 个智慧城市,配备物联网设备来控制交通、高效使用电力和水,并使用物联网感测器进行医疗保健和其他服务收集资料。
- 此外,建筑管理系统的主要任务是控制建筑的主动和被动策略,以优化能源效率并保持居住者的舒适度。然而,这些系统中的大多数使用通常不符合居住者偏好的预定义配置。因此,运转率追踪对于能源使用管理至关重要,尤其是在住宅和工业建筑中。
- 在 2022 年 10 月进行的一项调查中,运转率科技公司 Occuspace 的 85% 客户表示使用资料来衡量实体空间使用情况。此外,范德比尔特大学报告称,使用 Waitz 应用程式在自助餐厅和图书馆度过繁忙时间的学生获得了压倒性的积极回应。除了范德比尔特大学之外,普渡大学、哥伦比亚大学和加州大学洛杉矶分校 (UCLA) 最近也安装了 Occuspace 技术。
- 儘管疫情在短期内引发了人们对运转率追踪的大量兴趣和投资,但一些人指出,对这项技术的需求仍将持续。一些法规和准则可能会以某种形式持续存在,以提高人们对健康空间的认识并保护我们免受未来流行病的影响。此外,在家工作的转变以及疫情带来的财务不利因素让公司质疑实体办公空间的必要性。甚至在大流行之前,美国商业房地产服务局就估计美国未使用的商业房地产价值约为 1 兆美元。
运转率追踪市场趋势
办公大楼面积增加带动建筑类型细分
- 运转率追踪感测器将安装在接待区、会议室、零售楼层和整个办公大楼。运转率追踪系统可以提供有关空间使用方式的宝贵见解。这种洞察力有助于更好地决策空间、员工和资源的分配,并帮助企业有效率、安全地运作。
- 此外,这些感测器可以安装在多个战略位置,以检测人流量大的区域的移动,从而可以有效管理空间利用率、会议室效率、办公桌酒店住宿等。
- 许多占用感测器製造商正在积极寻求策略联盟,以改善用户体验。 2022 年 1 月,总部位于瑞典的全球物联网解决方案供应商 Sensative 与物联网极低功耗广域网路连接解决方案供应商 Actility 建立了合作伙伴关係。以及与 WMW 的合作。透过此次合作,前者发布了一款支援 LoRaWAN 的整合式物联网桌面运作监控解决方案。为了监控您的办公桌,该解决方案采用主动红外线感测器。
- 每个地区办公空间的扩张可能会进一步增加对运转率追踪解决方案的需求。英国国家统计局的数据显示,2023年第一季公共和私人办公室的新办公大楼建设订单超过26亿美元。
- 此外,根据高力国际的数据,2022 年第二季度,东北地区在建办公空间是美国最多的。东北部正在建造约3000万平方英尺的办公空间。
- 在后 COVID-19 时代,许多财富 100 强公司采用了混合工作模式,这种模式在各行业都很常见。然而,截至2023年3月,亚马逊、苹果等科技巨头纷纷宣布政策,要求员工每週上班3次。预计这将支持大量重返办公室。这些动态可能导致办公室运转率每週波动,而在无固定办公桌系统的职场,办公桌运转率甚至可能每天波动。此类情况可能会进一步产生对办公区域运转率追踪的需求。
亚太地区市场将实现显着成长
- 由于亚太地区建设活动的增加,运转率追踪解决方案预计在预测期内将显着增长。根据IBEF报道,杜拜政府和印度最近签署了查谟和克什米尔基础设施建设合同,包括工业、IT塔、多功能塔、物流中心、医学院和专科医院。
- 另根据中国国家统计局统计,近期中国酒店企业数量突破2.77万家,较前一年增加近2,500家。过去三年,中国主要酒店集团的数量大幅增加。此类酒店和餐厅的开拓可能会在所研究的市场中创造进一步的需求。
- 该地区包括印度和中国等重要国家,它们占据了全球能源消耗的大部分。据英国石油公司称,中国是世界上最大的初级能源消费国。近期,我国初级能源消费量达到约157.7埃焦耳,较上年成长近7%。
- 此外,韩国政府国土交通省宣布,将透过价值 2,500 万美元的国家计划,到 2022 年在 64 个中小城市开发智慧城市平台。世界其他地区也正在进行类似的工作,增加了对追踪感测器的运转率需求。
- 根据智慧城市任务规定,中央政府将在五年内提供480亿卢比的资金(平均每个城市每年10亿卢比)支持任务的实施。
- 此外,根据国土交通省的公告,2022年日本住宿住宿设施的运转率46.5%。儘管这一数字较上年有所回升,但受到 COVID-19 大流行的严重影响,录得 34.3%。此外,西南部城市孟买的运转率在印度最高,约60%,其次是首都新德里,预计到2022年。此举可能会进一步推动对运转率追踪系统的需求,以正确监控饭店空间和顾客。
运转率追踪行业概述
运转率追踪市场竞争激烈,几家领先公司在市场上表现良好,并试图透过专注于产品多元化来扩大其市场份额。公司采取新产品开发、合作、合併和补充等多种策略来加强产品系列获得相对于其他公司的竞争优势。
2023 年1 月,汽车技术解决方案创新者Indie Semiconductor 与电脑视觉技术领先公司之一Seeing Machines 建立合作伙伴关係,以补充用于驾驶员和乘员监控的先进视觉处理器的开发。我们宣布建立合作伙伴关係。
据报道,2022 年 11 月,运转率科技公司 Occuspace 宣布扩展到美国和加拿大的多所大学,为使用 Waitz 行动应用程式的人提供校园内建筑物的即时和历史空间使用资料。
2022 年 8 月,总部位于芝加哥的行销创新公司 Fusion92 在芝加哥、底特律和奥斯汀设有办事处,与领先的运转率监控技术公司 Occuspace 合作,提供创新的分析解决方案。
其他福利
- Excel 格式的市场预测 (ME) 表
- 3 个月分析师支持
目录
第一章 简介
- 研究假设和市场定义
- 调查范围
第二章调查方法
第三章执行摘要
第四章市场洞察
- 市场概况
- 产业吸引力-波特五力分析
- 供应商的议价能力
- 买方议价能力
- 新进入者的威胁
- 替代品的威胁
- 竞争公司之间的敌对关係
- 产业价值链分析
- COVID-19 市场影响评估
第五章市场动态
- 市场驱动因素
- 对建筑空间利用和优化的需求日益增长
- 节能设备的需求不断增长
- 市场挑战
- 对运转率追踪的好处缺乏认识
第六章市场区隔
- 按报价类型
- 硬体
- 软体
- 服务
- 依建筑类型
- 办公室
- 店铺
- 教育机构
- 卫生保健
- 饭店/餐厅
- 公共机构/会议厅
- 仓库
- 运输
- 按地区
- 北美洲
- 欧洲
- 亚太地区
- 拉丁美洲
- 中东/非洲
第七章 竞争形势
- 公司简介
- Honeywell International
- Eaton Corporation
- Schneider Electric
- Legrand Inc.
- Leviton Manufacturing Company
- Philips Ltd
- Hubbell Building Automation Inc.
- Johnson Controls GmbH
- Lutron Electronics, Inc.
- General Electric
- Acuity Brands
第八章投资分析
第9章市场的未来
The Occupancy Tracking Market size is estimated at USD 1.21 billion in 2024, and is expected to reach USD 4.43 billion by 2029, growing at a CAGR of 29.80% during the forecast period (2024-2029).
The increasing need to monitor actual space usage and target reduction efforts to lower energy consumption as well as meet decarbonization and sustainability goals by various building owners drove market growth in the forecast period.
Key Highlights
- The occupancy tracking technologies help businesses meet their ongoing goals of using only suitable building space to keep costs low and operate efficiently. Occupancy monitoring sensors are essential for anyone wanting to manage their buildings smartly and more efficiently.
- Many associations waste as much as half their space. In other words, their preservation potential is vast. According to a World Green Building Study, European businesses could save USD 243 billion by reducing wasted space in office buildings. In addition, businesses globally could realize savings of up to USD 1.5 trillion if workspaces were optimized. Other sources suggest that, on average, desks and offices sit unused about two-thirds of the time in North America. And a Herman Miller space utilization study found that, on average, assigned private offices are unoccupied 77% of the workday.
- The rising demand for energy-efficient devices will drive the studied market's growth. Occupancy tracking plays a vital role in reducing energy consumption. This is achieved through the occupancy sensors, which shut down devices and other equipment based on occupancy. These help reduce light pollution and can be used in indoor and outdoor spaces. For instance, in the US, lighting accounts for 11% of a building's overall energy use, with HVAC systems consuming 35%. US commercial buildings account for around 36% of all electricity use. This energy use is often considered an unavoidable expense. However, much of this energy is wasted every day. Countless businesses pay to heat, cool, and illuminate unoccupied rooms.
- The growing investment in developing smart houses, enterprise buildings, factories, and cities will drive the market forward in the forecasted period. As part of the Digital India initiative, the Indian government has planned to push IoT in the country. The government allocated an INR 7,000 crore fund to develop 100 smart cities powered by IoT appliances to control traffic, efficiently use power and water, and collect data using IoT sensors for healthcare and other services.
- Furthermore, the primary task of building management systems is to control active and passive strategies in buildings to optimize energy efficiency and maintain occupant comfort. However, most of these systems use a predefined configuration, which usually does not match the occupants preferences. Thus, occupancy tracking is imperative for energy use management, mainly in residential and industrial buildings.
- In a survey done in October 2022, 85% of customers of an occupancy technology company, Occuspace, reported using the data to gauge the use of their physical spaces. Further, Vanderbilt University reported an overwhelmingly positive response from students using the Waitz app to navigate busy times in the dining halls and libraries. In addition to Vanderbilt, Occuspace technology has recently been installed at Purdue, Columbia, UCLA, and several others.
- Although the pandemic drove a flurry of interest and investments in occupancy tracking in the near term, there were indications that the need for the technology would remain. Some of the regulations and guidelines are likely to endure in some form, as they have raised awareness about healthy spaces and safeguarded against future pandemics. Moreover, the shift to working from home and pandemic-driven financial headwinds have companies questioning the need for physical office space. Even before the pandemic, U.S. Commercial Real Estate Services estimated unused commercial property in the U.S. to be worth about USD 1 trillion.
Occupancy Tracking Market Trends
Increase in Office Building Space to Drive the Building Type Segment
- Occupancy tracking sensors are deployed in reception areas, meeting rooms, shop floors, or an entire office complex. Occupancy tracking systems provide valuable insight into how spaces are used. This insight enables better decision-making regarding the distribution of space, staff, and resources, helping companies run more efficiently and safely.
- In addition, these sensors are used in offices to efficiently manage space utilization, meeting room efficiency, and desk hoteling, among many others, by installing them in multiple strategic locations to detect motion in high-traffic areas.
- Many occupancy sensor manufacturers are actively pursuing strategic alliances to improve the user experience. In January 2022, Sensative, a Sweden-based global IoT solutions provider, and Actility, a significantly low-power wide area network connectivity solutions provider for IoTs, entered into a collaborative relationship. Along with joint work with WMW. The former has launched an integrated LoRaWAN-enabled IoT desk occupancy monitoring solution through this collaboration. To monitor desks, this solution employs an active infrared sensor.
- Increasing office space across regions may further propel the demand for occupancy tracking solutions in the market. According to the Office for National Statistics (UK), the value of new office building construction orders in the first quarter of 2023 was over USD 2.6 billion for both public and private offices combined.
- In addition, according to Colliers International, in the second quarter of 2022, the Northeast region held the most office space under construction in the United States. There were around 30 million square feet of office space under construction in the Northeast region.
- In the post-COVID-19 era, many Fortune 100 companies adopted the hybrid work model, which became commonplace across different industries. But as of March 2023, tech giants like Amazon and Apple have announced policies that require their employees to come into the office three times a week. This was an expected push for a great return to the office. Due to such dynamic changes, office occupancy rates fluctuated every week, while in those workplaces with a hot desk system, desk occupancy rates may even change daily. Such cases may further create demand for occupancy tracking in office areas.
Asia-Pacific to Experience Significant Market Growth
- Asia-Pacific is expected to have significant growth in occupancy tracking solutions during the forecast period due to the increased construction activity in the region. According to IBEF, the Dubai government and India recently signed a contract to construct infrastructure in Jammu and Kashmir, including industrial parks, IT towers, multipurpose towers, logistics centers, medical colleges, and specialized hospitals.
- Additionally, according to the National Bureau of Statistics of China, recently there were over 27,700 hotel enterprises in China, which was a boost of nearly 2,500 enterprises compared to the previous year. The number of large hotel groups in China has grown immensely in the past three years. Such developments in hotels and restaurants may further create demand in the studied market.
- The region includes significant countries such as India and China, which have the majority of energy-consuming countries worldwide. According to BP plc, China is the world's largest consumer of primary energy. The primary energy consumption of China amounted to some 157.7 exajoules recently, an increase of nearly 7% compared to the previous year.
- Furthermore, the Ministry of Land, Infrastructure, and Transport of the South Korean government announced its initiative to develop smart city platforms across 64 selected medium- and small-sized cities by 2022 through a state project worth USD 25 million. Similar outcomes being deployed in other parts of the world are increasing the demand for the occupancy tracking sensor.
- According to the smart city mission rules, the Central Government is expected to contribute INR 48,000 crore in funding over five years to assist the mission's implementation, or an average of INR 100 crore per year for each city.
- Moreover, in 2022, the room occupancy rate of accommodation facilities in Japan amounted to 46.5%, as per MLIT (Japan). The figure recovered compared to the previous years but was strongly impacted by the COVID-19 pandemic, which was recorded at 34.3%. Further, the southwestern city of Mumbai had the highest occupancy rate of about 60% in India, followed by the capital city of New Delhi in 2022. Such developments may further drive the demand for occupancy tracking systems to properly monitor hotel space and customers.
Occupancy Tracking Industry Overview
The occupancy tracking market is significantly competitive, with several major players performing in the market and taking steps to expand their market footprint by focusing on product diversification. The players strengthen their product portfolio by adopting several strategies, including new product developments, partnerships, mergers, additions, etc., to gain a competitive edge over other players.
In January 2023, indie Semiconductor, an Autotech solutions innovator, announced a partnership with Seeing Machines, one of the leading computer vision technology companies, to complement the development of advanced vision processors for driver and vehicle occupant monitoring.
In November 2022, Occupancy technology company Occuspace announced its expansion into several colleges and universities in the U.S. and Canada to report real-time and historical space usage data for campus buildings to anyone using their Waitz mobile app, which was especially useful to students seeking places to study.
In August 2022, Fusion92, a Chicago-based marketing innovation firm with offices in Chicago, Detroit, and Austin, partnered with Occuspace, a significant occupancy monitoring technology firm, to provide innovative analytics solutions that assist retailers in better understanding foot traffic data, closing the media attribution loop, uncovering new brick-and-mortar insights, and improving the customer experience.
Additional Benefits:
- The market estimate (ME) sheet in Excel format
- 3 months of analyst support
TABLE OF CONTENTS
1 INTRODUCTION
- 1.1 Study Assumptions and Market Definition
- 1.2 Scope of the Study
2 RESEARCH METHODOLOGY
3 EXECUTIVE SUMMARY
4 MARKET INSIGHTS
- 4.1 Market Overview
- 4.2 Industry Attractiveness - Porter's Five Forces Analysis
- 4.2.1 Bargaining Power of Suppliers
- 4.2.2 Bargaining Power of Buyers
- 4.2.3 Threat of New Entrants
- 4.2.4 Threat of Substitutes
- 4.2.5 Intensity of Competitive Rivalry
- 4.3 Industry Value Chain Analysis
- 4.4 Assessment of Impact of COVID-19 on the Market
5 MARKET DYNAMICS
- 5.1 Market Drivers
- 5.1.1 Increasing Need for Space Utilization and Optimization in Buildings
- 5.1.2 Rising Demand for Energy-efficient Devices
- 5.2 Market Challenges
- 5.2.1 Lack of Awareness Regarding the Benefits of Occupancy Tracking
6 MARKET SEGMENTATION
- 6.1 By Offering Type
- 6.1.1 Hardware
- 6.1.2 Software
- 6.1.3 Services
- 6.2 By Building Types
- 6.2.1 Office
- 6.2.2 Retail
- 6.2.3 Education
- 6.2.4 Healthcare
- 6.2.5 Hotels& Restaurants
- 6.2.6 Institutional/Assembly
- 6.2.7 Warehouse
- 6.2.8 Transport
- 6.3 By Geography
- 6.3.1 North America
- 6.3.2 Europe
- 6.3.3 Asia-Pacific
- 6.3.4 Latin America
- 6.3.5 Middle East and Africa
7 COMPETITIVE LANDSCAPE
- 7.1 Company Profiles
- 7.1.1 Honeywell International
- 7.1.2 Eaton Corporation
- 7.1.3 Schneider Electric
- 7.1.4 Legrand Inc.
- 7.1.5 Leviton Manufacturing Company
- 7.1.6 Philips Ltd
- 7.1.7 Hubbell Building Automation Inc.
- 7.1.8 Johnson Controls GmbH
- 7.1.9 Lutron Electronics, Inc.
- 7.1.10 General Electric
- 7.1.11 Acuity Brands
8 INVESTMENT ANALYSIS
9 FUTURE OF THE MARKET
 全球工具追踪软体市场:按组件、公司规模、部署方式、作业系统、应用、产业和地区划分 - 市场预测与分析 (2025-2033)
 风暴追踪应用市场机会、成长动力、产业趋势分析及 2025 - 2034 年预测
 入住率追踪市场规模、份额、成长分析、按产品类型、按技术、按应用、按部署类型、按最终用户、按地区 - 行业预测,2025 年至 2032 年
 全球交通监控市场全球即时包裹追踪市场
 交通监控市场:按组件、按运输方式、按应用、按最终用户、按地区
 即时包裹追踪市场、占有率、规模、趋势、行业分析报告:依服务产品、依技术、依最终用途行业、依地区、细分市场预测,2024-2032 年即时包裹追踪市场:按组件、按技术、按最终用户行业、按公司规模、按地区