


 |
市场调查报告书
商品编码
1433807
软性玻璃:市场占有率分析、产业趋势、成长预测(2024-2029)Flexible Glass - Market Share Analysis, Industry Trends & Statistics, Growth Forecasts (2024 - 2029) |
||||||
※ 本网页内容可能与最新版本有所差异。详细情况请与我们联繫。
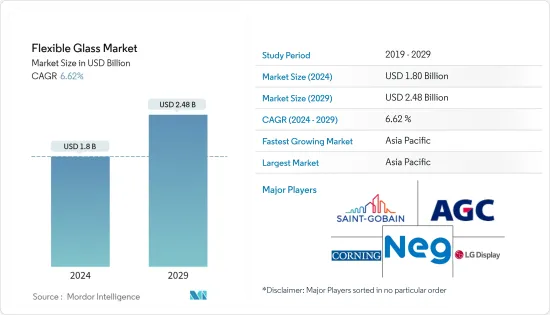
预计2024年软性玻璃市场规模为18亿美元,到2029年预计将达到24.8亿美元,在预测期内(2024-2029年)复合年增长率为6.62%。
COVID-19大流行对软性玻璃市场产生了负面影响。然而,由于製造轻、薄、坚固和可携式电子产品等各种应用的消费增加,市场在 2021 年显着復苏。
主要亮点
- 电气和电子行业以及消费品行业对软性玻璃的需求不断增加以及原材料成本的下降预计将在预测期内推动市场发展。
- 硅气导致的生产复杂性、环境问题和健康问题预计将在中期阻碍市场成长。
- 软性玻璃在太阳能电池板、汽车和国防领域的使用越来越多,预计将为製造商提供广泛的机会。
- 亚太地区是最大的市场,由于中国、印度和日本等国家的消费不断增长,预计亚太地区将成为预测期内成长最快的市场。
软性玻璃市场趋势
太阳能板的需求增加
- 使用玻璃是因为其具有成本低、重量轻、耐热、防水、耐刮等优点。主要最终用户产业包括电气/电子、汽车和光电子。
- 太阳能板製造是软性玻璃的第二大应用领域。日本、中国等新兴经济体的需求远高于美国、法国等已开发国家的需求。
- 在太阳能产业,对轻质和无刮痕材料的需求不断增加,以提高设计弹性并提供超薄玻璃,这是软性玻璃市场成长的关键驱动力。
- 此外,推动太阳能板成长的因素之一是全球不断增加对可再生能源的投资,以减少碳排放。
- 除了65亿美元的农村电力融资外,美国2023年预算还拨款3亿美元帮助农村公用事业公司转型可再生能源。
- 2022 年 12 月,加州公共产业委员会核准了新的净计量法规,该法规将于 2023 年 4 月生效,最终以低于零售价约 75% 的价格补偿出口太阳能。与传统思维相反,没有固定费用,也没有过渡期。
- 根据美国可再生能源实验室 (NREL) 的数据,有 16 个州 5% 以上的电力来自太阳能,其中加州以 27.3% 的比例领先。美国也将在 2022 年安装 17.0 吉瓦 (GWac) (20.2GWdc) 的光伏(太阳能发电),到年底光伏累积装置容量将达到 110.1GWac (140.6GWdc)。
- 作为法国 2030 年国家投资计画的一部分,法国政府将投资 10 亿欧元(约 11.3 亿美元)用于促进可再生能源的发展。最终目标是到 2050 年将可再生能源的引入量增加 10 倍,达到 100 吉瓦。总设备容量中,40GW将来自离岸风力发电计划。
- 由于上述因素,预计在整个预测期内对软性玻璃的需求将会增加。
亚太地区主导市场
- 由于中国、韩国和日本等国家对太阳能板和光伏电池製造的需求不断增加,预计亚太地区将在预测期内主导软性玻璃市场。
- 到2025年,世界将几乎完全依赖中国来供应太阳能板生产的关键零件。
- 根据中国国家能源局1月下旬发布的消息,2022年中国装机容量为87吉瓦(GW),与前一年同期比较增长59%。
- 根据国家可再生能源实验室(NREL)预测,2022年中国将安装87GW太阳能发电,与前一年同期比较成长59%。此外,2022 年前 9 个月,印度光电装置成长了 51%。
- 在印度,为支持大型併网发电工程,正在实施「发展太阳能园区和超大型发电工程」计划,目标容量到2024年3月达到40GW。 2022年1月至10月,各太阳能园区计画启动832MW太阳能发电工程。
- 近年来,日本大幅增加了可再生能源发电量,使其成为可再生能源装置容量最大的国家之一。根据新的战略能源计划,日本政府设定了2030年将可再生能源份额提高到38%的目标。此外,我们的目标是到 2050 年实现完全碳中和。
- 因此,上述因素和政府支持正在推动预测期内亚太地区软性玻璃市场的需求不断增加。
其他福利:
- Excel 格式的市场预测 (ME) 表
- 3 个月分析师支持
目录
第一章简介
- 研究成果
- 研究场所
- 调查范围
第二章调查方法
第三章执行摘要
第四章市场动态
- 促进因素
- 电气/电子和消费品产业的需求增加
- 降低原料成本
- 其他司机
- 抑制因素
- 製造复杂性
- 硅粉引起的环境问题与健康问题
- 其他阻碍因素
- 价值链/供应链分析
- 波特五力分析
- 供应商的议价能力
- 消费者议价能力
- 新进入者的威胁
- 替代品的威胁
- 竞争程度
第五章市场区隔(以金额为准的市场规模)
- 应用
- 展示
- 太阳能板
- 光伏电池
- 其他的
- 最终用户产业
- 电力/电子
- 车
- 医疗保健
- 穿戴式装置
- 其他的
- 地区
- 亚太地区
- 中国
- 印度
- 日本
- 韩国
- 其他亚太地区
- 北美洲
- 美国
- 加拿大
- 墨西哥
- 欧洲
- 德国
- 英国
- 法国
- 义大利
- 其他欧洲国家
- 南美洲
- 巴西
- 阿根廷
- 南美洲其他地区
- 中东/非洲
- 沙乌地阿拉伯
- 南非
- 其他中东/非洲
- 亚太地区
第六章 竞争形势
- 併购、合资、联盟、协议
- 市场占有率分析(%)**/排名分析
- 主要企业策略
- 公司简介
- Abrisa Technologies
- AGC Inc.
- Corning Incorporated
- DuPont
- Kent Displays, Inc.
- KYOCERA Corporation
- LG DISPLAY CO., LTD
- Murata Manufacturing Co., Ltd
- Nippon Electric Glass Co. Ltd
- Saint-Gobain
- SCHOTT AG
- UNIVERSAL DISPLAY
第七章 市场机会及未来趋势
The Flexible Glass Market size is estimated at USD 1.8 billion in 2024, and is expected to reach USD 2.48 billion by 2029, growing at a CAGR of 6.62% during the forecast period (2024-2029).
The COVID-19 pandemic negatively impacted the flexible glass market. However, the market recovered significantly in 2021, owing to rising consumption from various applications such as producing lightweight, thin, robust, and portable electronics.
Key Highlights
- Increasing demand for flexible glass from electrical and electronics and consumer goods industries and lower cost of raw materials is expected to drive the market during the forecast period.
- High production complexity, environmental concerns, and health issues due to silica fumes will likely hinder market growth over the medium term.
- Increasing usage of flexible glass in solar panels, automotive, and defense sectors is expected to provide wide opportunities for manufacturers.
- Asia-Pacific represents the largest market and is expected to be the fastest-growing market over the forecast period, owing to the increasing consumption from countries such as China, India, and Japan.
Flexible Glass Market Trends
Increasing Demand for Solar Panels
- Glass is used owing to its advantages, such as low cost, less weight, heat, water resistance, scratch-resistant, etc. Some major end-user industries include electrical and electronics, automotive, Opto-electronics, etc.
- Manufacturing of solar panels is the second-largest application segment for flexible glass. The demand from thriving economies like Japan and China is much higher than that from developed countries like the United States and France.
- Growing demand for lightweight and scratch-free materials in the solar energy industry to provide increased design flexibility and ultra-slim glass is primarily responsible for the growth of the flexible glass market.
- In addition, one of the boosting factors for these solar panels is the increasing investment in a renewable energy source to reduce carbon emissions worldwide.
- In addition to USD 6.5 billion for loans for rural power, the 2023 budget of the US Department of Agriculture (USDA) allocated USD 300 million to help rural electricity providers switch to renewable energy sources.
- In December 2022, the California Public Utilities Commission approved new net metering regulations that will go into effect in April 2023 and eventually reimburse exported solar energy at prices approximately 75% less than retail. In contrast to the prior idea, there are no set fees and a transitional period.
- According to National Renewable Energy Laboratory (NREL), 16 states generated more than 5% of their electricity from solar, with California leading the way at 27.3%. The United States also installed 17.0 gigawatts of alternating current (GWac) (20.2 GWdc) of PV (photovoltaic) in 2022, ending the year with 110.1 GWac (140.6 GWdc) of cumulative PV installations.
- The French government will invest EUR 1 billion (~USD 1.13 billion) in initiatives to advance renewable energy as part of the France 2030 National Investment Plan. The ultimate goal is to install ten times as much renewable energy by 2050, or up to 100 GW. 40 GW of total installed capacity will come from offshore wind projects.
- All the factors above are anticipated to increase the demand for flexible glass through the forecast period.
Asia-Pacific to Dominate the Market
- Asia-Pacific is expected to dominate the flexible glass market during the forecast period due to the increasing demand for solar panels and voltaic cell manufacturing in countries such as China, South Korea, and Japan.
- The world will almost completely rely on China to supply key building blocks for solar panel production through 2025.
- According to information released by the National Energy Administration of China in late January, China installed 87 gigawatts (GW) in 2022, up 59% year over year (y/y).
- According to National Renewable Energy Laboratory (NREL), China installed 87 GW of solar in 2022, a 59% increase from the previous year. Furthermore, PV installations in India increased by 51% during the first nine months of 2022
- In India, a "Development of Solar Parks and Ultra Mega Solar Power Projects" plan is being implemented with a goal capacity of 40 GW by March 2024 to support big-scale grid-connected solar power projects. Solar projects capacity of 832 MW will be commissioned in various Solar Parks from January to October 2022.
- Japan substantially increased its electricity production from renewable energy sources in recent years, making it one of the top nations in installed renewable energy capacity. The Japanese government raised its objective for the proportion of renewable energy to 38% by 2030 under the new Strategic Energy Plan. Additionally, by 2050, the nation wants to be completely carbon neutral.
- Therefore, the abovementioned factors and government support contribute to the increasing demand for the flexible glass market in Asia-Pacific during the forecast period.
Flexible Glass Industry Overview
The flexible glass market is consolidated in nature. The major players (not in any particular order) include Saint-Gobain, AGC Inc., Corning Incorporated, LG DISPLAY CO., LTD., and Nippon Electric Glass Co. Ltd, among others.
Additional Benefits:
- The market estimate (ME) sheet in Excel format
- 3 months of analyst support
TABLE OF CONTENTS
1 INTRODUCTION
- 1.1 Study Deliverables
- 1.2 Study Assumptions
- 1.3 Scope of the Study
2 RESEARCH METHODOLOGY
3 EXECUTIVE SUMMARY
4 MARKET DYNAMICS
- 4.1 Drivers
- 4.1.1 Increasing Demand From Electrical and Electronics and Consumer Goods Industries
- 4.1.2 Lower Cost of Raw Material
- 4.1.3 Other Drivers
- 4.2 Restraints
- 4.2.1 High Production Complexity
- 4.2.2 Environmental Concerns and Health Issues due to Silica Fumes
- 4.2.3 Other Restraints
- 4.3 Value Chain / Supply Chain Analysis
- 4.4 Porter's Five Forces Analysis
- 4.4.1 Bargaining Power of Suppliers
- 4.4.2 Bargaining Power of Consumers
- 4.4.3 Threat of New Entrants
- 4.4.4 Threat of Substitute Products and Services
- 4.4.5 Degree of Competition
5 MARKET SEGMENTATION (Market Size in Value)
- 5.1 Application
- 5.1.1 Display
- 5.1.2 Solar Panel
- 5.1.3 Photovoltaic Cell
- 5.1.4 Other Applications
- 5.2 End-user Industry
- 5.2.1 Electrical and Electronics
- 5.2.2 Automotive
- 5.2.3 Medical
- 5.2.4 Wearable Devices
- 5.2.5 Other End-user Industries
- 5.3 Geography
- 5.3.1 Asia-Pacific
- 5.3.1.1 China
- 5.3.1.2 India
- 5.3.1.3 Japan
- 5.3.1.4 South Korea
- 5.3.1.5 Rest of Asia-Pacific
- 5.3.2 North America
- 5.3.2.1 United States
- 5.3.2.2 Canada
- 5.3.2.3 Mexico
- 5.3.3 Europe
- 5.3.3.1 Germany
- 5.3.3.2 United Kingdom
- 5.3.3.3 France
- 5.3.3.4 Italy
- 5.3.3.5 Rest of Europe
- 5.3.4 South America
- 5.3.4.1 Brazil
- 5.3.4.2 Argentina
- 5.3.4.3 Rest of South America
- 5.3.5 Middle East & Africa
- 5.3.5.1 Saudi Arabia
- 5.3.5.2 South Africa
- 5.3.5.3 Rest of Middle East & Africa
- 5.3.1 Asia-Pacific
6 COMPETITIVE LANDSCAPE
- 6.1 Mergers and Acquisitions, Joint Ventures, Colaborations and Agreements
- 6.2 Market Share Analysis (%)**/Ranking Analysis
- 6.3 Strategies Adopted by Leading Players
- 6.4 Company Profiles
- 6.4.1 Abrisa Technologies
- 6.4.2 AGC Inc.
- 6.4.3 Corning Incorporated
- 6.4.4 DuPont
- 6.4.5 Kent Displays, Inc.
- 6.4.6 KYOCERA Corporation
- 6.4.7 LG DISPLAY CO., LTD
- 6.4.8 Murata Manufacturing Co., Ltd
- 6.4.9 Nippon Electric Glass Co. Ltd
- 6.4.10 Saint-Gobain
- 6.4.11 SCHOTT AG
- 6.4.12 UNIVERSAL DISPLAY
7 MARKET OPPORTUNITIES AND FUTURE TRENDS
- 7.1 Increasing Usage in Solar panels, Automotive, and Defense Sector
- 7.2 Other Opportunities
 软性玻璃市场规模、份额和成长分析(按形状、技术、透光率、应用和地区划分)-2026-2033年产业预测
 软性玻璃:全球市场份额和排名、总销售额和需求预测(2025-2031 年)
 2025年全球玻璃软性显示器市场报告
 2025 年至 2033 年柔性玻璃市场报告,按应用(显示器、感测器、光伏电池等)、最终用途产业(电子、汽车、能源等)和地区划分
 全球软性玻璃市场规模、份额和趋势分析:按应用、最终用途、地区、前景和预测,2024-2031年
 软性玻璃市场:按产品类型、应用、技术、厚度划分 - 2025-2030 年全球预测
 全球软性玻璃市场