


 |
市场调查报告书
商品编码
1433946
乙酰丙酸:市场占有率分析、产业趋势/统计、成长预测(2024-2029)Levulinic Acid - Market Share Analysis, Industry Trends & Statistics, Growth Forecasts (2024 - 2029) |
||||||
※ 本网页内容可能与最新版本有所差异。详细情况请与我们联繫。
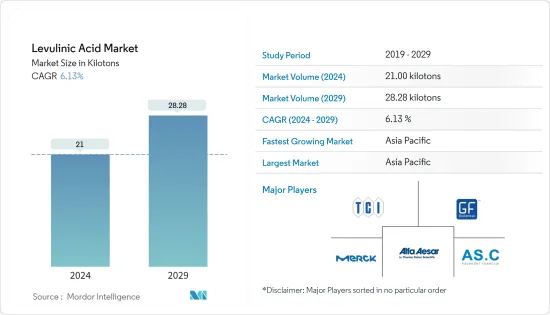
乙酰丙酸市场规模预计到2024年为21吨,预计2029年将达到28.28吨,在预测期(2024-2029年)复合年增长率为6.13%。
受COVID-19影响,包括化学工业在内的各行业生产减少,各行业原料供应受到较大影响。受疫情影响,乙酰丙酸市场出现负成长。然而,随着所有行业生产流程的恢復,预计市场将在 2022 年保持成长轨迹。
主要亮点
- 从中期来看,推动市场成长的主要因素被认为是作为传统肥料替代品的使用量不断增加。
- 另一方面,替代品的替代品预计将阻碍市场成长。
- 生物基乙酰丙酸的日益普及代表着不久的将来市场成长的机会。
- 预计亚太地区将主导市场,并可能在预测期内呈现最高的复合年增长率。
乙酰丙酸市场趋势
化妆品和个人护理主导市场
乙酰丙酸及其盐(主要是乙酰丙酸钠)是水溶性的。它们通常用于美容和个人保健产品,因为它们已获得美国食品药物管理局(FDA) 的核准。此外,欧盟化妆品法规并未限制这些成分的使用。
根据FDA的化妆品自愿註册计画(VCRP)调查资料,大约有130种化妆品配方中使用了乙酰丙酸,大约400种化妆品配方中使用了乙酰丙酸钠。乙酰丙酸盐在染髮剂中的最高浓度约为4.5%,而乙酰丙酸钠用于漱口水和口气清新剂中的最高浓度为0.62%。
线上美容消费的持续增长、社交网络的使用不断增加、消费者对新高级产品的兴趣增加、都市化加快以及中上阶层人口的增长正在推动全球化妆品的增长,这些是主要因素带动市场。它有奶油威士忌的香味。乙酰丙酸将广泛用于香水生产。
根据欧洲化妆品协会统计,欧洲化妆品及个人护理市场是全球最大的化妆品市场,2021年零售约850亿美元。美国每位消费者每年在化妆品、香水和沐浴产品上的平均支出约为 180 美元。
乙酰丙酸也用作农业肥料,以提高作物产量。乙酰丙酸盐金属塑化剂通常用于邻苯二甲酸酯塑化剂,因为它们与聚乳酸等亲水性生物聚合物完美配合。
美国是北美最大的化肥市场,约占2021年总市场价值的82.1%,约占北美农地总面积的73.6%。法国是欧洲最大的化肥消费国之一,预计年终整体份额将达到20.1%。
乙酰丙酸衍生物广泛用于燃料添加剂以改善燃料性能。世界各地的公司正在推出服务广泛应用的新产品。例如,Nxtlevvel和Elementis计划于2022年初联合推出两种用于工业油漆和涂料领域的生物基乙酰丙酸溶剂。
美国被认为是全球乙酰丙酸需求的核心。 2022年,美国能源局将乙酰丙酸认定为绿色工业学製程开发的关键平台化学品。
所有上述因素预计都会在预测期内影响所研究的市场。
亚太地区主导市场
亚太地区是乙酰丙酸的最大市场。预计它也将成为预测期内成长最快的市场。其主导地位主要归功于中国、印度和日本等国家。
中国和印度等国家是化肥的最大消费国,尤其是在人口持续成长且农业用地有限的情况下。因此,这些国家对肥料的需求更高。
乙酰丙酸因其多种特性而被广泛用于化妆品和个人保健产品,包括作为温和的防腐剂和优异的抗菌特性。根据经济产业省预计, 年终,印度美容及个护产业规模将达120亿美元以上,年增率为6.5%。
根据全球主要出口国统计,2021年中国为全球第三大化妆品进口国,进口总额约185亿美元。香港2021年进口了价值73亿美元的护肤和化妆品,成为亚太地区第二大化妆品进口国。
中国是化妆品主要消费国之一,中国化妆品产业乙酰丙酸的消费量不断增加。 2022年,中国批发零售企业化妆品零售总额达约550亿美元。
据估计,到年终,泰国美容及个人护理市场收益预计将达到57.6亿美元。 2021年,泰国奢侈化妆品和香水的市场价值达到约3.4亿美元。
化妆品行业的公司专注于扩大产品系列,以扩大美容和化妆品业务。例如,2021年10月,丝芙兰中国推出了51个品牌的240余款美妆新品,揭晓了7个C级美妆品牌的新品以及5个海外小众品牌的国内首发。
因此,所有上述因素预计将在预测期内推动该地区的市场成长。
乙酰丙酸产业概况
乙酰丙酸市场整合,少数公司控制大部分市场占有率。市场的主要企业包括 GFBiochemicals Ltd、Alfa Aesar-Thermo Fisher Scientific、Tokyo Kasei 工业、Ascender Chemical 和 Merck KGaA。
其他福利
- Excel 格式的市场预测 (ME) 表
- 3 个月分析师支持
目录
第一章简介
- 调查先决条件
- 调查范围
第二章调查方法
第三章执行摘要
第四章市场动态
- 促进因素
- 扩大使用范围作为传统肥料的替代品
- 其他司机
- 抑制因素
- 由于 COVID-19 的影响,情况不利
- 产业价值链分析
- 波特五力分析
- 供应商的议价能力
- 消费者议价能力
- 新进入者的威胁
- 替代品的威胁
- 竞争程度
第五章市场区隔(市场规模(基于数量))
- 最终用户产业
- 化妆品/个人护理
- 药品
- 聚合物/塑化剂
- 燃油/燃油添加剂
- 香味
- 其他最终用户产业
- 地区
- 亚太地区
- 中国
- 印度
- 日本
- 韩国
- 其他亚太地区
- 北美洲
- 美国
- 加拿大
- 墨西哥
- 欧洲
- 德国
- 英国
- 法国
- 义大利
- 其他欧洲国家
- 南美洲
- 巴西
- 阿根廷
- 南美洲其他地区
- 中东/非洲
- 沙乌地阿拉伯
- 南非
- 其他中东和非洲
- 亚太地区
第六章 竞争形势
- 併购、合资、联盟、协议
- 市场占有率(%)分析**/市场排名分析
- 主要企业策略
- 公司简介
- AK Scientific Inc.
- Alfa Aesar, Thermo Fisher Scientific
- Aromalake Chemical Co. Ltd
- Ascender Chemical Co. Ltd
- Bio-On SpA
- Boerchem Pharmtech Co. Ltd
- GC Innovation America
- GFBiochemicals Ltd
- Merck KGaA
- Summit Cosmetics Corporation
- Tokyo Chemical Industry Co. Ltd
第七章 市场机会及未来趋势
- 扩大生物基乙酰丙酸的普及
The Levulinic Acid Market size is estimated at 21 kilotons in 2024, and is expected to reach 28.28 kilotons by 2029, growing at a CAGR of 6.13% during the forecast period (2024-2029).
Due to COVID-19, production in various chemical and other industries decreased, and the supply of raw materials to industries was significantly affected. The unfavorable conditions arising from the pandemic resulted in the negative growth of the Levulinic Acid Market. However, the market was anticipated to retain its growth trajectory in 2022 due to the resumed production processes of all industries.
Key Highlights
- Over the medium term, the major factor driving the market's growth studied is the increasing usage as substitutes for traditional fertilizers.
- On the flip side, the substitution from alternatives is expected to hinder the market's growth.
- The growing prevalence of bio-based levulinic acid is an opportunity for market growth shortly.
- The Asia-Pacific region is expected to dominate the market and will likely witness the highest CAGR during the forecast period.
Levulinic Acid Market Trends
Cosmetics and Personal Care to Dominate the Market
Levulinic acid and its salts (majorly sodium levulinate) are water-soluble. They are commonly used in beauty and personal care products, as it is approved by the US Food and Drug Administration (FDA). Moreover, the rules governing cosmetic products in the European Union do not restrict these ingredients' use.
According to the FDA's Voluntary Cosmetic Registration Program (VCRP) survey data, levulinic acid is used in around 130 cosmetic formulations, and sodium levulinate is used in approximately 400 cosmetic formulations; levulinic acid has the highest maximum concentration of around 4.5% in hair dyes, while sodium levulinate is used at a maximum concentration of 0.62% in mouthwashes and breath fresheners.
Continuous growth in online beauty spending, expanding social network use, increasing consumer interest in new and premium products, accelerating urbanization, and the growth of the upper-middle-class population are the major factors driving the cosmetics market worldwide-the creamy, whisky fragrance of levulinic acid results in its heavy usage in the manufacturing of perfumes.
According to Cosmetics Europe, the European cosmetics and personal care market is the world's largest cosmetic product market, valued at approximately USD 85 billion at a retail sales price in 2021. The average annual expenditure on cosmetics, perfume, and bath preparation products amounted to approximately USD 180 per consumer unit in the United States.
Also, these ingredients are reportedly safe for use in products that come in contact with the eyes. For instance, sodium levulinate is used up to 0.57% in eye shadows and lotions.
Levulinic acid is also used as fertilizer for high crop yields in agriculture. Levulinic acid metal plasticizers are highly used in phthalate plasticizers because they work perfectly with hydrophilic biopolymers like polylactic acid.
The United States is the largest fertilizer market in the North America region, accounting for about 82.1% of the total market value in 2021 and occupying about 73.6% of the total agricultural land in North America. France is one of the largest fertilizer-consuming countries in Europe, with an expected overall share of 20.1% by the end of 2022.
Levulinic acid derivatives are broadly used in fuel additives to advance fuel properties. Companies across the globe are introducing new products catering to a wide range of applications. For instance, Nxtlevvel and Elementis plan to launch two bio-based levulinic solvents for the industrial paints and coatings sector together in early 2022.
The United States is considered the nucleus of global demand for levulinic acid. In 2022, the United States Department of Energy identified levulinic acid as an important platform chemical for green industrial chemical process development.
All the factors mentioned above, in turn, are projected to impact the market studied during the forecast period.
Asia-Pacific to Dominate the Market
Asia-Pacific is the largest market for levulinic acid. It is also expected to be the fastest-growing market during the forecast period. The dominance is majorly attributed to the countries such as China, India, and Japan.
Countries like China and India are the largest consumers of fertilizers, especially because of their ever-increasing population and limited agricultural land. Hence, the need for fertilizers is high in these countries.
Levulinic acid is extensively used in cosmetics and personal care products due to its various properties, such as acting as a mild preservative with good antibacterial properties. According to the Ministry of Economy and Industry, India's beauty and personal care industry is expected to reach more than USD 12 billion by the end of 2023, with an annual growth rate of 6.5 %.
According to the World's Top Exporters, China was the third-largest importer of cosmetics in the world in 2021, with a total value of about USD 18.5 billion. Hong Kong, which imported skincare and cosmetics worth over USD 7.3 billion in 2021, was the next-largest cosmetics importer in Asia-Pacific.
China is one of the major consumers of cosmetics, which increases the consumption of levulinic acid from the cosmetics segment of the country. In 2022, wholesale and retail companies' retail sales of cosmetics in China totaled about USD 55 billion.
According to estimates, revenue in Thailand's beauty and personal care market is expected to reach USD 5.76 billion by the end of 2023. In 2021, Thailand's prestige cosmetic and fragrance market value amounted to around USD 340 million.
The players operating in the cosmetics industry focus on expanding their product portfolio to expand their beauty and cosmetics. For instance, in October 2021, Sephora China released more than 240 new beauty products from 51 brands, revealing the newness of 7 C-beauty brands and the domestic debut of five overseas niche brands.
Thus, all the factors above are expected to drive market growth in the region during the forecast period.
Levulinic Acid Industry Overview
The Levulinic Acid Market is consolidated, with a few companies controlling the majority share in the market. The major companies in this market include GFBiochemicals Ltd, Alfa Aesar - Thermo Fisher Scientific, Tokyo Chemical Industry Co. Ltd, Ascender Chemical Co. Ltd, and Merck KGaA.
Additional Benefits:
- The market estimate (ME) sheet in Excel format
- 3 months of analyst support
TABLE OF CONTENTS
1 INTRODUCTION
- 1.1 Study Assumptions
- 1.2 Scope of the Study
2 RESEARCH METHODOLOGY
3 EXECUTIVE SUMMARY
4 MARKET DYNAMICS
- 4.1 Drivers
- 4.1.1 Increasing Usage as a Substitute for Traditional Fertilizer
- 4.1.2 Other Drivers
- 4.2 Restraints
- 4.2.1 Unfavorable Conditions Arising Due to the COVID-19 Impact
- 4.3 Industry Value Chain Analysis
- 4.4 Porter's Five Forces Analysis
- 4.4.1 Bargaining Power of Suppliers
- 4.4.2 Bargaining Power of Consumers
- 4.4.3 Threat of New Entrants
- 4.4.4 Threat of Substitute Products and Services
- 4.4.5 Degree of Competition
5 MARKET SEGMENTATION (Market Size in Volume)
- 5.1 End-user Industry
- 5.1.1 Cosmetics and Personal Care
- 5.1.2 Pharmaceuticals
- 5.1.3 Polymers and Plasticizers
- 5.1.4 Fuel and Fuel Additives
- 5.1.5 Flavors and Fragrances
- 5.1.6 Other End-user Industries
- 5.2 Geography
- 5.2.1 Asia-Pacific
- 5.2.1.1 China
- 5.2.1.2 India
- 5.2.1.3 Japan
- 5.2.1.4 South Korea
- 5.2.1.5 Rest of Asia-Pacific
- 5.2.2 North America
- 5.2.2.1 United States
- 5.2.2.2 Canada
- 5.2.2.3 Mexico
- 5.2.3 Europe
- 5.2.3.1 Germany
- 5.2.3.2 United Kingdom
- 5.2.3.3 France
- 5.2.3.4 Italy
- 5.2.3.5 Rest of Europe
- 5.2.4 South America
- 5.2.4.1 Brazil
- 5.2.4.2 Argentina
- 5.2.4.3 Rest of South America
- 5.2.5 Middle-East and Africa
- 5.2.5.1 Saudi Arabia
- 5.2.5.2 South Africa
- 5.2.5.3 Rest of Middle-East and Africa
- 5.2.1 Asia-Pacific
6 COMPETITIVE LANDSCAPE
- 6.1 Mergers and Acquisitions, Joint Ventures, Collaborations, and Agreements
- 6.2 Market Share (%) Analysis** / Market Ranking Analysis
- 6.3 Strategies Adopted by Leading Players
- 6.4 Company Profiles
- 6.4.1 AK Scientific Inc.
- 6.4.2 Alfa Aesar, Thermo Fisher Scientific
- 6.4.3 Aromalake Chemical Co. Ltd
- 6.4.4 Ascender Chemical Co. Ltd
- 6.4.5 Bio-On SpA
- 6.4.6 Boerchem Pharmtech Co. Ltd
- 6.4.7 GC Innovation America
- 6.4.8 GFBiochemicals Ltd
- 6.4.9 Merck KGaA
- 6.4.10 Summit Cosmetics Corporation
- 6.4.11 Tokyo Chemical Industry Co. Ltd
7 MARKET OPPORTUNITIES AND FUTURE TRENDS
- 7.1 Growing Prevalence of Bio-based Levulinic Acid
 2025-2033年乙酰丙酸市场报告,依技术(酸水解、生物精炼)、最终用途产业(农业、製药、食品、化妆品等)、形态(液体、固体)和地区划分
 乙酰丙酸乙酯市场规模、份额、成长分析、按製造流程、按物理状态、按纯度等级、按应用、按最终用户行业、按地区、按行业预测(2025-2032 年)
 乙酰丙酸市场:按技术、形式、应用和地区划分,2026 年至 2032 年全球乙酰丙酸市场研究报告 - 产业分析、规模、份额、成长、趋势和预测 2025 年至 2033 年
 乙酰丙酸乙酯市场规模、份额、趋势分析报告:按类型、应用、地区、细分市场预测,2025-2030 年
 乙酰丙酸市场:按技术、应用和最终用途分类 - 全球预测 2025-2030
 乙酰丙酸市场(应用:农业、塑化剂、化妆品、食品和饮料、药品等)- 2023-2031 年全球产业分析、规模、份额、成长、趋势和预测