


 |
市场调查报告书
商品编码
1434286
可变工作技术:市场占有率分析、产业趋势/统计、成长预测(2024-2029)Variable Rate Technology - Market Share Analysis, Industry Trends & Statistics, Growth Forecasts (2024 - 2029) |
||||||
※ 本网页内容可能与最新版本有所差异。详细情况请与我们联繫。
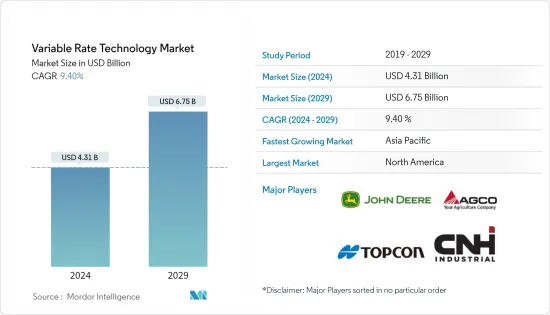
2024年可变工作技术市场规模预计为43.1亿美元,预计到2029年将达到67.5亿美元,在预测期内(2024-2029年)增长9.40%,以复合年增长率增长。
从目前的产业市场动态来看,即使在美国等已开发国家,可变利率技术的采用率仍然很低。世界各地农学家正在进行的研究表明,可变比率技术对作物产量有正面影响,有助于降低成本、增加产量和提高投入效率。因此,人们对采用浮动利率应用程式的经济效益的认识不断提高,可能会在预测期内推动市场发展。
可变工作技术市场趋势
农业部门更采用数位技术
创新和科技正带动各领域的重大发展,农业就是其中之一。感测技术、软体应用、通讯系统、资料分析解决方案、定位技术等是精密农业中使用的一些最新技术。无人机、自动挤乳系统和无人机作物散布等各种技术为精密农业的发展提供了重要且有吸引力的机会。正如联合国贸易和发展会议2019年9月指出的那样,农业数位技术的采用多年来呈现显着增长。例如,2019年,自动区段控制、可变速率技术、高精度测绘、产量监测、卫星或航空成像、叶绿素感测器的份额分别为40%、31%、48%、44%、22%和5 % 。 获得。各在农业领域。因此,农业部门越来越多地采用数位技术预计将在预测期内加速可变利率技术市场的成长。
北美引领可变工作技术市场
多年来,数位技术的广泛采用使得能够以最低的成本收集大量关键资料,使现场工作更具洞察力,并提高生产力和效率。这一点还有待改进。直到最近,可变速率治疗应用的影响一直受到所用资料的粒度和及时性以及缺乏日常营运决策支援的限制。然而,根据农业部的数据,超过 60% 的美国农产品分销商提供某种类型的可变费用技术服务。相较之下,由于收集准确的现场资料的成本相对较高,目前只有不到 20% 的面积采用技术进行管理。因此,美国市场上可变费用处理应用服务的可用性不断增加可能会在预测期内加速可变费用技术市场的发展。
可变工作技术行业概览
全球可变工作技术市场是一个利基市场,各种中小企业在全球的份额微乎其微。结果,出现了非常激烈的竞争。全球不同地区的区域市场和本土企业的发展是市场区隔的主要驱动力。北美和亚太地区是竞争对手活动最活跃的两个地区。
其他福利
- Excel 格式的市场预测 (ME) 表
- 3 个月分析师支持
目录
第一章简介
- 研究成果
- 研究场所
- 调查范围
第二章调查方法
第三章执行摘要
第四章市场动态
- 市场概况
- 市场促进因素与市场约束因素介绍
- 市场驱动因素
- 市场限制因素
- 产业吸引力-波特五力分析
- 新进入者的威胁
- 买家/消费者的议价能力
- 供应商的议价能力
- 替代品的威胁
- 竞争公司之间敌对关係的强度
第五章市场区隔
- 作物类型
- 谷物/谷类
- 水果和蔬菜
- 油籽和豆类
- 经济作物
- 目的
- 肥料
- 农药
- 土壤感
- 产量监控
- 灌溉
- 其他的
- 地区
- 北美洲
- 美国
- 加拿大
- 墨西哥
- 其他北美地区
- 欧洲
- 德国
- 英国
- 法国
- 义大利
- 西班牙
- 其他欧洲国家
- 亚太地区
- 中国
- 日本
- 印度
- 韩国
- 其他亚太地区
- 南美洲
- 巴西
- 阿根廷
- 南美洲其他地区
- 中东/非洲
- 南非
- 其他中东和非洲
- 北美洲
第六章 竞争形势
- 市场占有率分析
- 最采用的策略
- 公司简介
- Deere & Company
- Trimble, Inc.
- AGCO Corporation
- Topcon Corporation
- CNH Industrial NV
- Lindsay Corporation
- Ageagle Aerial Systems
- Raven Industries, Inc.
- AG Leader Technology
- Valmont Industries, Inc.
第七章 市场机会及未来趋势
The Variable Rate Technology Market size is estimated at USD 4.31 billion in 2024, and is expected to reach USD 6.75 billion by 2029, growing at a CAGR of 9.40% during the forecast period (2024-2029).
Referring to the current market dynamics of the industry, the adoption of variable rate technology is still very low even in the developed nations such as the United States. The ongoing studies by the agronomists across the world reveal that variable rate technology can have a positive impact on the crop yield, thereby aiding in the cost reduction, yield enhancement, and enhancement ofinput efficiency. Thus, the increasing awareness of the economic advantages of variable rate application adoption is likely driving the market during the forecast period.
Variable Rate Technology Market Trends
Increasing Adoption of Digital Technologies in the Agricultural Sector
Innovation and technology have led to major developments in various areas and agriculture is one of them. Sensing technologies, software applications, communication systems, data analytics solutions, and positioning technologies are some of the latest technologies used in precision farming. Various technologies, such as driverless machinery, automated milking systems, and drone crop dusters are providing important and attractive opportunities for the growth of precision agriculture. As stated by the United Nations Conference on Trade and Development in September 2019, over the years the adoption status of digital technologies in agriculture has shown a significant rise. For instance, in 2019, automatic section control, variable rate technology, precision maps, yield monitoring, satellite or aerial imaging, and chlorophyll sensors garnered the shares of 40%, 31%, 48%, 44%, 22%, and 5% respectively in the agricultural sector. Thus, the increasing adoption of digital technologies in the agricultural sector is anticipated to accelerate the growth of the variable rate technology market during the forecast period.
North America to Drive the Variable Rate Technology Market
Over the years, the increasing adoption of digital technologies has made it possible to collect huge amounts of critical data at minimal costs, thus making field operations more insight-driven, and potentially more productive and efficient. Until recently, the impact of variable rate treatment application has been limited by the granularity and timeliness of the data they use and their lack of day-to-day operational decision support. However, according to USDA, over 60% of the United States' agricultural input dealers offer some kind of variable-rate technology services. Contrasting to this, less than 20% of the acreage is currently being managed using technology due to the relatively higher costs of gathering precise field data. Thus, the rising availability of the variable rate treatment application services in the United States market is likely to accelerate the variable rate technology market during the forecast period.
Variable Rate Technology Industry Overview
The global variable rate technology market is a niche market, with various small and medium-sized companies coining a very minimal share in the world. This has resulted in very stiff competition. The development of regional markets and local players in different parts of the world is the major factor for the fragmented nature of the market. North America and the Asia Pacific are the two regions showing maximum competitor activities.
Additional Benefits:
- The market estimate (ME) sheet in Excel format
- 3 months of analyst support
TABLE OF CONTENTS
1 INTRODUCTION
- 1.1 Study Deliverables
- 1.2 Study Assumptions
- 1.3 Scope of the Study
2 RESEARCH METHODOLOGY
3 EXECUTIVE SUMMARY
4 MARKET DYNAMICS
- 4.1 Market Overview
- 4.2 Introduction to Market Drivers and Restraints
- 4.3 Market Drivers
- 4.4 Market Restraints
- 4.5 Industry Attractiveness - Porter's Five Force Analysis
- 4.5.1 Threat of New Entrants
- 4.5.2 Bargaining Power of Buyers/Consumers
- 4.5.3 Bargaining Power of Suppliers
- 4.5.4 Threat of Substitute Products
- 4.5.5 Intensity of Competitive Rivalry
5 MARKET SEGMENTATION
- 5.1 Crop Type
- 5.1.1 Cereals & Grains
- 5.1.2 Fruits & Vegetables
- 5.1.3 Oilseeds & Pulses
- 5.1.4 Commercial Crops
- 5.2 Application
- 5.2.1 Fertilizers
- 5.2.2 Crop Protection Chemicals
- 5.2.3 Soil Sensing
- 5.2.4 Yield Monitoring
- 5.2.5 Irrigation
- 5.2.6 Others
- 5.3 Geography
- 5.3.1 North America
- 5.3.1.1 United States
- 5.3.1.2 Canada
- 5.3.1.3 Mexico
- 5.3.1.4 Rest of North America
- 5.3.2 Europe
- 5.3.2.1 Germany
- 5.3.2.2 United Kingdom
- 5.3.2.3 France
- 5.3.2.4 Italy
- 5.3.2.5 Spain
- 5.3.2.6 Rest of Europe
- 5.3.3 Asia Pacific
- 5.3.3.1 China
- 5.3.3.2 Japan
- 5.3.3.3 India
- 5.3.3.4 South Korea
- 5.3.3.5 Rest of Asia-Pacific
- 5.3.4 South America
- 5.3.4.1 Brazil
- 5.3.4.2 Argentina
- 5.3.4.3 Rest of South America
- 5.3.5 Middle East and Africa
- 5.3.5.1 South Africa
- 5.3.5.2 Rest of Middle East and Africa
- 5.3.1 North America
6 COMPETITIVE LANDSCAPE
- 6.1 Market Share Analysis
- 6.2 Most Adopted Strategies
- 6.3 Company Profiles
- 6.3.1 Deere & Company
- 6.3.2 Trimble, Inc.
- 6.3.3 AGCO Corporation
- 6.3.4 Topcon Corporation
- 6.3.5 CNH Industrial N.V.
- 6.3.6 Lindsay Corporation
- 6.3.7 Ageagle Aerial Systems
- 6.3.8 Raven Industries, Inc.
- 6.3.9 AG Leader Technology
- 6.3.10 Valmont Industries, Inc.

