


 |
市场调查报告书
商品编码
1439800
重晶石:市场占有率分析、产业趋势与统计、成长预测(2024-2029)Barite - Market Share Analysis, Industry Trends & Statistics, Growth Forecasts (2024 - 2029) |
||||||
※ 本网页内容可能与最新版本有所差异。详细情况请与我们联繫。
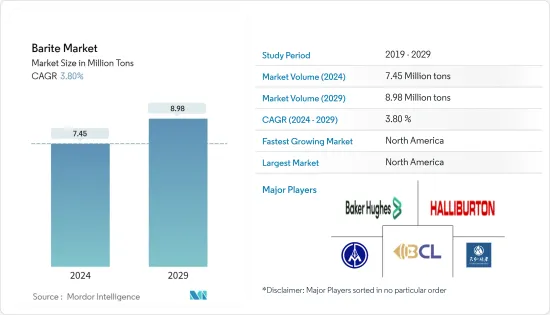
预计2024年重晶石市场规模为745万吨,预计2029年将达到898万吨,在预测期间(2024-2029年)复合年增长率为3.80%。
2020 年,市场受到新型冠状病毒肺炎 (COVID-19) 的负面影响。然而,由于石油和天然气、化学品和橡胶等各个最终用户产业的消费增加,2021年至2022年市场显着復苏。
主要亮点
- 从长远来看,推动重晶石市场的主要因素是石油和天然气钻探活动需求的增加以及全球塑胶产业中重晶石使用量的增加。
- 然而,天青石和铁矿石等类似替代品的供应限制了重晶石市场的成长。
- 重晶石在涂料和医疗行业的快速采用及其在石油和天然气行业的作用可能会为市场带来新的成长机会。
由于石油和天然气行业的发展,重晶石在其中发挥非常重要的作用,预计北美将成为重晶石的最大市场。
重晶石市场趋势
石油和天然气产业的高需求
- 重晶石作为石油和天然气钻井作业中钻井泥浆的称重剂,需求量很大。它可以防止钻井过程中石油和天然气的爆炸性释放,并具有高比重、化学和物理惰性、低溶解度和磁性中性等独特的物理和化学性能。
- 世界上大部分需求来自石油工业。鑑于石油产品在运输和工业最终用途领域的重要性,全球对重晶石的需求将持续下去,直到石油产品成为主要能源来源。
- 重晶石的无腐蚀、无磨蚀性、不溶于水、惰性和高比重等特性,使其能够在钻井作业中用作填充剂,以清除钻头中的切屑并将切屑输送到地面。减少钻柱摩擦、控制压力、防止井喷并提供润滑。
- 石油业未来成长的前景表明,石油探勘将继续成长,重晶石消费也将继续成长。此外,碳氢化合物发现的生产力会随着时间的推移而降低,因此每单位石油需要进行更多的钻探。
- 国际能源总署的一份报告称,随着欧洲天然气价格飙升,发电用石油用量大幅增加以及从天然气转向石油将推动2022年至2023年石油需求的成长轨迹。 2022 年全球需求成长预测每天上调 380 kb。儘管这些成长绝大多数集中在中东和欧洲,掩盖了其他产业的相对疲软,但到2022 年,需求将增加2.1 MB/天,达到99.7 MB/天;2023 年,需求将再增加2.1 MB/天,达到101.8 MB/天。 MB/天。
- 葡萄牙4月至5月燃料油使用量及直接原油发电量增加30kb/d,即173%,而西班牙、英国及日本月增15%至55%,呈逐步成长趋势。
- 此外,根据国际能源总署的数据,2022年全球石油需求预计为170万桶/日,达到9,920万桶/日。在非经合组织国家强劲成长轨迹的推动下,预计 2023 年产量将进一步增加 210 万桶/日。
- 此图显示,石油和天然气产品的需求量逐年增加。 IEA预测,液化石油气和乙烷的需求将从2022年的1432.1万桶/日增加到2023年的1464.2万桶/日。汽车汽油也出现类似趋势,预计需求量将达到 26,137,000 桶/日。产量将从2022年的25,932,000桶/日增加到2023年的25,932,000桶/日。
- 因此,未来几年的市场成长可能会受到全球石油和天然气产业对重晶石需求不断增长的推动。
北美地区占据市场主导地位
- 美国电子市场规模全球最大,是研究市场的主要潜在区域之一。此外,由于先进技术的使用、研发中心数量的增加以及消费者需求的增加,预计在预测期内它将继续保持主导市场的地位。
- 根据总统科学技术顾问委员会 (PCAST) 的报告,大约 12% 的半导体是在美国製造的。到 2021 年,大约 7% 用于製造商品的设备将位于北美。
- 根据皮尤研究中心的数据,85% 的美国拥有智慧型手机。此外,到 2021 年,平板电脑的拥有量将增加至 53%,而桌上型电脑或笔记型电脑的拥有量将增加至 77%。智慧型手机和其他电子产品销售的成长正在为该地区的重晶石创造一个主要市场。
- 根据国际工业组织(OICA)的数据,2021年美国小客车销售量为3,350,050辆。 2021年,加拿大和墨西哥的小客车销量分别为320,605辆和520,112辆。
- 根据美国能源情报署数据,2022年9月原油产量为3.6804亿桶,8月为3.71339亿桶。
- 根据加拿大能源监管机构的数据,加拿大2022年1月的原油产量接近102,709/天,2月份的原油产量为105,354/天。
因此,由于各行业需求的增加,预计北美地区在预测期内对重晶石的需求将大幅增加。
重晶石行业概况
重晶石市场本质上是整合的。市场主要企业包括(排名不分先后)安得拉邦矿业开发公司、贵州天宏矿业公司、哈里伯顿能源服务公司、VariBrite、贝克休斯公司等。
其他福利
- Excel 格式的市场预测 (ME) 表
- 3 个月分析师支持
目录
第一章简介
- 调查先决条件
- 调查范围
第二章调查方法
第三章执行摘要
第四章市场动态
- 促进因素
- 石油和天然气产业需求激增
- 扩大在塑胶行业的使用
- 抑制因素
- 接近替代球员的可用性
- 其他限制
- 产业价值链分析
- 波特五力分析
- 供应商的议价能力
- 买方议价能力
- 新进入者的威胁
- 替代产品和服务的威胁
- 竞争程度
- 定价概览
- 贸易概况
第五章市场区隔(市场规模(数量))
- 类型
- 带床
- 静脉和空腔的填充
- 残留物
- 最终用户产业
- 油和气
- 化学品
- 填料
- 地区
- 亚太地区
- 中国
- 印度
- 东南亚国协
- 其他亚太地区
- 北美洲
- 美国
- 加拿大
- 墨西哥
- 欧洲
- 英国
- 北欧国家
- 俄罗斯
- 独联体国家
- 其他欧洲国家
- 南美洲
- 巴西
- 哥伦比亚
- 南美洲其他地区
- 中东和非洲
- 沙乌地阿拉伯
- 阿拉伯聯合大公国
- 伊朗
- 科威特
- 奈及利亚
- 中东和非洲其他地区
- 生产分析
- 美国
- 中国
- 哈萨克
- 印度
- 墨西哥
- 寮国
- 巴基斯坦
- 摩洛哥
- 伊朗
- 其他的
- 亚太地区
第六章 竞争形势
- 合併、收购、合资、合作和协议
- 市场占有率(%)**/排名分析
- 主要企业采取的策略
- 公司简介
- Andhra Pradesh Mineral Development Corporation Ltd
- Baker Hughes Inc.
- Baribright Co. Ltd
- Cimbar Performance Minerals
- Guizhou Saboman Import and Export Co. Ltd
- Guizhou Tianhong Mining Co.
- Halliburton Energy Services Inc.
- International Earth Products LLC
- New Riverside Ochre
- Newpark Resources Inc.
- Pulapathuri
- PVS Global Trade Private Limited
- Sachtleben Minerals GmbH &Co. KG
- Schlumberger Limited
- The Kish Company Inc.
- Zhongrun Barium Industry Co. Ltd
第七章市场机会与未来趋势
- 重晶石在涂料和医疗产业的应用逐渐增加
- 重晶石在石油天然气产业中的重要作用
The Barite Market size is estimated at 7.45 Million tons in 2024, and is expected to reach 8.98 Million tons by 2029, growing at a CAGR of 3.80% during the forecast period (2024-2029).
The market was negatively impacted by COVID-19 in 2020. However, the market recovered significantly in the 2021-22 period, owing to rising consumption from various end-user industries such as oil and gas, chemicals, rubber, and others.
Key Highlights
- Over the long term, the major factors driving the barite market are the growing demand from oil and gas drilling activities and its growing usage in the plastics industry across the globe.
- However, the availability of close substitutes, such as celestite and iron ore, is restraining the growth of the barite market.
- The surge in the adoption of barite from the paint and medical industries and the role of barite in the oil and gas industry will likely provide new growth opportunities for the market.
North America is forecast to be the largest market for barite, owing to the growing oil and gas industry, where barite plays a very crucial role.
Barite Market Trends
High Demand from the Oil and Gas Industry
- Barite has huge demand in oil and gas drilling operations as a weighing agent in the drilling mud. It prevents the explosive release of oil and gas during drilling and has unique physical and chemical properties such as high specific gravity, chemical and physical inertness, low solubility, and magnetic neutrality.
- The majority of the global demand is from the petroleum industry. The worldwide demand for barite would continue until petroleum products are preferred as the chief source of energy, given their importance in the transportation and industrial end-use sectors.
- The properties of barite, such as its non-corrosiveness, non-abrasiveness, insolubility in water, inertness, and high specific gravity, allow it to be used as a weighting agent in drilling operations to remove cutting from bits, transport cutting to the surface to reduce friction in the drilling string, control pressure, prevent blow-out, and provide lubrication.
- The prospectus for the future growth of the petroleum industry suggests that petroleum exploration will continue to grow, as will the consumption of barite. Furthermore, more drilling must be done per unit of oil as hydrocarbon discoveries become less productive with time.
- According to a report by the International Energy Agency, surging oil use for power generation and gas-to-oil switching in the wake of soaring European natural gas prices are lifting the growth trajectory for oil demand over 2022 and into 2023. As a result, estimates for 2022 global demand growth have been raised by 380 kb/d. These gains, overwhelmingly concentrated in the Middle East and Europe, mask relative weakness in other sectors but will propel demand higher by 2.1 MB/d to 99.7 MB/d in 2022 and by a further 2.1 MB/d to 101.8 MB/d in 2023.
- Portugal's usage of fuel oil and direct crude use for power generation increased by 30 kb/d, or 173%, between April and May, while Spain, the United Kingdom, and Japan saw more moderate monthly increases of between 15% and 55%.
- Also, as per the International Energy Agency, global oil demand in 2022 was estimated at 1.7 million barrels per day, reaching 99.2 million barrels per day. A further 2.1 million barrels/day gain is expected in 2023, led by a strong growth trajectory in non-OECD countries.
- The graph suggests that the demand for oil and gas products is increasing year over year. The IEA predicts that the demand for LPG and ethane will increase from 14,321 thousand barrels per day in 2022 to 14,642 thousand barrels per day in 2023. A similar trend can be observed for motor gasoline, where the demand is predicted to reach 26,137 thousand barrels per day in 2023 from 25,932 thousand barrels per day in 2022.
- So, the growth of the market over the next few years is likely to be driven by the growing demand for barite from the oil and gas industry around the world.
The North America Region to Dominate the Market
- The United States electronics market is the largest in the world in terms of size, acting as one of the leading potential zones for the market studied. Furthermore, it is expected to remain the leading market over the forecast period due to the usage of advanced technology, an increase in the number of R&D centers, and rising demand from consumers.
- According to a report by the president's council of advisors on science and technology (PCAST), about 12 percent of semiconductors are manufactured in the United States. In 2021, about 7% of the equipment used to make things was going to be used in North America.
- According to the Pew Research Center, 85% of the overall population in the United States owns smartphones. In addition, tablet computer ownership has increased to 53% in 2021, while desktop or laptop computer ownership has increased to 77%.The increasing sales of smartphones and other electronic items are creating a major market in the region for barite.
- According to the International Organization of Motor Vehicle Manufacturers (OICA), the sales of passenger cars in the United States in 2021 were 3,350,050. In 2021, passenger car sales in Canada and Mexico were 320,605 and 520,112, respectively.
- According to the US Energy Information Administration, the crude oil production in September 2022 was 368,040 thousand barrels and 371,339 thousand barrels in August.
- According to the Canada Energy Regulator, Canada produced almost 102,709 m3/d of crude oil in January and 105,354 m3/d of crude oil in February 2022.
Hence, with the rising demand from various industries, the demand for barite is expected to grow considerably in the North American region over the forecast period.
Barite Industry Overview
The barite market is consolidated in nature. Some of the key companies in the market (not in particular order) include The Andhra Pradesh Mineral Development Corporation Ltd, Guizhou Tianhong Mining Co. Ltd, Halliburton Energy Services Inc., Baribright Co. Ltd, and Baker Hughes Inc., among others.
Additional Benefits:
- The market estimate (ME) sheet in Excel format
- 3 months of analyst support
TABLE OF CONTENTS
1 INTRODUCTION
- 1.1 Study Assumptions
- 1.2 Scope of the Study
2 RESEARCH METHODOLOGY
3 EXECUTIVE SUMMARY
4 MARKET DYNAMICS
- 4.1 Drivers
- 4.1.1 Rapidly Increasing Demand from the Oil and Gas Industry
- 4.1.2 Growing Use in the Plastic Industry
- 4.2 Restraints
- 4.2.1 Availability of Close Substitutes
- 4.2.2 Other Restraints
- 4.3 Industry Value Chain Analysis
- 4.4 Porter's Five Forces Analysis
- 4.4.1 Bargaining Power of Suppliers
- 4.4.2 Bargaining Power of Buyers
- 4.4.3 Threat of New Entrants
- 4.4.4 Threat of Substitute Products and Services
- 4.4.5 Degree of Competition
- 4.5 Price Overview
- 4.6 Trade Overview
5 MARKET SEGMENTATION (Market Size in Volume)
- 5.1 Type
- 5.1.1 Bedded
- 5.1.2 Vein and Cavity Filling
- 5.1.3 Residual
- 5.2 End-user Industry
- 5.2.1 Oil and Gas
- 5.2.2 Chemical
- 5.2.3 Fillers
- 5.3 Geography
- 5.3.1 Asia-Pacific
- 5.3.1.1 China
- 5.3.1.2 India
- 5.3.1.3 ASEAN Countries
- 5.3.1.4 Rest of Asia-Pacific
- 5.3.2 North America
- 5.3.2.1 United States
- 5.3.2.2 Canada
- 5.3.2.3 Mexico
- 5.3.3 Europe
- 5.3.3.1 United Kingdom
- 5.3.3.2 NORDIC Countries
- 5.3.3.3 Russia
- 5.3.3.4 CIS Countries
- 5.3.3.5 Rest of Europe
- 5.3.4 South America
- 5.3.4.1 Brazil
- 5.3.4.2 Colombia
- 5.3.4.3 Rest of South America
- 5.3.5 Middle-East and Africa
- 5.3.5.1 Saudi Arabia
- 5.3.5.2 United Arab Emirates
- 5.3.5.3 Iran
- 5.3.5.4 Kuwait
- 5.3.5.5 Nigeria
- 5.3.5.6 Rest of Middle-East and Africa
- 5.3.6 Production analysis
- 5.3.7 United States
- 5.3.8 China
- 5.3.9 Kazakhstan
- 5.3.10 India
- 5.3.11 Mexico
- 5.3.12 Laos
- 5.3.13 Pakistan
- 5.3.14 Morocco
- 5.3.15 Iran
- 5.3.16 Other Countries
- 5.3.1 Asia-Pacific
6 COMPETITIVE LANDSCAPE
- 6.1 Mergers, Acquisitions, Joint Ventures, Collaborations, and Agreements
- 6.2 Market Share (%)**/Ranking Analysis
- 6.3 Strategies Adopted by Leading Players
- 6.4 Company Profiles
- 6.4.1 Andhra Pradesh Mineral Development Corporation Ltd
- 6.4.2 Baker Hughes Inc.
- 6.4.3 Baribright Co. Ltd
- 6.4.4 Cimbar Performance Minerals
- 6.4.5 Guizhou Saboman Import and Export Co. Ltd
- 6.4.6 Guizhou Tianhong Mining Co.
- 6.4.7 Halliburton Energy Services Inc.
- 6.4.8 International Earth Products LLC
- 6.4.9 New Riverside Ochre
- 6.4.10 Newpark Resources Inc.
- 6.4.11 Pulapathuri
- 6.4.12 PVS Global Trade Private Limited
- 6.4.13 Sachtleben Minerals GmbH & Co. KG
- 6.4.14 Schlumberger Limited
- 6.4.15 The Kish Company Inc.
- 6.4.16 Zhongrun Barium Industry Co. Ltd
7 MARKET OPPORTUNITIES AND FUTURE TRENDS
- 7.1 Gradual Surge in Adoption of Barite from Paints & Medical Industry
- 7.2 Crucial Role of Barite in the Oil & Gas Industry
 重晶石市场:按类型、品位分析、应用 - 2025-2030 年全球预测
 重晶石市场:成长、未来前景、竞争分析,2024-2032
 2024-2032 年按等级(最高 3.9、特殊等级 4.0、特殊等级 4.1、特殊等级 4.2、特殊等级 4.3 及以上)、应用(石油和天然气、化学品、製药等)和地区的重晶石市场报告
 2024 年重晶石世界市场报告
 全球重晶石市场:规模、份额和趋势分析报告 - 按应用程式、地区、细分市场预测,2024-2030 年
 2024-2028年全球重晶石市场
 重晶石世界市场
 重晶石市场、份额、规模、趋势、产业分析报告:按应用、地区、细分市场预测,2023-2032