


 |
市场调查报告书
商品编码
1440109
羊毛:市场占有率分析、产业趋势与统计、成长预测(2024-2029)Wool - Market Share Analysis, Industry Trends & Statistics, Growth Forecasts (2024 - 2029) |
||||||
※ 本网页内容可能与最新版本有所差异。详细情况请与我们联繫。
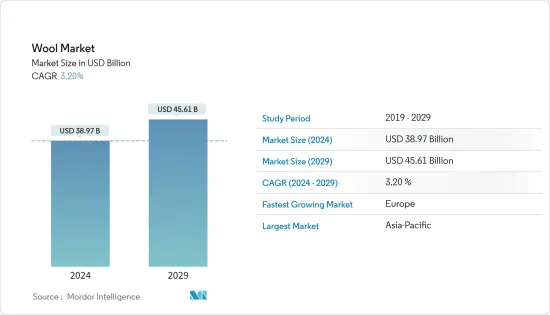
预计2024年羊毛市场规模为389.7亿美元,预计到2029年将达到456.1亿美元,在预测期内(2024-2029年)复合年增长率为3.20%。
随着羊毛製造业的技术进步,纺纱和织布工具正在迅速发展,增加了世界各地的服饰销售。例如,2022年11月,Savio宣布在印度市场推出新型自动绕线机Proxima Smartconer。此类创新可望提高生产力。从长远来看,成长机会主要在于千禧世代消费者,他们强调品质、可靠性和透明度的购买行为正在推动羊毛市场的发展。
IWTO(负责监管羊毛品质和可追溯性的机构)实施的各种措施提高了羊毛价格并鼓励生产。人口成长和都市化加快是推动羊毛市场成长的因素。随着人口的增加,对羊毛服装类的需求也随之增加。根据国际毛纺织组织(IWTO)的数据,羊毛重量的50.0%是纯有机碳。推动羊毛需求的一个因素是中国、美国和欧洲等国家对优质羊毛纤维的国内消费不断增加。
此外,羊毛的高生物分解性也支撑了市场。羊毛可生物分解性并具有绝缘性能,适合消费者使用。所有这些因素预计将增加对羊毛的需求并在预测期内推动市场。
羊毛市场趋势
组织努力确保品质驱动生产
根据 WITO 和现有的最新数据,全球约 12 亿隻羊生产了约 19.49 亿公斤原毛(2021 年),羊群数量较 2020 年增加了 37 亿隻。羊毛供应链很长,从农场到时尚有很多步骤。为了确保透明度和品质、促进羊毛资讯流通并保证买家的质量,IWTO 等组织开发了许多可追溯系统。其中一个制度是国家羊毛声明诚信计划。 《国家羊毛宣言》是一项全球公认的产业倡议,因其农场的透明度和可追溯性。 NWD完整性计划 (NWD-IP) 是一项广泛的案头审核和农场检查计划,其唯一目的是建造羊毛管道并增强消费者对澳洲羊毛的信心。监管机构的所有这些努力也增加了绵羊的饲养以获取羊毛,使得羊毛价格飙升。
由于需求,世界各地绵羊数量的增加也支持了成长。中国的养羊业处于世界领先地位。据联合国粮农组织称,中国羊存栏量从2019年的16,349万隻增加到2020年的1,7,301万隻。因此,羊数量的增加和确保品质的机构努力预计将在预测期内提高羊毛产量。
亚太地区主导市场
羊毛是一种全球贸易商品,市场上的羊毛种类繁多且不断发展。大多数羊毛附有 IWTO 测试证书,确保买家对品质充满信心。亚太地区因其高产量和出口量而在羊毛市场占据主导地位。根据粮农组织统计资料库,澳洲、中国和纽西兰是羊毛的主要生产国。根据ITC Trade统计,2020年,澳洲出口额为15.9532亿美元,其次是中国,出口额为15.43868万美元,占出口总额的36.2%。
印度向义大利、韩国、美国、斯里兰卡、德国、澳洲、阿联酋、瑞典、荷兰、阿曼、阿富汗等国家供应毛织品、手工地毯、服饰和坦尚尼亚。美国是印度羊毛产品的主要进口国,2020-21年出口额达8.556亿美元。毛纺织物主要出口义大利、韩国、英国、美国、斯里兰卡、德国、澳洲等。 2020-21年,这些国家从印度进口了价值51.39亿印度卢比(6,450万美元)的纱线纺织品,占纱线出口总额的64%。同期主要进口国为义大利,占17.5%。
根据联合国商品贸易统计资料库(UN Comtrade)的数据,2021年澳洲向中国出口的羊毛贸易额达到约19亿美元。这是当年澳洲羊毛出口的最高贸易额。澳洲是全球领先的羊毛供应国之一,也是全球最大的羊毛出口国,占全球羊毛出口的39%。由于优质美利奴羊毛在澳洲的生产占主导地位,澳洲羊毛通常作为奢华时装和轻质针织品进行零售。亚太地区服装业越来越注重环保、永续和生物分解性,增加了对舒适羊毛的需求。因此,该地区的市场显然是由千禧世代和 Z 世代推动的。
其他福利
- Excel 格式的市场预测 (ME) 表
- 3 个月分析师支持
目录
第一章 简介
- 研究假设和市场定义
- 调查范围
第二章调查方法
第三章执行摘要
第四章市场动态
- 市场概况
- 市场驱动因素
- 市场限制因素
- 价值链分析
第五章市场区隔
- 地区(产量分析、消费金额及数量分析、进口金额及数量分析、出口金额及数量分析、价格趋势分析)
- 美国
- 墨西哥
- 德国
- 比利时
- 英国
- 荷兰
- 土耳其
- 中国
- 澳洲
- 纽西兰
- 摩洛哥
第六章市场机会与未来趋势
The Wool Market size is estimated at USD 38.97 billion in 2024, and is expected to reach USD 45.61 billion by 2029, growing at a CAGR of 3.20% during the forecast period (2024-2029).
With the technological advancements in the wool manufacturing industry, there is a rapid development of spinning and weaving tools leading to increased sales of clothing across the globe. For instance, in November 2022, Savio announced the launch of an automatic new winding machine Proxima Smartconer in the Indian market. Such innovations are expected to increase productivity. Over the long term, growth opportunities mainly lie with millennial consumers whose purchasing behavior, such as the preference for quality, authenticity, and transparency, is driving the market for wool.
Various measures undertaken by the IWTO, a regulating authority for wool quality and traceability, are fetching higher prices for wool, thus encouraging production. Growing population and rising urbanization are the factors boosting the growth of the wool market. As the population increases, the demand for wool clothing rises. According to International Wool Textile Organization (IWTO), 50.0% weight of the wool is pure organic carbon. The factor driving wool demand is the increasing domestic consumption of luxury wool textiles in countries such as China, the United States, and Europe.
Moreover, the biodegradable quality of wool is also supporting the market. Wool is a natural decomposer since it is biodegradable and provides less harm to the environment. In addition, wool consists of thermal insulation properties making it suitable for consumers. All these factors are expected to increase the demand for wool, thus driving the market during the forecast period.
Wool Market Trends
Institutional Initiatives Ensuring the Quality is Driving the Production
According to WITO and the most recent available figures, around 1,949 million kg (2021) of raw wool was produced by around 1.2 billion sheep around the world, and the sheep population rose by 3.7 billion from 2020. The wool supply chain is long, with many steps en route from farm to fashion. To ensure transparency and quality and to facilitate the flow of information about wool to assure buyers of the qualities being purchased, institutions like IWTO have developed many traceability systems. One such system is the National Wool Declaration Integrity Program. The National Wool Declaration is an industry initiative recognized globally for its transparency and traceability from the farm. The NWD Integrity Program (NWD-IP) is an extensive program of Desktop Audits and On-Farm Inspections with the single purpose of building a wool pipeline and consumer confidence in Australian wool. With all these initiatives put forth by the regulating authority, wool is fetching a higher price because sheep rearing for wool is also increasing.
The increase in the sheep population across the globe owing to the demand is also supporting the growth. China is the leader in terms of sheep rearing globally. According to FAO, the sheep population in China increased from 163.49 million in 2019 to 173.01 million in 2020. Thus, the increasing sheep population and the institutional initiatives for ensuring quality are expected to drive wool production during the forecast period.
Asia-Pacific Dominates the Market
Wool is a commodity traded globally, and its diversity in the market is vast and ever-evolving. With most of the wool sold with an IWTO Test Certificate, the buyer's confidence in quality is guaranteed. The Asia-Pacific region is dominating the wool market with high production and exports. According to FAOSTAT, Australia, China, and New Zealand are the major producers of wool. According to ITC Trade, in 2020, Australia accounted for the highest exports worth USD 1,595,320 thousand, followed by China, accounting for exports worth USD 1,543,868 thousand in 2020, contributing 36.2% of the total export.
India exports woolen yarn fabrics, hand-made carpets, and ready-made garments to Italy, Korea, the United Kingdom, the United States, Sri Lanka, Germany, Australia, the United Arab Emirates, Sweden, the Netherlands, Oman, Afghanistan, and Tanzania, among others. The United States is a major importer of woolen products from India, with exports valued at USD 855.6 million in 2020-21. Woolen fabrics are mainly exported to Italy, Korea, the United Kingdom, the United States, Sri Lanka, Germany, and Australia. During 2020-21, these countries imported INR 513.9 crore (USD 64.5 million) worth of yarn fabrics from India, representing a share of 64% of the total yarn exports. Italy was the major importer during the same period at 17.5%.
According to UN Comtrade, in 2021, the trade value of wool exported from Australia to China amounted to about USD 1.9 billion. This was the highest trade value of wool exported from Australia that year. Australia is the leading global supplier of wool and the world's largest wool export nation, accounting for 39% of global wool exports. Given the dominance of fine Merino production in Australia, Australian wool is typically retailed as high-end fashion and lightweight knitwear. With the trend toward eco-friendly, sustainable, and biodegradable parameters in the Asia-Pacific apparel industry, the demand for wool is growing as it provides comfort. Thus, the market is driven explicitly by the millennial and Gen Z population in the region.
Additional Benefits:
- The market estimate (ME) sheet in Excel format
- 3 months of analyst support
TABLE OF CONTENTS
1 INTRODUCTION
- 1.1 Study Assumptions and Market Definition
- 1.2 Scope of the Study
2 RESEARCH METHODOLOGY
3 EXECUTIVE SUMMARY
4 MARKET DYNAMICS
- 4.1 Market Overview
- 4.2 Market Drivers
- 4.3 Market Restraints
- 4.4 Value Chain Analysis
5 MARKET SEGMENTATION
- 5.1 Geography (Production Analysis, Consumption Analysis by Value and Volume, Import Analysis by Value and Volume, Export Analysis by Value and Volume, and Price Trend Analysis)
- 5.1.1 United States
- 5.1.2 Mexico
- 5.1.3 Germany
- 5.1.4 Belgium
- 5.1.5 United Kingdom
- 5.1.6 Netherlands
- 5.1.7 Turkey
- 5.1.8 China
- 5.1.9 Australia
- 5.1.10 New Zealand
- 5.1.11 Morocco


