


 |
市场调查报告书
商品编码
1440531
钾肥:全球市场占有率分析、产业趋势与统计、成长预测(2024-2030)Global Potash Fertilizer - Market Share Analysis, Industry Trends & Statistics, Growth Forecasts (2024 - 2030) |
||||||
价格
※ 本网页内容可能与最新版本有所差异。详细情况请与我们联繫。
简介目录
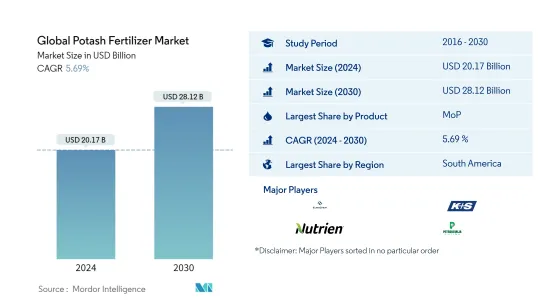
预计2024年全球钾肥市场规模为201.7亿美元,预计2030年将达281.2亿美元,在预测期(2024-2030年)成长5.69%,复合年增长率成长。
主要亮点
- 按类型划分,MoP 是成长最快的部分:钾盐 (MoP) 的钾含量最高,为 60.0%,最常用作相对便宜的钾肥。
- 按作物类型划分最大的部分是田间作物:田间作物在世界各地广泛种植,并且是世界许多地区的主食。在大多数农业国家,它们在单位面积中所占的份额最大。
- 依使用量最大的部分是土壤:土壤施用是一种无需设备的便捷施肥方法。这种施用方法有助于改善植物健康和土壤肥力。
- 最大的国家是巴西:巴西的土壤本质上是酸性的,因此钾的可用性有限。巴西拥有约7461万公顷耕地,需要大量钾。
钾肥市场趋势
按产品划分,MoP 是最大的细分市场。
- 钾肥(MoP)是钾含量最高的钾肥,钾含量为60.0%。 2021年全球钾盐市场价值135.6亿美元,同年消费量量达3,460万吨。此外,它还占世界钾肥消费量总量的90.6%。
- 钾含量50.0%的硫酸钾是全球第二受欢迎的钾肥。 2021年全球SoP肥料市场价值12亿美元,消费量180万吨。
- 南美洲是最大的钾肥市场,2022年将占41.0%的市场占有率。这是由于巴西等南美国家钾肥产量增加以及钾肥需求旺盛所致。
- 其他重要的钾肥包括钾镁钾肥和光卤石。这些肥料占全球钾肥消费量总量的1.7%。 2021年,其他化肥领域的价值为2.618亿美元,消费量为51.46万吨。
- 此外,与MoP和其他钾肥相比,硫酸钾的价格昂贵。例如,自2017年以来,SoP的价格几乎是氯化钾的两倍,2021年更是增加了一倍以上。儘管价格较高,但 SoP 肥料的高价格导致市场占有率低于 MoP。品质.
- 由于提高作物生产力的需求不断增加等因素,钾肥市场预计在预测期内将成长。
南美洲是最大的区域部分。
- 南美洲在全球钾肥市场占据主导地位,2021年占市场价值的34.2%。据分析,2021年南美洲钾肥市场价值为51亿美元。从肥料种类来看,常规钾肥占肥料的大部分。约占市场71.1%,其次是特种钾肥,2021年将贡献28.8%。
- 由于南美洲作物对钾肥的需求量大,钾肥占了国内市场的最大份额。南美洲大量进口化肥,2017 年至 2018 年进口了 700 万吨钾肥(粮农组织)。
- 欧洲占全球第二大市场占有率,2021年市场占有率为23.0%。在欧洲,消耗大部分化肥的其他欧洲国家包括波兰、比利时和东南欧国家,占化肥产量的70.5%。欧洲化肥市场价值巨大,预计在预测期内复合年增长率为 3.6%。
- 北美是第三大钾肥市场,占21.3%,其中美国占主导地位,约占北美钾肥市场总量的84.3%,2021年价值约27亿美元。约占北美农业用地总量的69.0%。
- 新兴市场的大多数土壤普遍存在缺钾现象。因此,农民正在使用钾肥来最大限度地减少钾缺乏并提高生产力,这进一步推动了市场的成长。
钾肥业概况
全球钾肥市场较为集中,前五名企业占比达67.38%。该市场的主要企业包括(按字母顺序排列)Eurochem、K+S AKTIENGESELLSCHAFT、Nutrien Limited、Petrokemija DD Fertilizer Factory 和 The Mosaic Co。
其他福利
- Excel 格式的市场预测 (ME) 表
- 3 个月分析师支持
目录
第一章执行摘要和主要发现
第二章 报告条款
第三章简介
- 研究假设和市场定义
- 调查范围
- 调查方法
第四章 产业主要趋势
- 主要作物种植面积
- 平均养分施用量
- 法律规范
- 价值炼和通路分析
第五章市场区隔
- 类型
- 直的
- 钾
- 拖把
- SoP
- 其他的
- 直的
- 如何使用
- 施肥
- 叶子
- 土壤
- 作物类型
- 田里的作物
- 园艺作物
- 草坪和装饰
- 地区
- 亚太地区
- 澳洲
- 孟加拉
- 中国
- 印度
- 印尼
- 日本
- 巴基斯坦
- 菲律宾
- 泰国
- 越南
- 其他亚太地区
- 欧洲
- 法国
- 德国
- 义大利
- 荷兰
- 俄罗斯
- 西班牙
- 乌克兰
- 英国
- 其他欧洲国家
- 中东和非洲
- 奈及利亚
- 沙乌地阿拉伯
- 南非
- 土耳其
- 其他中东和非洲
- 北美洲
- 加拿大
- 墨西哥
- 美国
- 北美其他地区
- 南美洲
- 阿根廷
- 巴西
- 南美洲其他地区
- 亚太地区
第六章 竞争形势
- 重大策略倡议
- 市场占有率分析
- 公司形势
- 公司简介
- Coromandel International Ltd.
- Eurochem
- Intrepid Potash Inc.
- K+S AKTIENGESELLSCHAFT
- Nutrien Limited
- Petrokemija DD Fertilizer Factory
- Sinofert Holdings Ltd.
- Sociedad Quimica y Minera(SQM)
- The Mosaic Co.
第七章 CEO 面临的关键策略问题
第8章附录
- 世界概况
- 概述
- 波特的五力框架
- 全球价值链分析
- 市场动态(DRO)
- 来源和参考文献
- 表格和图形列表
- 重要见解
- 资料包
- 词彙表
简介目录
Product Code: 92583
The Global Potash Fertilizer Market size is estimated at USD 20.17 billion in 2024, and is expected to reach USD 28.12 billion by 2030, growing at a CAGR of 5.69% during the forecast period (2024-2030).
Key Highlights
- Fastest growing segment by Type - MoP : Muriate of potash (MoP) is a potassic fertilizer with the highest potash content of 60.0%, with a comparatively less price making it most used potassic fertilizer.
- Largest Segment by Crop Type - Field Crops : Field crops are widely cultivated worldwide and are a staple food in many parts of the world. They account for a maximum share by area in most agricultural countries.
- Largest Segment by Application Mode - Soil : Soil application is a convenient way of applying fertilizers without any equipment. This method of application helps in improving both plant health and soil fertility.
- Largest segment by Country - Brazil : The soils of Brazil are mostly acidic in nature, thus limiting the availability of K. Brazil has around 74.61 million ha of cropland, requiring a large amount of potassium.
Potash Fertilizer Market Trends
MoP is the largest segment by Product.
- Muriate of potash (MoP) is a potassic fertilizer with the highest potash content of 60.0%. The global market for Muriate of Potash is valued at USD 13.56 billion in the year 2021 with a volume consumption of 34.6 million metric tons in the same year. Moreover, it accounts for 90.6% of the total potassium fertilizer consumption globally.
- Sulphate of potash with 50.0% of potassium content, is the second most preferred potassium fertilizer globally. The global SoP fertilizer market is valued at USD 1.20 billion in the year 2021. with a volume consumption of 1.8 million metric tons.
- South America is the largest market for potassic fertilizer, and it accounts for a market share of 41.0% in the year 2022. This is attributed to the higher production of potassic fertilizers in the South American countries like Brazil, along with high demand for Potassic fertilizers by the crops grown in the region.
- Other important potassic fertilizers include Langbeinite and Carnallite. These fertilizers account for 1.7% of the total potassic fertilizer consumption in the world. In the year 2021, the other fertilizer segment is valued at USD 261.8 million, with a volume consumption of 514.6 thousand metric tons.
- Moreover, the price of Sulphate of Potash is higher compared to MoP and other potassic fertilizers. For instance, the price of SoP has been close to double the price of Muriate of Potash since 2017 and it was more than double in the year 2021. The high price of SoP fertilizer has given it the less market share over MoP despite of the higher quality.
- The market for potassic fertilizers is anticipated to grow during the forecast period, owing tot the factors like the increased need for higher crop productivity.
South America is the largest segment by Region.
- South America dominates the global potash fertilizers market, accounting for 34.2% of the market value in 2021. According to the analysis, the South American potash fertilizer market was valued at USD 5.10 billion in 2021. By fertilizer type, conventional potash fertilizers dominate the fertilizer market accounting for about 71.1% followed by specialty potash fertilizers contributing to 28.8% in 2021.
- Owing to the high demand for potash for South American crops, the potassic fertilizer, occupies the largest share of the domestic market. South America imports fertilizers extensively, in between 2017-2018, it imported 7.0 million metric ton of potash fertilizes (FAO).
- Europe accounts for the second largest market share globally accounting for 23.0% market share in 2021. in europe, the rest of European countries that consume the majority of fertilizers include Poland, Belgium, and South-eastern European countries and it accounts for 70.5 % of the value of Europe fertilizer market and anticipated to grow at a CAGR of 3.6% during the forecast period.
- North America is the third largest potash fertilizer market accounted for 21.3%, the United States dominates the market, and it accounts for about 84.3% of the total North America potassic fertilizer market value, valued at about USD 2.70 billion in 2021. This is because it occupied about 69.0% of total agricultural land in North America.
- Potassium deficiency is commonly noticed in most soils across developing markets; Therefore, farmers are using potash fertilizers to minimize potassium deficiencies and increase their productivity, which is further driving the growth of the market.
Potash Fertilizer Industry Overview
The Global Potash Fertilizer Market is fairly consolidated, with the top five companies occupying 67.38%. The major players in this market are Eurochem, K+S AKTIENGESELLSCHAFT, Nutrien Limited, Petrokemija DD Fertilizer Factory and The Mosaic Co. (sorted alphabetically).
Additional Benefits:
- The market estimate (ME) sheet in Excel format
- 3 months of analyst support
TABLE OF CONTENTS
1 EXECUTIVE SUMMARY & KEY FINDINGS
2 REPORT OFFERS
3 INTRODUCTION
- 3.1 Study Assumptions & Market Definition
- 3.2 Scope of the Study
- 3.3 Research Methodology
4 KEY INDUSTRY TRENDS
- 4.1 Acreage Of Major Crop Types
- 4.2 Average Nutrient Application Rates
- 4.3 Regulatory Framework
- 4.4 Value Chain & Distribution Channel Analysis
5 MARKET SEGMENTATION
- 5.1 Type
- 5.1.1 Straight
- 5.1.1.1 Potassic
- 5.1.1.1.1 MoP
- 5.1.1.1.2 SoP
- 5.1.1.1.3 Others
- 5.1.1 Straight
- 5.2 Application Mode
- 5.2.1 Fertigation
- 5.2.2 Foliar
- 5.2.3 Soil
- 5.3 Crop Type
- 5.3.1 Field Crops
- 5.3.2 Horticultural Crops
- 5.3.3 Turf & Ornamental
- 5.4 Region
- 5.4.1 Asia-Pacific
- 5.4.1.1 Australia
- 5.4.1.2 Bangladesh
- 5.4.1.3 China
- 5.4.1.4 India
- 5.4.1.5 Indonesia
- 5.4.1.6 Japan
- 5.4.1.7 Pakistan
- 5.4.1.8 Philippines
- 5.4.1.9 Thailand
- 5.4.1.10 Vietnam
- 5.4.1.11 Rest Of Asia-Pacific
- 5.4.2 Europe
- 5.4.2.1 France
- 5.4.2.2 Germany
- 5.4.2.3 Italy
- 5.4.2.4 Netherlands
- 5.4.2.5 Russia
- 5.4.2.6 Spain
- 5.4.2.7 Ukraine
- 5.4.2.8 United Kingdom
- 5.4.2.9 Rest Of Europe
- 5.4.3 Middle East & Africa
- 5.4.3.1 Nigeria
- 5.4.3.2 Saudi Arabia
- 5.4.3.3 South Africa
- 5.4.3.4 Turkey
- 5.4.3.5 Rest Of Middle East & Africa
- 5.4.4 North America
- 5.4.4.1 Canada
- 5.4.4.2 Mexico
- 5.4.4.3 United States
- 5.4.4.4 Rest Of North America
- 5.4.5 South America
- 5.4.5.1 Argentina
- 5.4.5.2 Brazil
- 5.4.5.3 Rest Of South America
- 5.4.1 Asia-Pacific
6 COMPETITIVE LANDSCAPE
- 6.1 Key Strategic Moves
- 6.2 Market Share Analysis
- 6.3 Company Landscape
- 6.4 Company Profiles
- 6.4.1 Coromandel International Ltd.
- 6.4.2 Eurochem
- 6.4.3 Intrepid Potash Inc.
- 6.4.4 K+S AKTIENGESELLSCHAFT
- 6.4.5 Nutrien Limited
- 6.4.6 Petrokemija DD Fertilizer Factory
- 6.4.7 Sinofert Holdings Ltd.
- 6.4.8 Sociedad Quimica y Minera (SQM)
- 6.4.9 The Mosaic Co.
7 KEY STRATEGIC QUESTIONS FOR FERTILIZER CEOS
8 APPENDIX
- 8.1 Global Overview
- 8.1.1 Overview
- 8.1.2 Porter's Five Forces Framework
- 8.1.3 Global Value Chain Analysis
- 8.1.4 Market Dynamics (DROs)
- 8.2 Sources & References
- 8.3 List of Tables & Figures
- 8.4 Primary Insights
- 8.5 Data Pack
- 8.6 Glossary of Terms

