


 |
市场调查报告书
商品编码
1440535
微量元素肥料:全球市场占有率分析、产业趋势与统计、成长预测(2024-2030)Global Micronutrient Fertilizer - Market Share Analysis, Industry Trends & Statistics, Growth Forecasts (2024 - 2030) |
||||||
※ 本网页内容可能与最新版本有所差异。详细情况请与我们联繫。
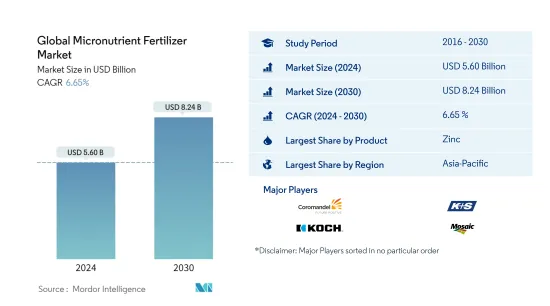
预计2024年全球微量元素肥料市场规模为56亿美元,预计到2030年将达到82.4亿美元,在预测期内(2024-2030年)增长6.65%,以复合年增长率增长。
主要亮点
- 按类型划分最大的部分是锌:由于主要种植区土壤中锌缺乏的情况日益严重,锌是最常用的微量元素肥料。事实证明,施用锌可以提高产量。
- 按类型划分,成长最快的部分是铁:高 pH 值的碱性土壤缺乏铁微量营养素。农业土壤健康和品质的恶化正在减少铁的利用率。
- 按作物类型划分最大的部分是田间作物:田间作物在世界各地广泛种植,并且是世界许多地区的主食。在大多数农业国家,它们在单位面积中所占的份额最大。
- 最大的国家,印度:根据科学与环境中心的数据,印度土壤缺乏硼(47%)、铁(37%)和锌(39%),导致微量元素肥料的使用增加。马苏。
微量元素肥料市场趋势
锌是最大的产品领域。
- 微量营养素在许多植物代谢活动中发挥重要作用,例如细胞壁形成、花粉形成、发芽、叶绿素产生、固氮和蛋白质重要部分的合成。预计全球微量元素肥料市场在预测期内复合年增长率为 3.0%。
- 2021年锌占全球微量元素肥料市占率38.3%。在锌肥所占的总份额中,常规锌肥约占65.7%,特种锌肥约占34.3%。与传统肥料相比,特种锌肥具有分布均匀、作用迅速于作物的优点。
- 亚太地区主导全球市场,2021年占市场占有率的31.6%。在亚太主要国家建立了微量元素肥料分销网络,进一步带动了亚太地区各类微量元素肥料产品的市场。粮食需求的增加加上土壤养分的减少是推动该地区市场成长的关键因素之一。最近的研究表明,锌缺乏是中国最常见的微量营养素缺乏症。超过 50% 的耕地缺锌,限制了农业成长和人类营养状况的改善。
- 随着各政府机构和其他组织越来越多地鼓励增加微量营养素的使用以增强植物和土壤健康,微量营养素缺乏在世界范围内变得越来越普遍,人们越来越关注植物健康。这些因素正在推动市场成长。
亚太地区是最大的地区。
- 研究期间,全球微量元素肥料市场稳定成长,2021年市场规模为36.1亿美元,总消费量为150万吨。 2021年,亚太地区占最大市场占有率,为38.8%,其次是欧洲和北美。
- 在亚太地区,印度和中国等国家是微量元素肥料的主要市场,2021年分别占36.0%和17.0%的市场占有率。 2021年,华人作物微量营养素缺乏症日益严重,占微量元素肥料消费量的73.6%。中国农业部 (MoA) 已将锌添加到其国家肥料建议中,添加量为 15-30 公斤硫酸锌/公顷,并且该建议最近已扩展到水稻和玉米等夏季作物。
- 法国是欧洲第三大微量元素肥料市场,仅次于俄罗斯,预计2022年市值为1.219亿美元。园艺作物种植面积不断增加,从2017年的120万公顷增加到2021年的130万公顷,预计未来几年将进一步增加。
- 在亚洲以外,撒哈拉以南非洲和南美洲西北部土壤缺锌和铁的情况非常普遍。微量元素肥料的整体效益现已被广泛接受和认可。 2021年,全球锌出口额为160万美元,其中微量营养素的最大出口国为荷兰,价值27.56万美元。
- 全球微量营养素肥料市场的推动因素是全球微量营养素缺乏症的普遍存在,铁和锌缺乏对植物健康的影响日益引起人们的关注,以及政府采取的各种增加微量营养素使用的倡议,并且由于机构的不断鼓励,该市场正在不断增长。
微量元素肥料产业概况
全球微量元素肥料市场较为集中,前5名企业占102.95%。市场的主要企业包括(按字母顺序排列)Coromandel International Limited、K+S AKTIENGESELLSCHAFT、Koch Industries Inc.、The Mosaic Company 和 Yara International。
其他福利
- Excel 格式的市场预测 (ME) 表
- 3 个月分析师支持
目录
第一章执行摘要和主要发现
第二章 检举要约
第三章简介
- 研究假设和市场定义
- 调查范围
- 调查方法
第四章 产业主要趋势
- 主要作物种植面积
- 平均养分施用量
- 法律规范
- 价值炼和通路分析
第五章市场区隔
- 产品
- 硼
- 铜
- 铁
- 锰
- 钼
- 锌
- 其他的
- 如何使用
- 滴水
- 叶面
- 土壤
- 作物类型
- 田里的作物
- 园艺作物
- 草坪和装饰
- 地区
- 亚太地区
- 澳洲
- 孟加拉
- 中国
- 印度
- 印尼
- 日本
- 巴基斯坦
- 菲律宾
- 泰国
- 越南
- 其他亚太地区
- 欧洲
- 法国
- 德国
- 义大利
- 荷兰
- 俄罗斯
- 西班牙
- 乌克兰
- 英国
- 其他欧洲国家
- 中东和非洲
- 奈及利亚
- 沙乌地阿拉伯
- 南非
- 土耳其
- 其他中东和非洲
- 北美洲
- 加拿大
- 墨西哥
- 美国
- 北美其他地区
- 南美洲
- 阿根廷
- 巴西
- 南美洲其他地区
- 亚太地区
第六章 竞争形势
- 重大策略倡议
- 市场占有率分析
- 公司形势
- 公司简介
- BMS Micro-Nutrients NV
- Coromandel International Limited
- Haifa Group
- K+S AKTIENGESELLSCHAFT
- Koch Industries Inc.
- Nouryon Cooperatief UA
- The Mosaic Company
- Yara International
第七章 CEO 面临的关键策略问题
第8章附录
- 世界概况
- 概述
- 波特的五力框架
- 全球价值链分析
- 市场动态(DRO)
- 来源和参考文献
- 表格和图形列表
- 重要见解
- 资料包
- 词彙表
The Global Micronutrient Fertilizer Market size is estimated at USD 5.60 billion in 2024, and is expected to reach USD 8.24 billion by 2030, growing at a CAGR of 6.65% during the forecast period (2024-2030).
Key Highlights
- Largest Segment by Type - Zinc : Zn is the most applied micronutrient fertilizer due to the increasing Zn deficiencies in soils of major growing regions. The application of Zn is proven to give higher yields.
- Fastest growing segment by Type - Iron : The alkaline soils with high pH are deficient in iron micronutrients. The degrading health and quality of agricultural soils are declining the availability of iron.
- Largest Segment by Crop Type - Field Crops : Field crops are widely cultivated worldwide and are a staple food in many parts of the world. They account for a maximum share by area in most agricultural countries.
- Largest segment by Country - India : Micronutrient fertilizers are being used increasingly as Indian soils are deficient in boron (47%), iron (37%), and zinc (39%), as per the Center for Science and Environment.
Micronutrient Fertilizer Market Trends
Zinc is the largest segment by Product.
- Micronutrients play an important role in many plant metabolic activities, such as cell wall formation, pollen formation, germination, chlorophyll production, nitrogen fixation, and the synthesis of the essential parts of proteins. The global micronutrient fertilizer market is anticipated to register a CAGR of 3.0% during the forecast period.
- Zinc accounted for a share of 38.3% of the global micronutrient fertilizer market in 2021. Of the total share held by zinc fertilizers, conventional zinc fertilizers accounted for about 65.7%, and specialty zinc fertilizers accounted for about 34.3%. Specialty zinc fertilizers have the advantage of uniform distribution and fast acting on crops compared to conventional fertilizers.
- The Asia-Pacific region dominated the global market, accounting for 31.6% of the market share in 2021. The distribution network of micronutrient fertilizers is well-established in the major Asia-Pacific countries, further boosting the market for various micronutrient fertilizer products in the region. The increasing demand for food grains, coupled with decreasing nutrients in the soil, is one of the major factors driving the growth of the market in the region. Recent studies have indicated that zinc deficiency is China's most widespread micronutrient deficiency. More than 50% of the arable soils are low in zinc, thereby limiting agricultural growth and improvement in human nutrition.
- Widespread micronutrient deficiencies across the world are becoming a rising concern for plant health, coupled with increasing encouragement from various government agencies and other organizations to increase the use of micronutrients to enhance plant and soil health. These factors are driving the market growth.
Asia-Pacific is the largest segment by Region.
- The global micronutrient fertilizer market grew at a stable rate during the study period, with a value of USD 3.61 billion in 2021 and an overall consumption volume of 1.5 million metric ton. Asia-Pacific occupied the largest market share of 38.8% in 2021, followed by Europe and North America.
- In Asia-Pacific, countries such as India and China are the major micronutrient fertilizer markets, accounting for 36.0% and 17.0% of the market share in 2021. The increase in micronutrient deficiency in Chinese crops resulted in 73.6% of micronutrient fertilizer consumption in 2021 in China. The Ministry of Agriculture (MoA) of China added zinc, at a rate of 15-30 kg ZnSO4/ha, to its national fertilizer recommendation, which was recently extended for summer crops like rice and corn.
- France is the third-largest market for micronutrient fertilizer in Europe after Russia, with an estimated market value of USD 121.9 million in 2022. The increasing area under cultivation of horticulture crops, which increased from 1.2 million hectares in 2017 to 1.3 million hectares in 2021, is further expected to increase in the following years.
- Apart from Asia, zinc and iron deficiency in the soil is quite widespread in Sub-Saharan Africa and the northwest of South America. The overall advantages of micronutrient fertilizers are being widely accepted and recognized currently. The global export value for zinc in 2021 amounted to USD 1.6 million, with the Netherlands as the top exporter of the micronutrients, with a value of USD 275.6 thousand.
- The global micronutrient fertilizer market is growing because of the widespread micronutrient deficiencies around the world, with iron and zinc deficiencies becoming a rising concern for plant health, and also due to the increasing encouragement from various government agencies to increase the use of micronutrients.
Micronutrient Fertilizer Industry Overview
The Global Micronutrient Fertilizer Market is fairly consolidated, with the top five companies occupying 102.95%. The major players in this market are Coromandel International Limited, K+S AKTIENGESELLSCHAFT, Koch Industries Inc., The Mosaic Company and Yara International (sorted alphabetically).
Additional Benefits:
- The market estimate (ME) sheet in Excel format
- 3 months of analyst support
TABLE OF CONTENTS
1 EXECUTIVE SUMMARY & KEY FINDINGS
2 REPORT OFFERS
3 INTRODUCTION
- 3.1 Study Assumptions & Market Definition
- 3.2 Scope of the Study
- 3.3 Research Methodology
4 KEY INDUSTRY TRENDS
- 4.1 Acreage Of Major Crop Types
- 4.2 Average Nutrient Application Rates
- 4.3 Regulatory Framework
- 4.4 Value Chain & Distribution Channel Analysis
5 MARKET SEGMENTATION
- 5.1 Product
- 5.1.1 Boron
- 5.1.2 Copper
- 5.1.3 Iron
- 5.1.4 Manganese
- 5.1.5 Molybdenum
- 5.1.6 Zinc
- 5.1.7 Others
- 5.2 Application Mode
- 5.2.1 Fertigation
- 5.2.2 Foliar
- 5.2.3 Soil
- 5.3 Crop Type
- 5.3.1 Field Crops
- 5.3.2 Horticultural Crops
- 5.3.3 Turf & Ornamental
- 5.4 Region
- 5.4.1 Asia-Pacific
- 5.4.1.1 Australia
- 5.4.1.2 Bangladesh
- 5.4.1.3 China
- 5.4.1.4 India
- 5.4.1.5 Indonesia
- 5.4.1.6 Japan
- 5.4.1.7 Pakistan
- 5.4.1.8 Philippines
- 5.4.1.9 Thailand
- 5.4.1.10 Vietnam
- 5.4.1.11 Rest Of Asia-Pacific
- 5.4.2 Europe
- 5.4.2.1 France
- 5.4.2.2 Germany
- 5.4.2.3 Italy
- 5.4.2.4 Netherlands
- 5.4.2.5 Russia
- 5.4.2.6 Spain
- 5.4.2.7 Ukraine
- 5.4.2.8 United Kingdom
- 5.4.2.9 Rest Of Europe
- 5.4.3 Middle East & Africa
- 5.4.3.1 Nigeria
- 5.4.3.2 Saudi Arabia
- 5.4.3.3 South Africa
- 5.4.3.4 Turkey
- 5.4.3.5 Rest Of Middle East & Africa
- 5.4.4 North America
- 5.4.4.1 Canada
- 5.4.4.2 Mexico
- 5.4.4.3 United States
- 5.4.4.4 Rest Of North America
- 5.4.5 South America
- 5.4.5.1 Argentina
- 5.4.5.2 Brazil
- 5.4.5.3 Rest Of South America
- 5.4.1 Asia-Pacific
6 COMPETITIVE LANDSCAPE
- 6.1 Key Strategic Moves
- 6.2 Market Share Analysis
- 6.3 Company Landscape
- 6.4 Company Profiles
- 6.4.1 BMS Micro-Nutrients NV
- 6.4.2 Coromandel International Limited
- 6.4.3 Haifa Group
- 6.4.4 K+S AKTIENGESELLSCHAFT
- 6.4.5 Koch Industries Inc.
- 6.4.6 Nouryon Cooperatief UA
- 6.4.7 The Mosaic Company
- 6.4.8 Yara International
7 KEY STRATEGIC QUESTIONS FOR FERTILIZER CEOS
8 APPENDIX
- 8.1 Global Overview
- 8.1.1 Overview
- 8.1.2 Porter's Five Forces Framework
- 8.1.3 Global Value Chain Analysis
- 8.1.4 Market Dynamics (DROs)
- 8.2 Sources & References
- 8.3 List of Tables & Figures
- 8.4 Primary Insights
- 8.5 Data Pack
- 8.6 Glossary of Terms

